Temperature 2m Temperature (Berkeley Earth) CMIP6
CMIP6 Multi-Model Mean Context
Comparison with CMIP6 ensemble mean from 11 members.
Contributing models: ACCESS-ESM1-5, AWI-CM-1-1-MR, CNRM-CM6-1, CNRM-ESM2-1, EC-Earth3, FGOALS-g3, GISS-E2-1-G, INM-CM5-0, IPSL-CM6A-LR, MPI-ESM1-2-LR, MRI-ESM2-0
Synthesis
Related diagnostics
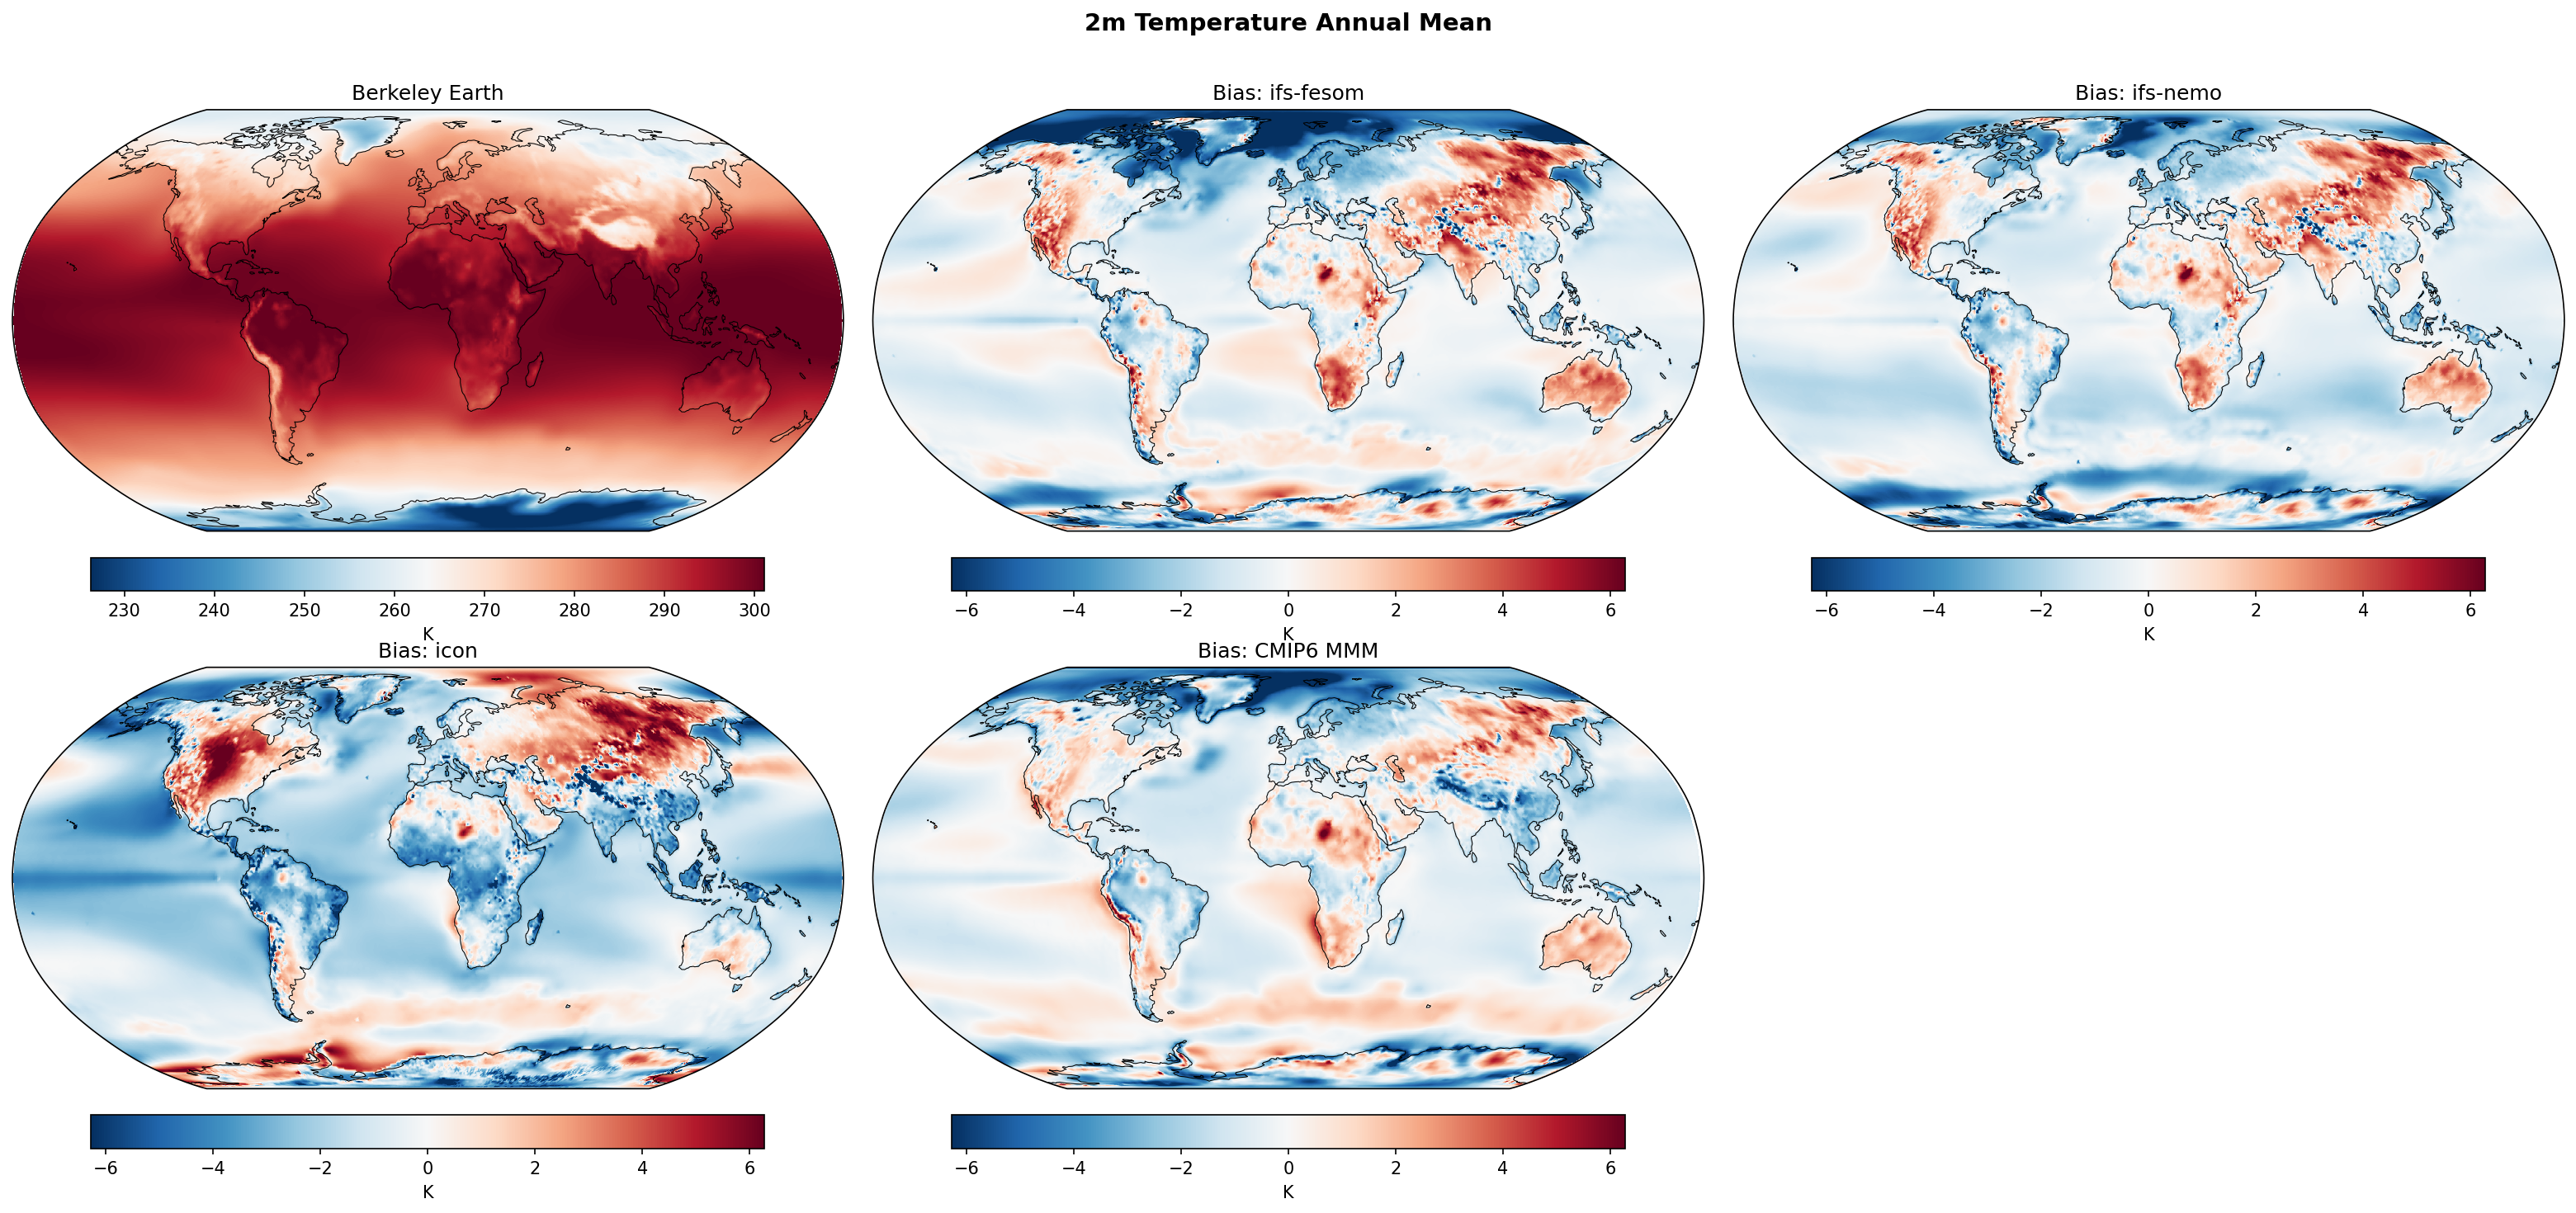
2m Temperature Annual Mean Bias
| Variables | tas |
|---|---|
| Models | ifs-fesom, ifs-nemo, icon, CMIP6 MMM |
| Reference Dataset | Berkeley Earth |
| Units | K |
| Period | 1990–2014 |
| ifs-fesom | Pattern Correlation: 0.99 · Std Ratio: 1.03 · Rmse: 1.86 · Global Mean Bias: -0.44 · Arctic Bias: -3.04 · Tropical Bias: -0.15 · Antarctic Bias: -1.03 |
| ifs-nemo | Pattern Correlation: 0.99 · Std Ratio: 1.02 · Rmse: 1.74 · Global Mean Bias: -0.68 · Arctic Bias: -1.48 · Tropical Bias: -0.52 · Antarctic Bias: -2.05 |
| icon | Pattern Correlation: 0.99 · Std Ratio: 0.96 · Rmse: 2.46 · Global Mean Bias: -1.28 · Arctic Bias: -0.47 · Tropical Bias: -2.13 · Antarctic Bias: -0.58 |
Summary high
This figure evaluates annual mean 2m temperature biases relative to Berkeley Earth climatology for three high-resolution models (ifs-fesom, ifs-nemo, icon) and the CMIP6 multi-model mean.
Key Findings
- ifs-nemo achieves the best overall spatial fidelity with the lowest RMSE (1.74 K) and highest pattern correlation (0.994), despite a moderate global cold bias.
- icon exhibits a pervasive systematic cold bias across global oceans (tropical bias -2.13 K), contrasting sharply with strong warm biases over Northern Hemisphere continents, resulting in the highest RMSE (2.46 K).
- All models, including the high-resolution runs, retain a distinct cold bias in the North Atlantic subpolar gyre, suggesting that resolution alone does not resolve this persistent systematic error often linked to AMOC representation.
- ifs-fesom shows the smallest global mean bias (-0.44 K) and minimal tropical bias (-0.15 K), but suffers from strong regional cold biases in the Arctic (-3.04 K).
Spatial Patterns
A clear land-sea contrast exists, particularly in ICON, with cold biases over oceans and warm biases over NH land (Siberia, North America). The 'North Atlantic warming hole' region shows a persistent cold bias in all models. While CMIP6 shows broad warm biases in Eastern Boundary Upwelling Systems (e.g., off Peru/Namibia), the high-resolution IFS models spatially constrain these biases, though do not eliminate them. Orographic biases are visible over the Andes and Himalayas.
Model Agreement
ifs-fesom and ifs-nemo show high structural agreement in bias patterns, differing mainly in amplitude (ifs-nemo is generally cooler). All models agree on warm biases over NH boreal land and cold biases in the North Atlantic. ICON acts as an outlier with its severe global/tropical ocean cold bias.
Physical Interpretation
The widespread warm bias over Northern Hemisphere continents likely points to deficiencies in land-atmosphere coupling, snow-albedo feedbacks, or stable boundary layer parameterizations. The global cold bias in ICON suggests a fundamental top-of-atmosphere radiative tuning issue or excessive cloud cooling. The persistence of the North Atlantic cold bias indicates that eddy-permitting resolution (~5km) is insufficient to correct subpolar gyre circulation errors without concomitant improvements in physics or coupling. High resolution improves the representation of coastal upwelling dynamics, narrowing the classic CMIP6 warm biases in these regions.
Caveats
- ICON's seemingly low Arctic bias (-0.47 K) is misleading, resulting from the compensation of severe warm biases over land and cold biases over the ocean.
- Biases over steep topography (Andes/Himalayas) may partially stem from elevation mismatches between the model grid and the interpolated observational baseline.
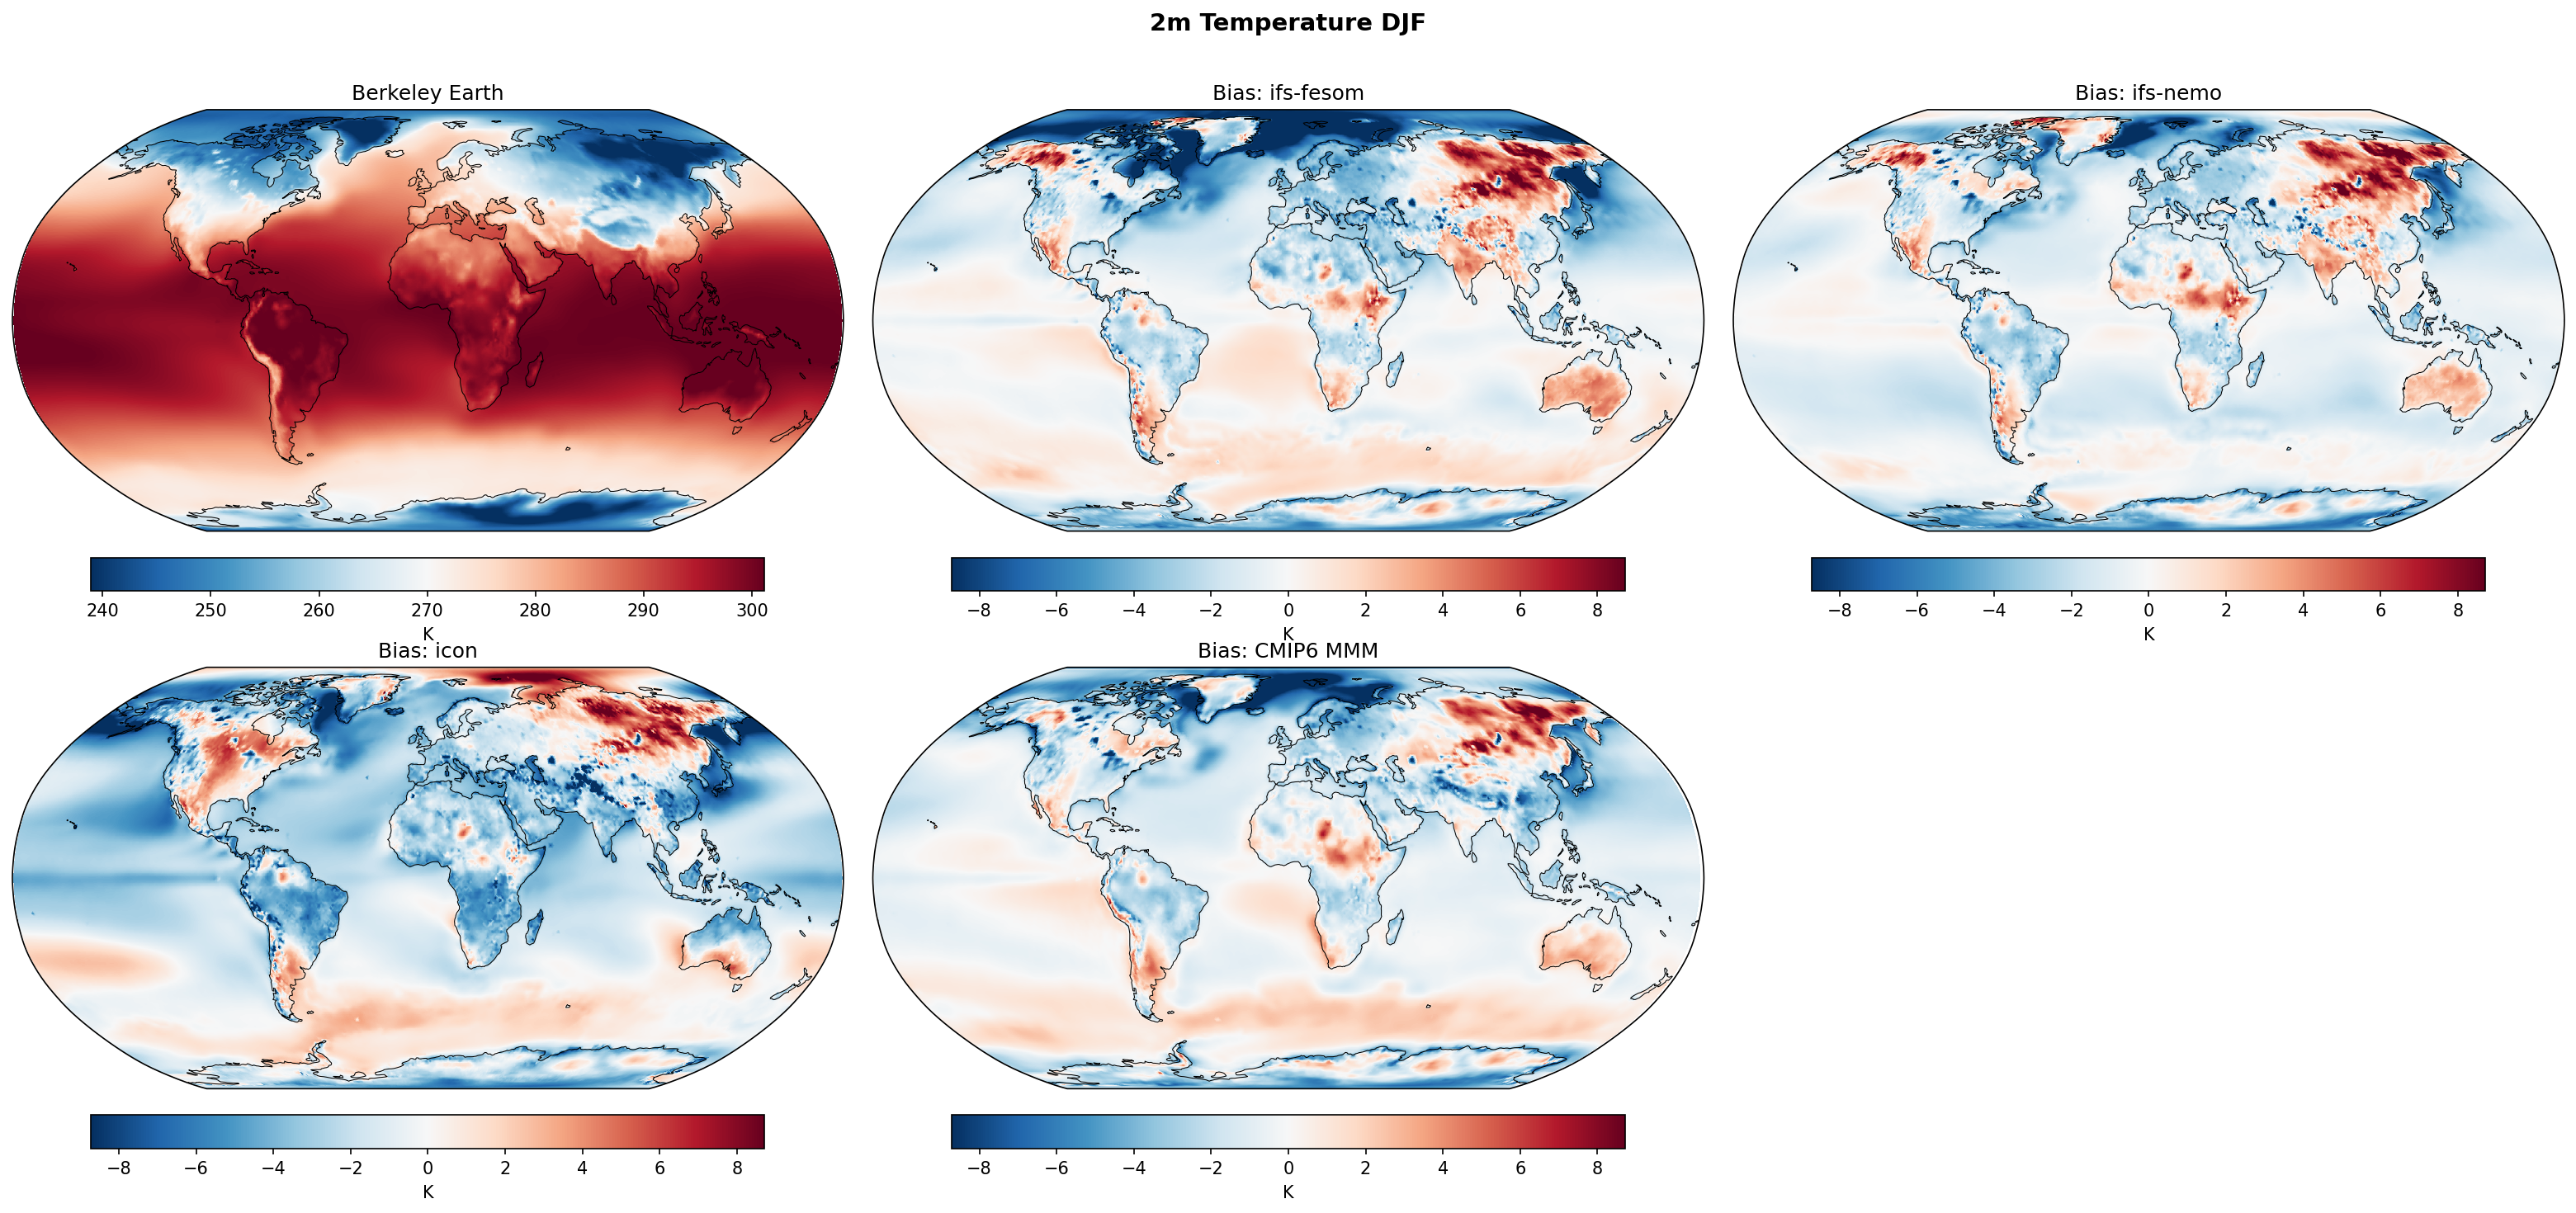
2m Temperature DJF Bias
| Variables | tas |
|---|---|
| Models | ifs-fesom, ifs-nemo, icon, CMIP6 MMM |
| Reference Dataset | Berkeley Earth |
| Units | K |
| Period | 1990–2014 |
Summary high
DJF 2m temperature bias maps showing pronounced high-latitude winter warm biases over Eurasia across all models, and distinct oceanic cold biases in ICON compared to the IFS variants.
Key Findings
- All models exhibit strong warm biases (>4 K) over Northern Eurasia and the Arctic during boreal winter, likely indicating issues with stable boundary layer parameterisation or snow-albedo feedbacks.
- ICON displays a systematic, widespread cold bias over global oceans (approx. -2 to -4 K) in contrast to the more regionally varied biases of IFS-FESOM and IFS-NEMO.
- High-resolution IFS models show a warm bias in the North Atlantic, reversing the 'cold blob' bias evident in the CMIP6 Multi-Model Mean.
- IFS-FESOM and IFS-NEMO show high agreement over land, confirming the dominance of the shared atmospheric component (OpenIFS) in driving continental biases.
Spatial Patterns
The most dominant pattern is the land-sea contrast in biases, particularly in the Northern Hemisphere winter. Eurasia and the Arctic are anomalously warm (positive bias). Conversely, the tropical and subtropical oceans tend towards cold biases, which are extreme in ICON but mild in IFS. The North American continent shows a dipole: cold bias in the west/central regions and warm bias in the northeast/Arctic. Topographic features like the Andes and Himalayas show distinct localized biases.
Model Agreement
IFS-FESOM and IFS-NEMO are nearly identical over land, reflecting their shared atmospheric physics. They diverge slightly over the oceans, though both are warmer than ICON. All models (including CMIP6) agree on the sign of the warm bias over Siberia. ICON is an outlier with its significantly colder global ocean state.
Physical Interpretation
The pervasive warm bias over boreal winter land (Siberia/Arctic) suggests models fail to reproduce the intensity of surface cooling in stable boundary layers or have excessive downward longwave radiation (cloud biases). The cold oceanic bias in ICON suggests a strong surface energy imbalance or drift in the coupled state. The reversal of the North Atlantic bias in IFS models compared to CMIP6 likely results from resolving western boundary currents (Gulf Stream) and their heat transport, which low-resolution models typically underestimate.
Caveats
- Analysis is restricted to the DJF season; biases may differ in JJA.
- Sparse observational coverage in the Arctic/Antarctic may affect bias reliability in polar regions.
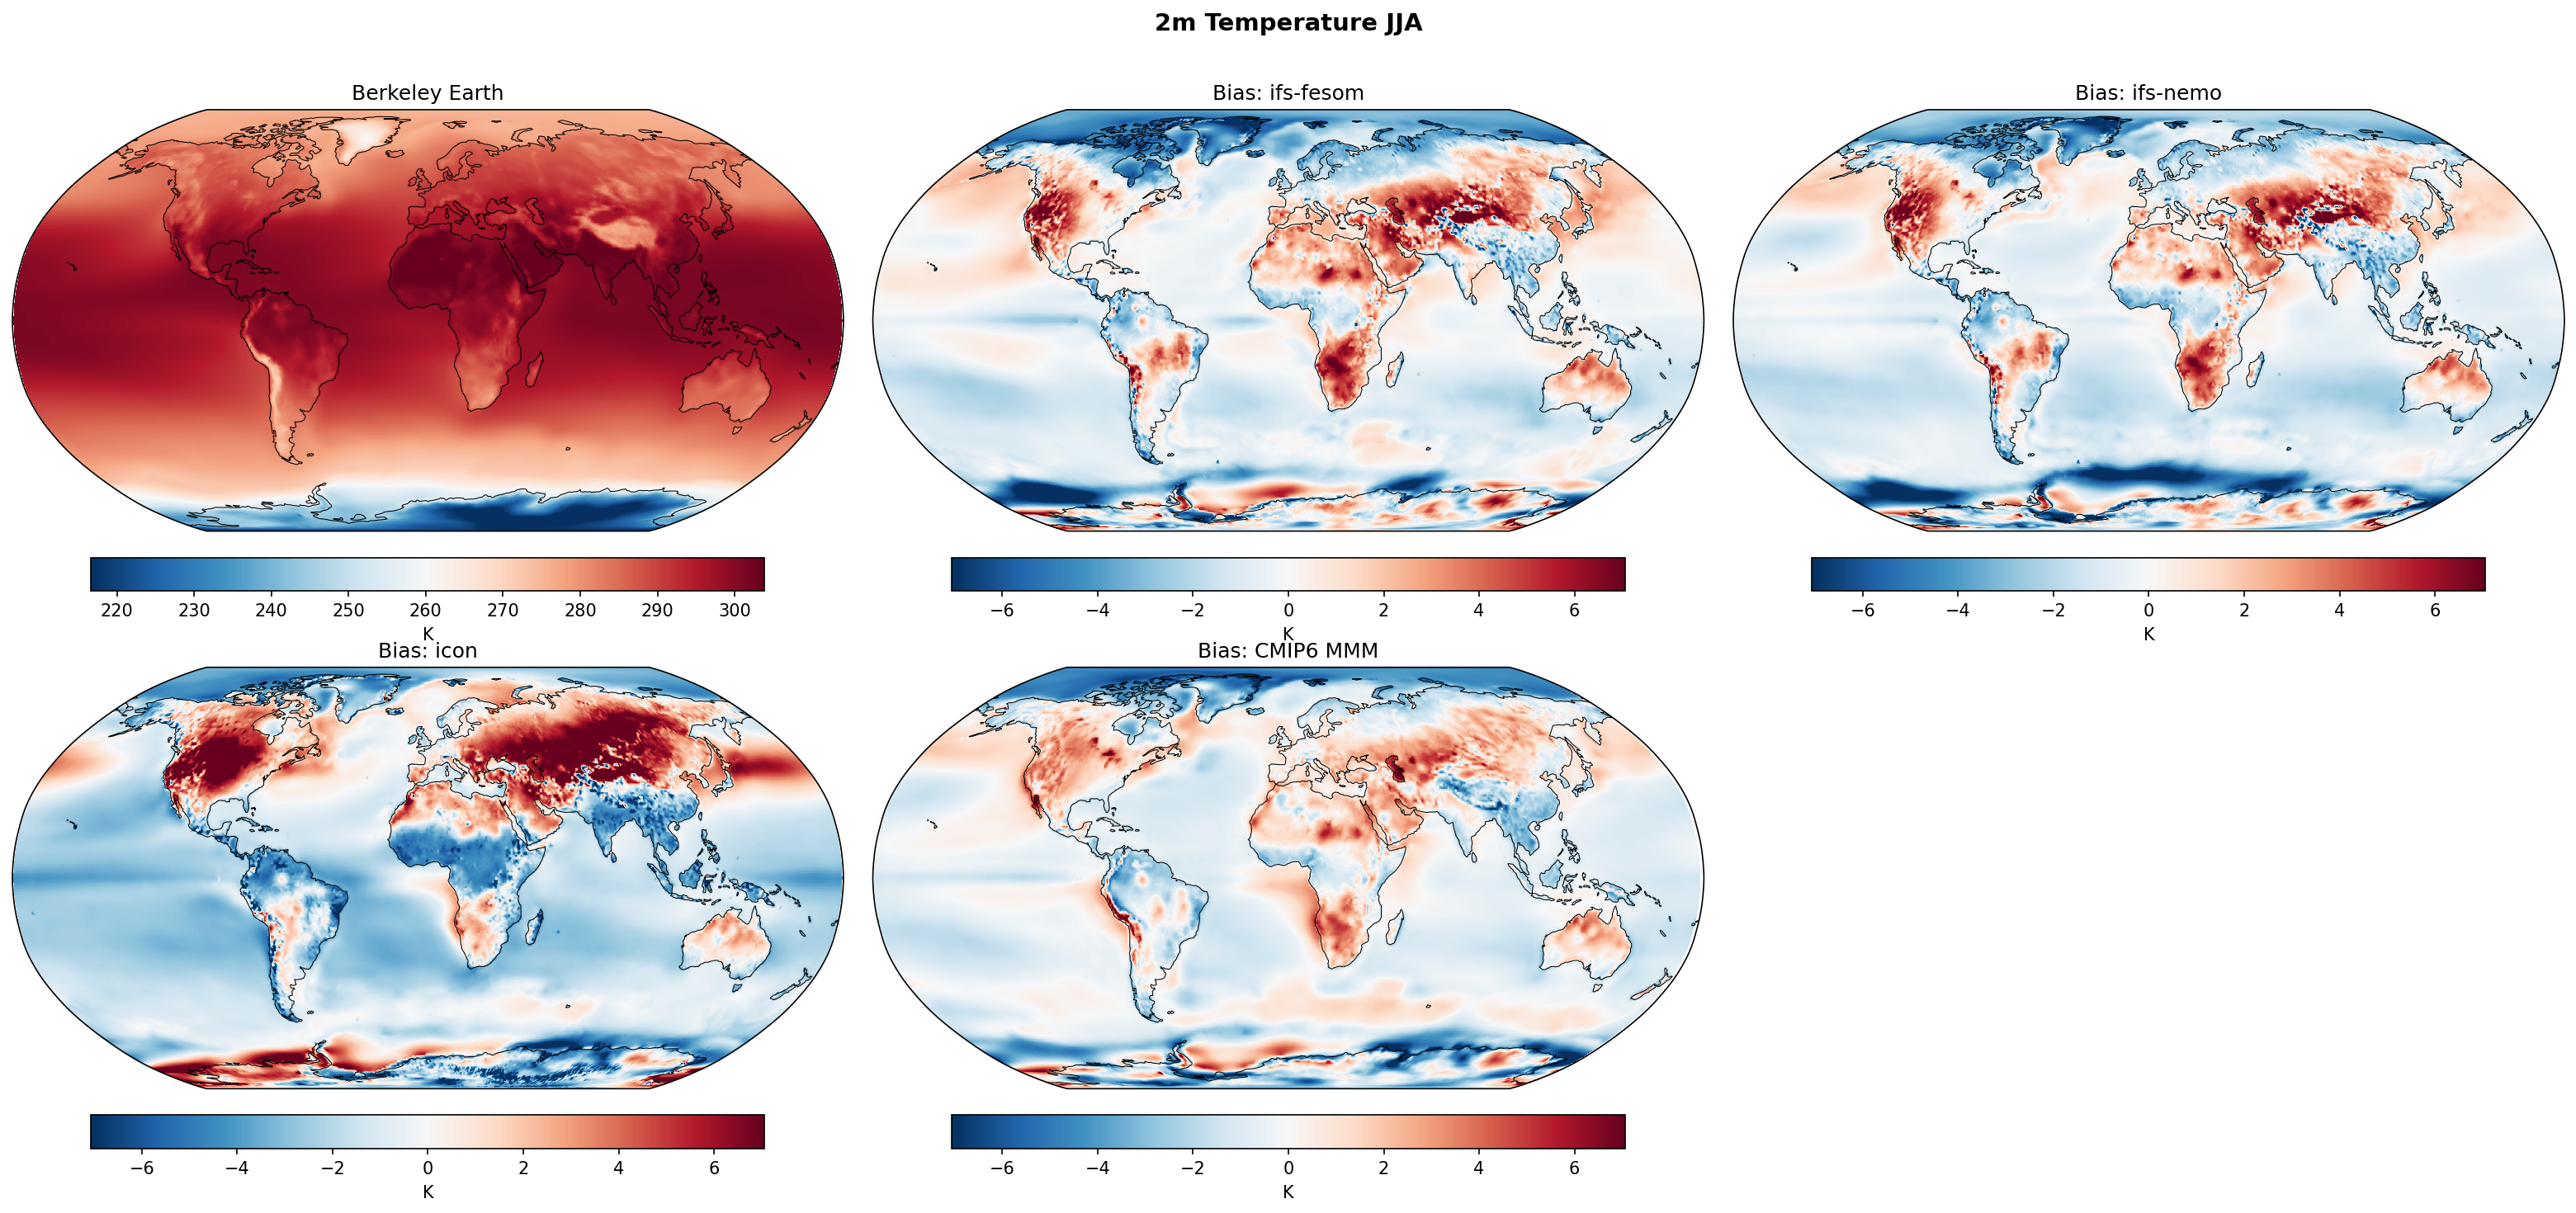
2m Temperature JJA Bias
| Variables | tas |
|---|---|
| Models | ifs-fesom, ifs-nemo, icon, CMIP6 MMM |
| Reference Dataset | Berkeley Earth |
| Units | K |
| Period | 1990–2014 |
Summary high
This figure displays JJA 2m temperature biases relative to Berkeley Earth, revealing systematic Northern Hemisphere continental warm biases in all models, which are moderate in the IFS variants but extreme (>6 K) in ICON.
Key Findings
- ICON exhibits severe widespread warm biases (>6 K) over Northern Hemisphere land masses (North America, Eurasia) during summer, significantly exceeding biases seen in IFS or CMIP6.
- IFS-FESOM and IFS-NEMO show nearly identical bias patterns, characterized by moderate warm biases in the Central US and Europe, and distinct cold biases over the Sahara/Sahel and Himalayas.
- A clear contrast exists in the Southern Ocean: high-resolution models (IFS, ICON) show a cold bias, whereas the CMIP6 multi-model mean displays a classic warm bias.
- All high-resolution models exhibit a persistent cold bias in the North Atlantic 'warming hole' region, which is more pronounced than in the CMIP6 mean.
Spatial Patterns
In JJA, Northern Hemisphere mid-latitude land areas generally exhibit warm biases, most intense in the Central US and Central Asia. In contrast, the Sahara and Sahel regions show cold biases in the high-resolution models. Ocean basins in the high-res models are predominantly characterized by cool biases, particularly in the Southern Ocean and North Atlantic, whereas CMIP6 shows warm biases in Eastern Boundary Upwelling Systems and the Southern Ocean.
Model Agreement
IFS-FESOM and IFS-NEMO are remarkably similar, suggesting the atmospheric component (IFS) drives the dominant surface temperature biases over land. ICON diverges significantly with much stronger continental heating and distinct cold biases in tropical South America and Africa where IFS is warm.
Physical Interpretation
The severe summer land warming in ICON suggests issues with land-surface coupling (e.g., soil moisture depletion) or insufficient cloud cover allowing excessive shortwave radiation. The shift from Southern Ocean warm bias (CMIP6) to cold bias (DestinE models) likely reflects improved resolution of ocean eddies or changes in cloud phase partitioning in the newer physics schemes. The North Atlantic cold bias suggests common difficulties in representing the North Atlantic Current path or AMOC strength in high-resolution coupled configurations.
Caveats
- The analysis is limited to JJA (boreal summer/austral winter); winter biases may differ significantly.
- The extreme magnitude of ICON's bias suggests a potential configuration or tuning issue specific to land-atmosphere exchange.
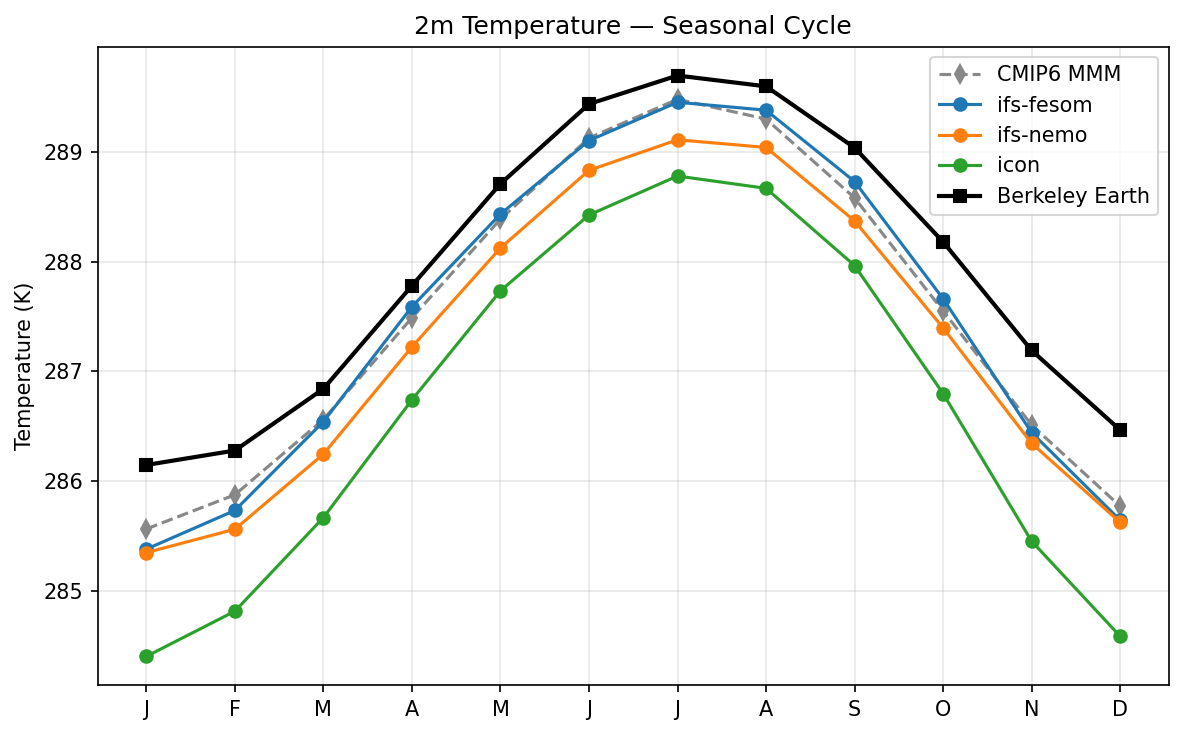
2m Temperature Seasonal Cycle
| Variables | tas |
|---|---|
| Models | ifs-fesom, ifs-nemo, icon |
| Reference Dataset | Berkeley Earth |
| Units | K |
| Period | 1990–2014 |
Summary high
The figure illustrates the global mean 2m temperature seasonal cycle, revealing that all three high-resolution models exhibit a systematic cold bias relative to Berkeley Earth observations, with ICON showing the most severe deviation.
Key Findings
- All evaluated models (ifs-fesom, ifs-nemo, icon) underestimate global mean temperature throughout the entire year compared to Berkeley Earth.
- ICON displays a substantial systematic cold bias of approximately 1.5–2.0 K relative to observations, effectively shifting the entire climatology downwards.
- ifs-fesom performs best among the high-resolution models, closely tracking the CMIP6 Multi-Model Mean (MMM) but remaining ~0.3–0.8 K cooler than Berkeley Earth, particularly in boreal winter.
- While the phase of the seasonal cycle is correctly captured (peaking in July), the models exhibit a slightly larger seasonal amplitude than observations, indicated by larger cold biases in DJF compared to JJA.
Spatial Patterns
The seasonal cycle follows the expected Northern Hemisphere dominance, with a global maximum in July and minimum in January. The model biases are persistent year-round but slightly modulate in magnitude, being generally larger in boreal winter (DJF) than in boreal summer (JJA).
Model Agreement
ifs-fesom and the CMIP6 MMM show strong agreement, suggesting the high-resolution IFS configuration behaves similarly to the standard-resolution ensemble. ifs-nemo introduces a moderate additional cold bias (~0.5 K), while ICON is a distinct outlier with a severe cold bias compared to both the IFS models and the CMIP6 baseline.
Physical Interpretation
The pervasive cold bias, particularly in ICON, suggests a fundamental imbalance in the global energy budget, likely due to excessive planetary albedo (too much cloud reflection or sea ice/snow cover) or insufficient ocean heat retention. The amplification of the cold bias in boreal winter implies potential issues with snow-albedo feedback or wintertime boundary layer processes in the Northern Hemisphere landmasses.
Caveats
- Global means mask regional biases; the cold bias could be concentrated in specific regions (e.g., polar amplification of errors).
- Differences in the definition of 2m temperature between model parameterizations and observational interpolation (Berkeley Earth) may contribute to minor offsets, though not to the extent seen in ICON.
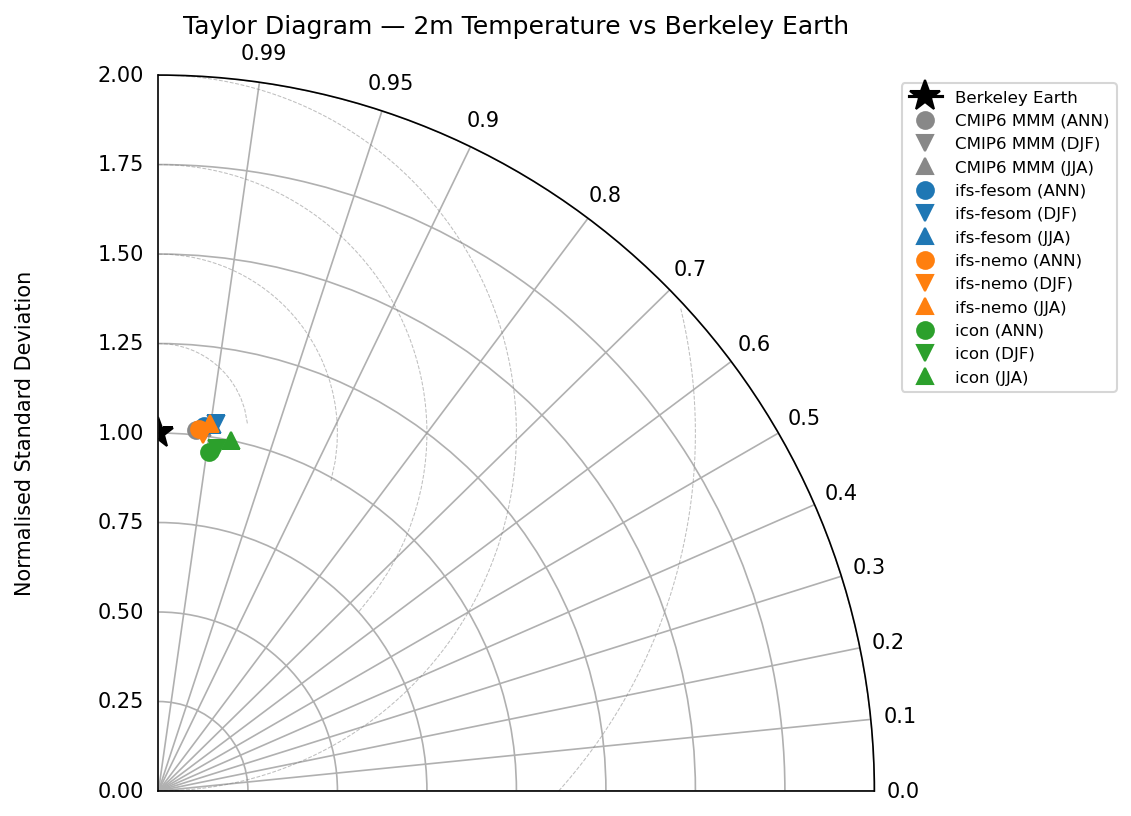
Taylor Diagram — 2m Temperature
| Variables | tas |
|---|---|
| Models | ifs-fesom, ifs-nemo, icon, CMIP6 MMM |
| Reference Dataset | Berkeley Earth |
| Units | K |
| Period | 1990–2014 |
| ifs-fesom_ANN | Corr: 0.99 · Std Ratio: 1.03 |
| ifs-fesom_DJF | Corr: 0.99 · Std Ratio: 1.04 |
| ifs-fesom_JJA | Corr: 0.99 · Std Ratio: 1.04 |
| ifs-nemo_ANN | Corr: 0.99 · Std Ratio: 1.02 |
| ifs-nemo_DJF | Corr: 0.99 · Std Ratio: 1.00 |
| ifs-nemo_JJA | Corr: 0.99 · Std Ratio: 1.04 |
| icon_ANN | Corr: 0.99 · Std Ratio: 0.96 |
| icon_DJF | Corr: 0.99 · Std Ratio: 0.97 |
| icon_JJA | Corr: 0.98 · Std Ratio: 1.00 |
Summary high
This Taylor diagram evaluates the spatial fidelity of 2m temperature climatologies against Berkeley Earth observations, demonstrating high skill across all models with pattern correlations exceeding 0.98.
Key Findings
- All evaluated models (ifs-fesom, ifs-nemo, icon) capture global temperature patterns with very high accuracy, clustering closely around the observational reference.
- IFS-NEMO and IFS-FESOM tend to slightly overestimate spatial variability (normalized standard deviation > 1.0), whereas ICON tends to underestimate it (standard deviation < 1.0, particularly in Annual and DJF means).
- IFS-NEMO generally outperforms the other high-resolution models, exhibiting the highest correlations (>0.99 for ANN/DJF) and standard deviation ratios closest to unity.
- ICON shows the weakest performance in terms of pattern correlation in JJA (0.979) and underestimates variability significantly in the annual mean (~0.96).
Spatial Patterns
While the diagram condenses spatial information, the high correlations (>0.98) indicate that all models correctly reproduce the dominant meridional temperature gradients and land-sea contrasts. The systematic differences in standard deviation suggest that IFS variants may have slightly stronger pole-to-equator gradients or sharper regional contrasts than ICON.
Model Agreement
There is strong inter-model agreement on the overall pattern. However, a clear divergence exists in amplitude scaling: IFS-FESOM and IFS-NEMO cluster together with 'excess' variance (ratios ~1.02–1.04), while ICON sits apart with 'damped' variance. The CMIP6 MMM (grey) generally sits closer to the perfect reference (1,1) than the individual high-res models, benefiting from ensemble averaging.
Physical Interpretation
The high correlations are expected as global temperature is primarily driven by solar geometry and the resulting meridional gradient, which is robust in all dynamical cores. The variance underestimation in ICON could stem from muted polar amplification or dampened land-sea thermal contrasts compared to the IFS models. Conversely, the slight over-variance in IFS models might reflect colder cold-extremes or warmer warm-extremes relative to the Berkeley Earth climatology.
Caveats
- Taylor diagrams do not reveal regional bias compensation (e.g., a warm bias in the tropics cancelling a cold bias at poles in the global mean, though it would affect correlation).
- Performance is evaluated against Berkeley Earth; uncertainties in the observational dataset in data-sparse regions (e.g., Southern Ocean) are not depicted.
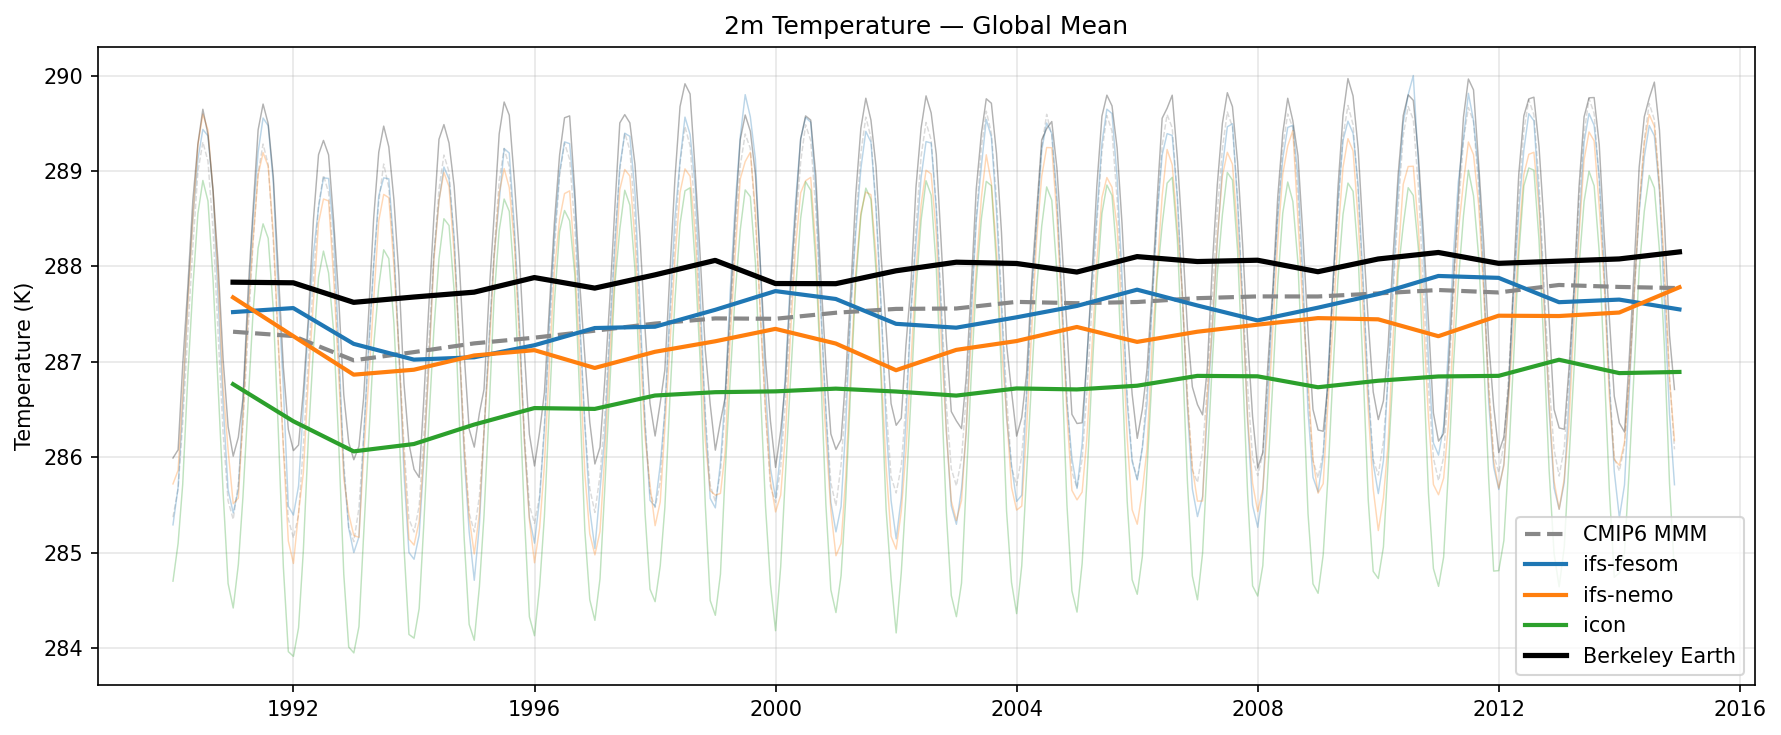
2m Temperature Global Mean Time Series
| Variables | tas |
|---|---|
| Models | ifs-fesom, ifs-nemo, icon |
| Reference Dataset | Berkeley Earth |
| Units | K |
| Period | 1990–2014 |
Summary high
This time series analysis of global mean 2m temperature (1990–2014) reveals a systematic cold bias in all three high-resolution models compared to Berkeley Earth observations, with ICON exhibiting the largest deviation.
Key Findings
- All three DestinE models (ifs-fesom, ifs-nemo, icon) exhibit a persistent global mean cold bias relative to Berkeley Earth observations throughout the simulation period.
- ifs-fesom is the warmest of the three, tracking closely with the CMIP6 Multi-Model Mean (though still ~0.5 K colder than Berkeley Earth), while ifs-nemo is roughly 0.5 K colder than ifs-fesom.
- ICON displays a severe cold bias of approximately 1.5 K relative to observations and has a notably larger seasonal amplitude, driven by much deeper seasonal minima.
- The CMIP6 Multi-Model Mean sits between the observations and the DestinE models, indicating that the high-resolution configurations tested here are cooler than the standard resolution CMIP6 ensemble average.
Spatial Patterns
The figure aggregates spatial data into a global mean. Temporally, the seasonal cycle (thin lines) dominates the variability. ICON's seasonal cycle is amplified, specifically reaching much lower minima (likely NH winter), contributing to its overall lower annual mean.
Model Agreement
There is significant disagreement in the mean state: ifs-fesom is closest to the CMIP6 baseline, ifs-nemo is intermediate, and ICON is a cold outlier. The inter-model spread is roughly 1 K.
Physical Interpretation
The pervasive cold bias suggests a global energy imbalance, likely due to excessive planetary albedo (too much cloud reflection or extensive sea ice/snow cover). The discrepancy between ifs-fesom and ifs-nemo (which share the IFS atmospheric component) highlights the role of the ocean model and sea-ice coupling in regulating global surface temperature; FESOM appears to maintain a warmer surface state than NEMO in this configuration. ICON's deep seasonal troughs suggest strong cooling over land or excessive sea ice growth in the winter hemisphere.
Caveats
- Global mean values mask regional compensating errors (e.g., warm tropics vs. cold poles).
- These are likely free-running coupled simulations, so interannual variability (e.g., El Niño timing) is not expected to match observations year-for-year.
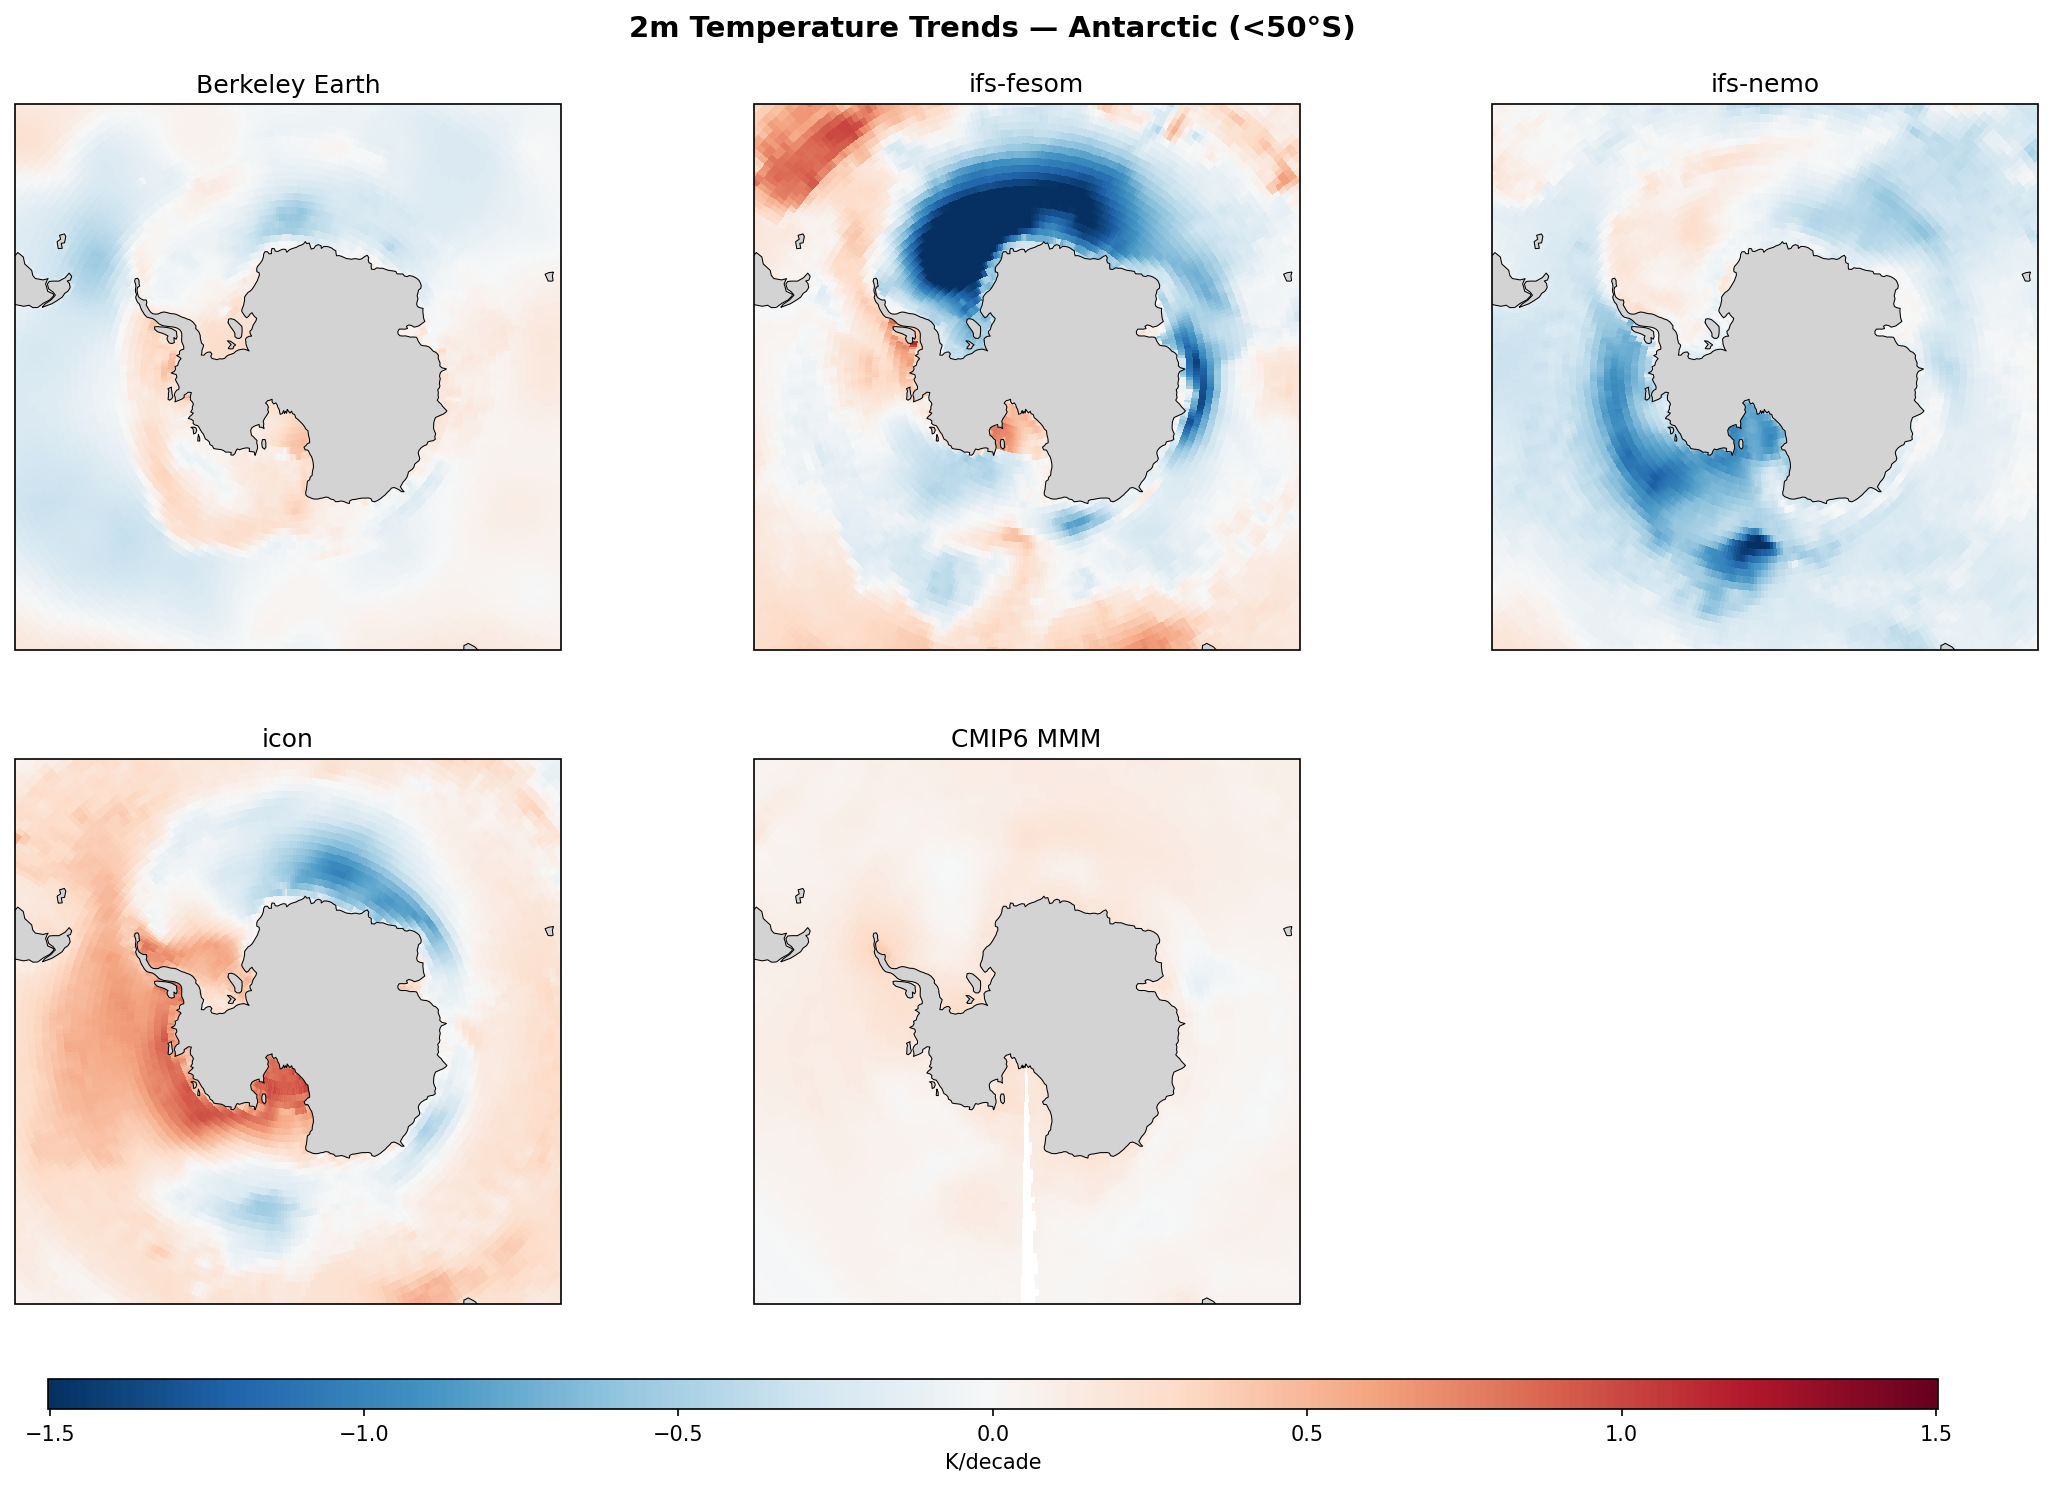
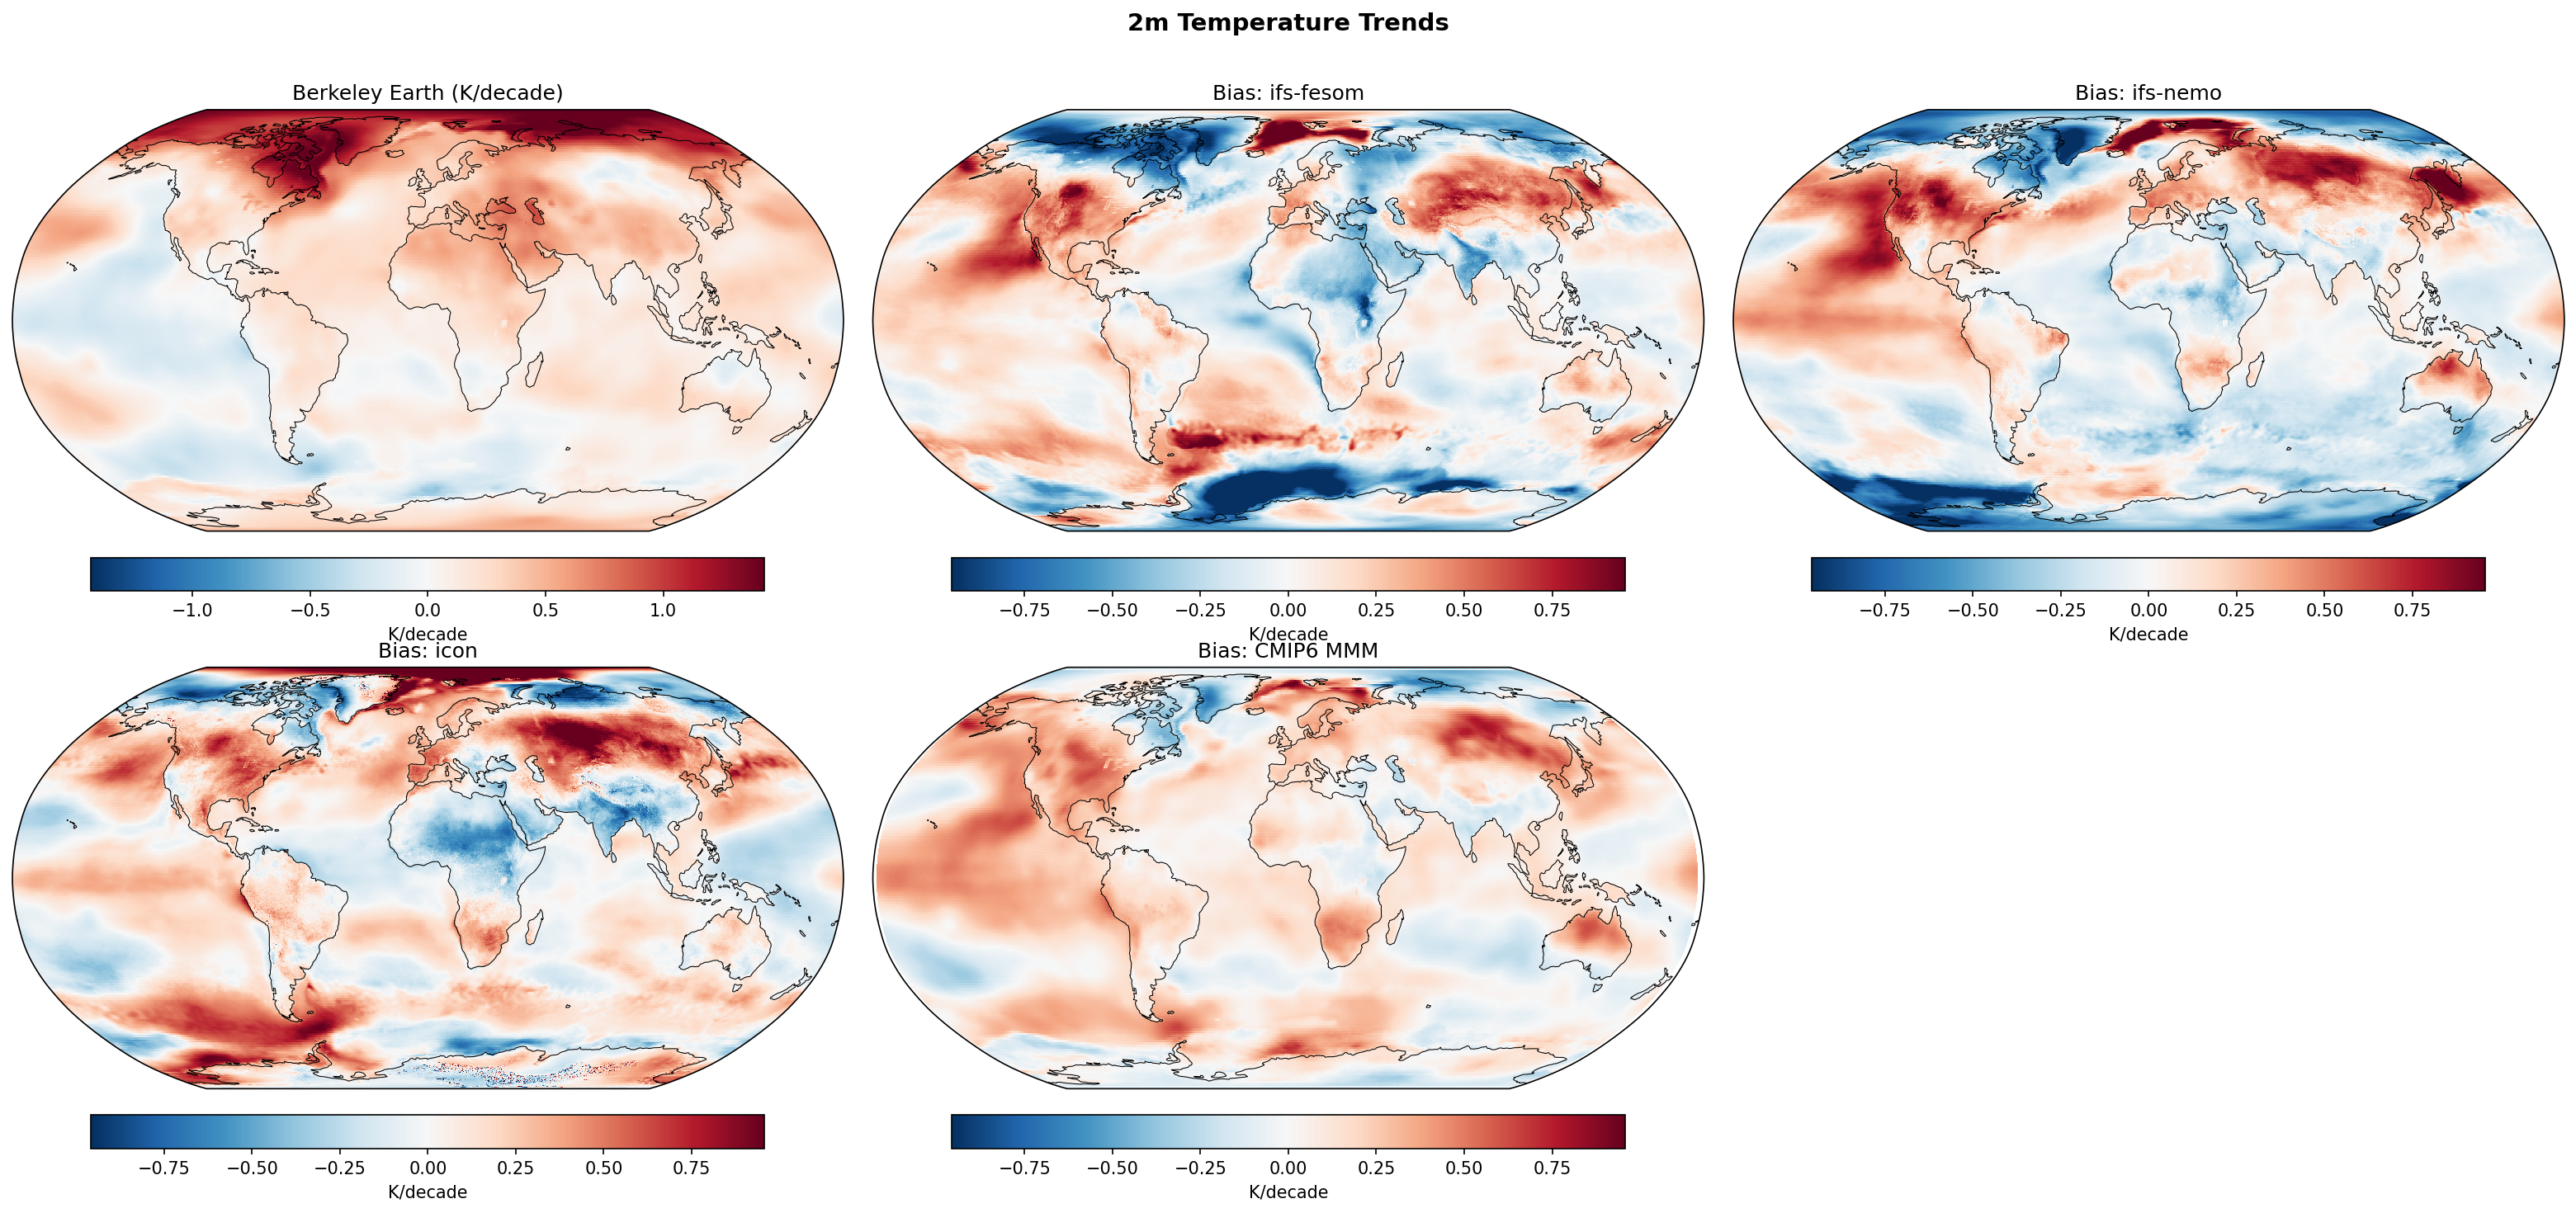
2m Temperature Trends (Antarctic (<50°S))
| Variables | tas |
|---|---|
| Models | ifs-fesom, ifs-nemo, icon, CMIP6 MMM |
| Reference Dataset | Berkeley Earth |
| Units | K |
| Period | 1990–2014 |
| Method | Linear OLS regression per grid point, x10 for K/decade |
Summary high
This figure compares 1990–2014 linear trends in 2m temperature over the Antarctic (<50°S) from three high-resolution DestinE models against Berkeley Earth observations and the CMIP6 multi-model mean. The high-resolution models exhibit strong, regionally disparate trends with magnitudes far exceeding observations, likely indicating significant internal variability or model drift rather than a forced climate response.
Key Findings
- High-resolution models show trend magnitudes (>1.5 K/decade) significantly larger than Berkeley Earth observations (mostly <0.5 K/decade).
- ifs-fesom and ifs-nemo display prominent cooling trends in the Southern Ocean (Weddell Sea and Ross/Amundsen Seas, respectively), contradicting the weak mixed signals in observations.
- icon presents a contrasting pattern with intense warming in the Amundsen/Bellingshausen Sea region and cooling in the Weddell sector.
- The CMIP6 MMM shows a smooth, weak background warming, highlighting that the strong regional features in the high-resolution runs are likely due to internal variability or initialization drift.
Spatial Patterns
Berkeley Earth shows weak warming near the Antarctic Peninsula and neutral/weak cooling elsewhere. ifs-fesom features a deep cooling bullseye in the Weddell Sea. ifs-nemo shows widespread cooling centered on the Ross and Amundsen Seas. icon shows a strong dipole with intense warming west of the Peninsula and cooling in the Weddell Sea.
Model Agreement
There is low agreement between models and observations, and low agreement among the models themselves regarding the spatial distribution of trends. While IFS variants lean towards cooling (likely sea-ice related), ICON shows strong regional warming.
Physical Interpretation
The extreme trends in the high-resolution models likely reflect 'spin-up' drift or pronounced internal decadal variability (e.g., related to the Southern Annular Mode or Amundsen Sea Low) rather than anthropogenic forcing. Specifically, the strong cooling in IFS models may result from open-ocean deep convection shutdown or rapid sea-ice expansion from initial conditions. The warming in ICON suggests enhanced warm air advection potentially driven by a deepening Amundsen Sea Low.
Caveats
- The 25-year period is short, making linear trends highly susceptible to decadal variability and start/end dates.
- Large trends in coupled models often indicate adjustment (drift) from initial ocean states rather than physical climate evolution.
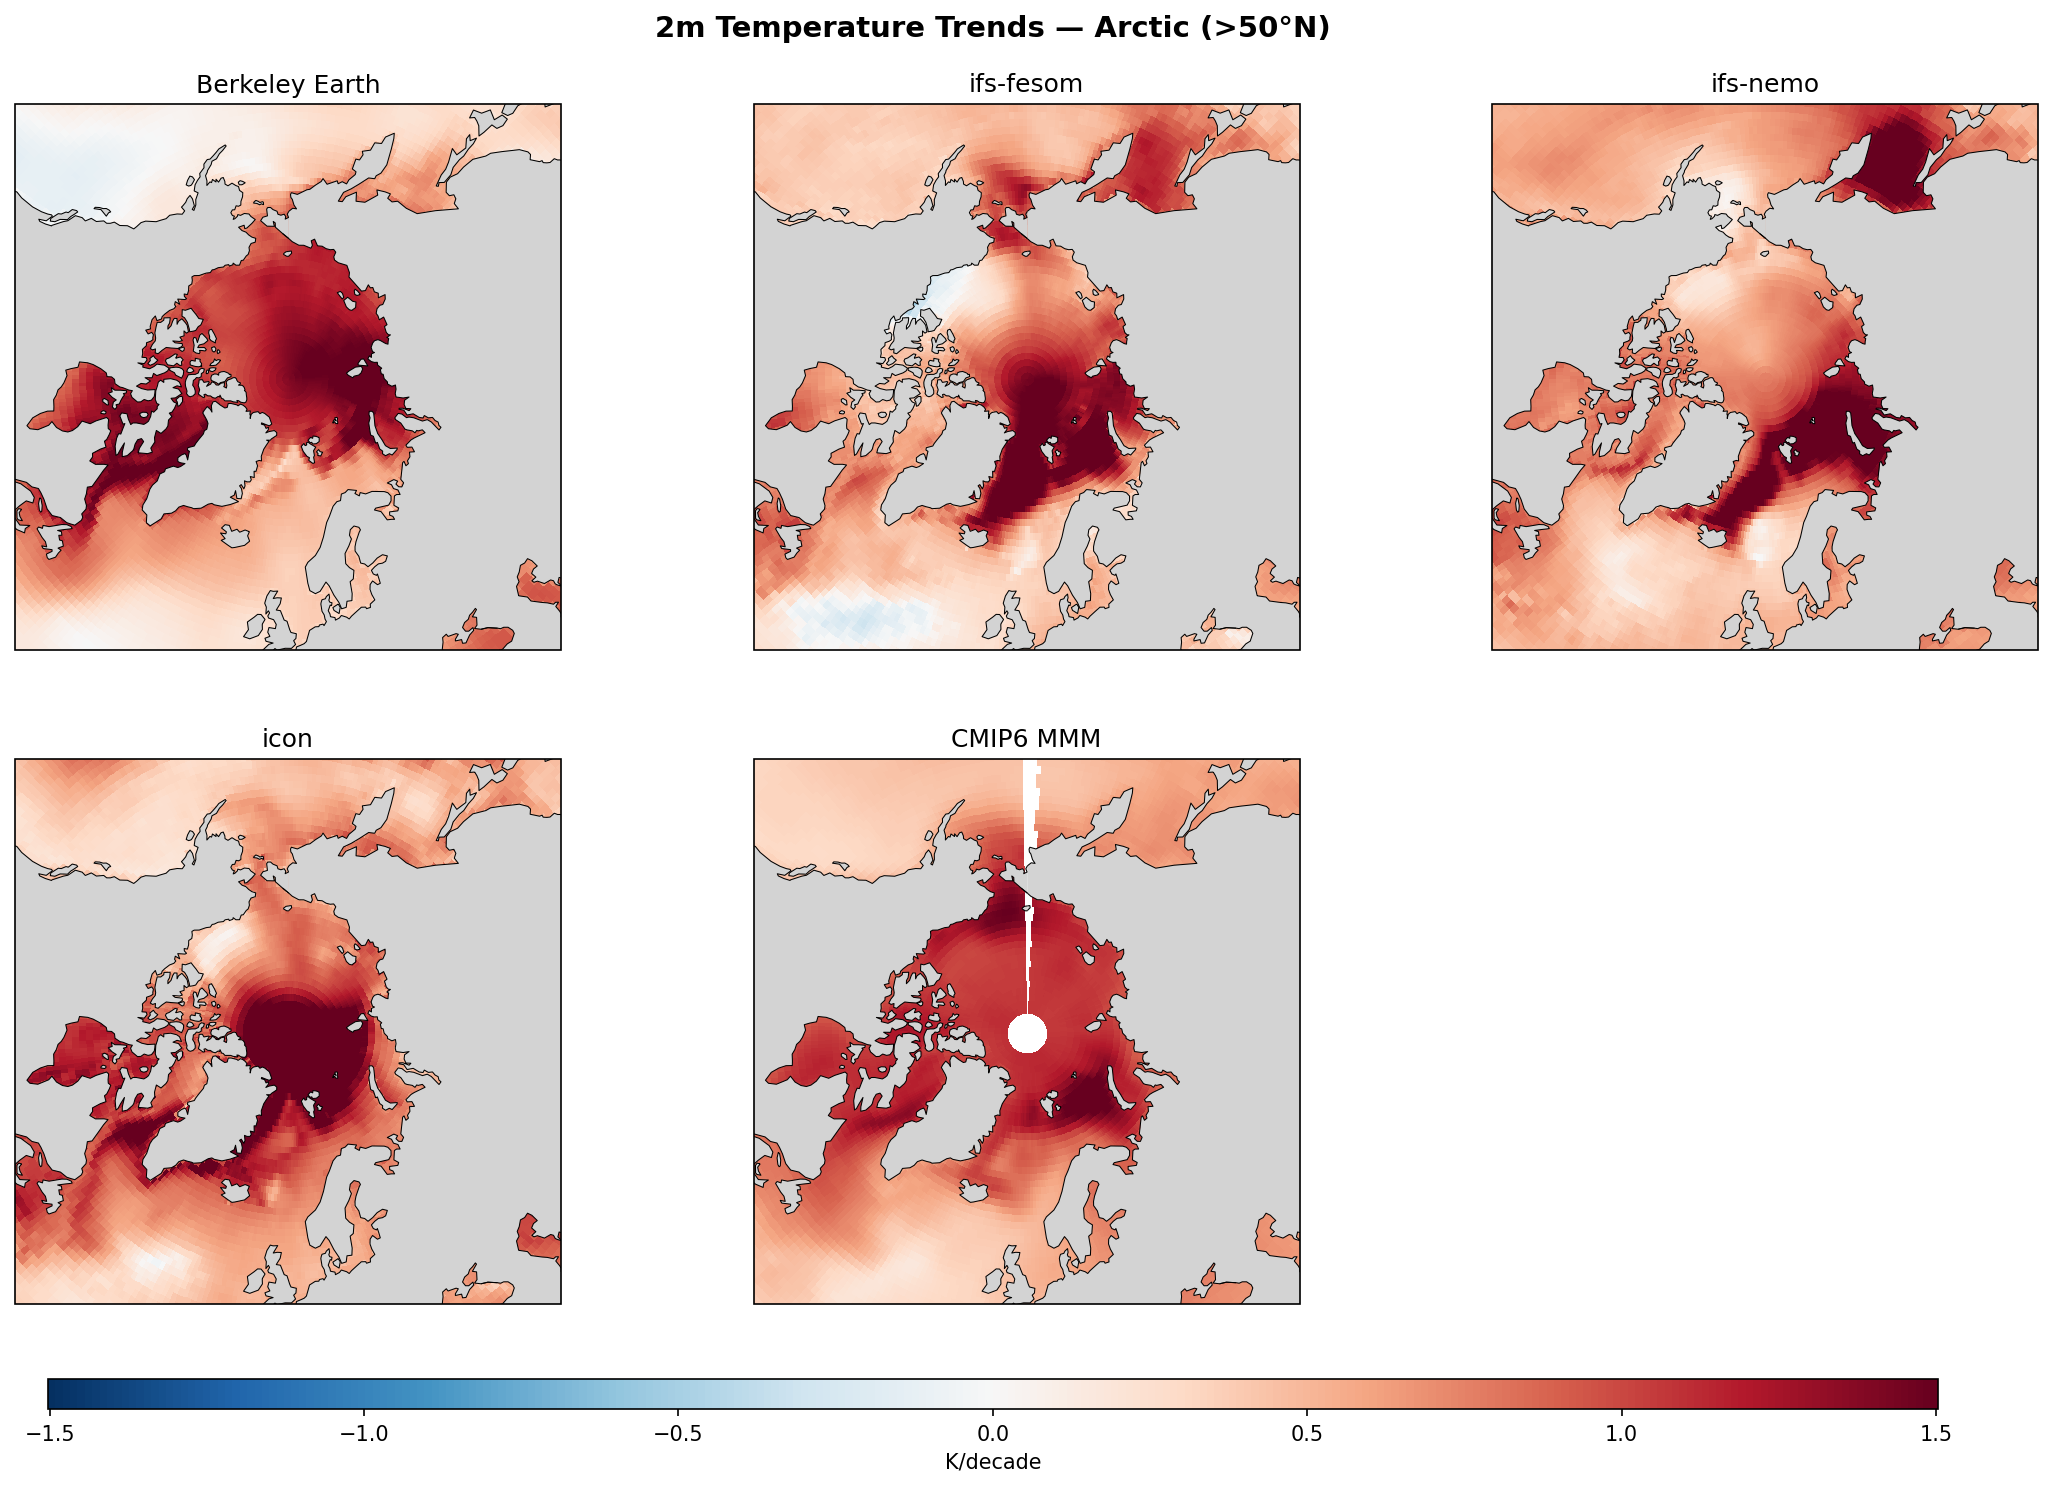
2m Temperature Trends (Arctic (>50°N))
| Variables | tas |
|---|---|
| Models | ifs-fesom, ifs-nemo, icon, CMIP6 MMM |
| Reference Dataset | Berkeley Earth |
| Units | K |
| Period | 1990–2014 |
| Method | Linear OLS regression per grid point, x10 for K/decade |
Summary high
This figure displays linear trends in 2m temperature over the Arctic (>50°N) for the period 1990–2014, comparing high-resolution models (ifs-fesom, ifs-nemo, icon) against Berkeley Earth observations and the CMIP6 multi-model mean. All datasets consistently show strong Arctic Amplification, with warming rates exceeding 1.5 K/decade in the central Arctic Ocean, though regional patterns, particularly in the North Atlantic, vary among models.
Key Findings
- Arctic Amplification is robustly captured by all models, with warming trends over the Arctic Ocean significantly outpacing mid-latitude regions, consistent with observations.
- The Barents-Kara Sea region appears as a primary warming hotspot (>1.5 K/decade) in Berkeley Earth, a feature well-reproduced by ifs-nemo and icon, and to a slightly lesser extent by the CMIP6 MMM.
- ifs-fesom exhibits a distinct cooling trend (negative values) in the North Atlantic subpolar gyre region, a feature that is much weaker or absent in the other models and observations.
- Warming over Hudson Bay is notable in observations and is most clearly captured by icon and ifs-nemo, whereas ifs-fesom shows a weaker signal there.
Spatial Patterns
The dominant pattern is intense warming over the Arctic Ocean basin and adjacent land masses (Siberia, Northern Canada). Observations show a peak warming centered on the Barents-Kara sector and the central Arctic. ifs-fesom deviates with a cooling signal south of Greenland (the 'warming hole'). The CMIP6 MMM shows a smoothed version of the forced response, confirming that the localized extremes in the single-model runs (like the patchy continental warming) likely reflect internal variability.
Model Agreement
ifs-nemo and icon show the strongest agreement with Berkeley Earth regarding the spatial extent and magnitude of the high-latitude warming. ifs-fesom diverges in the North Atlantic sector. All models agree on the sign and approximate magnitude of the broad Arctic warming trend.
Physical Interpretation
The intense Arctic warming is primarily driven by the sea-ice albedo feedback, where retreating sea ice exposes darker ocean water, enhancing heat absorption and release to the atmosphere (especially in winter/autumn). The 'warming hole' cooling seen in ifs-fesom likely relates to dynamics of the Atlantic Meridional Overturning Circulation (AMOC) or a specific phase of internal variability (e.g., NAO) captured in that simulation.
Caveats
- The analysis period (1990–2014) is 25 years, meaning trends are heavily influenced by multi-decadal internal variability (e.g., IPO, AMO) and are not purely anthropogenic forcing.
- The cooling in ifs-fesom may represent a specific realization of internal variability rather than a systematic model bias.
2m Temperature Warming Trends
| Variables | tas |
|---|---|
| Models | ifs-fesom, ifs-nemo, icon, CMIP6 MMM |
| Reference Dataset | Berkeley Earth |
| Units | K |
| Period | 1990–2014 |
| Method | Linear OLS regression per grid point, x10 for K/decade |
Summary high
This figure evaluates linear trends in 2m temperature (1990–2014) for three high-resolution models and the CMIP6 multi-model mean against Berkeley Earth observations. While observations highlight strong Arctic amplification and cooling in the eastern Pacific, the models exhibit significant regional trend biases, particularly with IFS variants overestimating continental warming and diverging in their representation of Arctic and Pacific decadal variability.
Key Findings
- IFS-NEMO and IFS-FESOM exhibit a widespread positive trend bias (over-warming) over Northern Hemisphere land masses (North America, Eurasia) exceeding 0.5 K/decade relative to observations.
- Arctic amplification is inconsistently represented: IFS-NEMO shows excessive warming (strong positive bias), whereas ICON underestimates warming in the Atlantic-Arctic sector (negative bias).
- Representation of the 1990-2014 Pacific 'hiatus' cooling trend varies strongly: IFS variants and CMIP6 MMM show positive biases (failure to capture cooling), while ICON exhibits a strong negative trend bias (excessive cooling) in the tropical Pacific.
Spatial Patterns
Observations show pronounced Arctic warming (>1.0 K/decade) and slight cooling in the Eastern Tropical Pacific. IFS-NEMO displays the most intense positive bias in the Arctic. ICON stands out with strong negative trend biases in the Tropical Pacific and Barents Sea, contrasting with positive biases in the Southern Ocean (Amundsen/Bellingshausen sector). IFS-FESOM shows a strong negative trend bias in the Southern Ocean.
Model Agreement
Inter-model agreement is low regarding regional trend magnitudes. While IFS-FESOM and IFS-NEMO share similar continental over-warming patterns, they diverge from ICON in the Tropics and Arctic. The CMIP6 MMM presents a smoother bias pattern, generally overestimating warming but with lower amplitude errors than the individual high-resolution IFS runs.
Physical Interpretation
The divergence in Pacific trends likely reflects different phases of internal decadal variability (IPO/PDO) spontaneously generated by the models versus the observed historical realization (negative IPO phase). The strong Arctic bias differences suggest varying strengths of ice-albedo feedbacks, with IFS-NEMO likely melting sea ice too rapidly. The continental over-warming in IFS models may indicate excessive land-atmosphere coupling strength or deficiencies in cloud radiative cooling over land.
Caveats
- The 25-year period (1990–2014) is dominated by internal climate variability (e.g., IPO), so free-running coupled models are not expected to reproduce the specific phases of observed variability.
- Observational coverage and reliability in the Arctic and Southern Ocean are lower than in mid-latitudes.
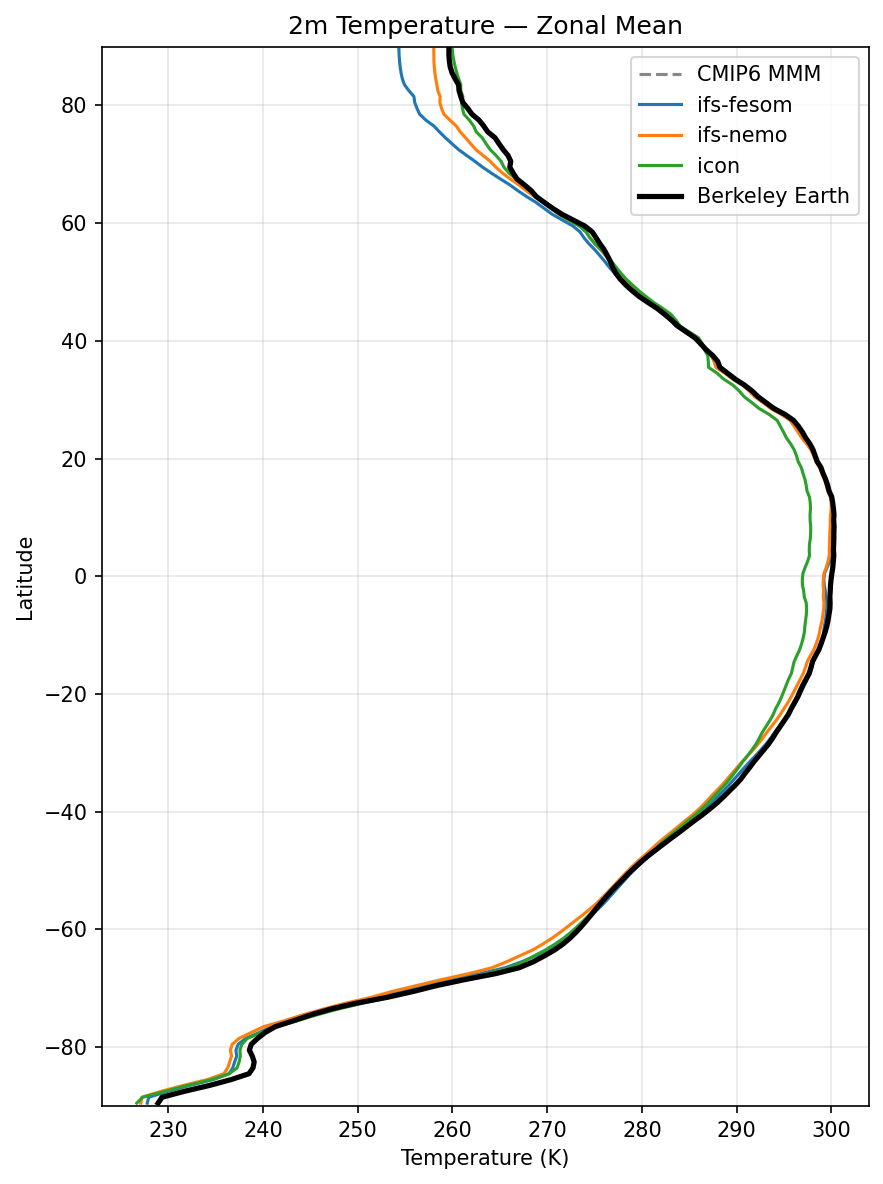
2m Temperature Zonal Mean Profile
| Variables | tas |
|---|---|
| Models | CMIP6 MMM, ifs-fesom, ifs-nemo, icon |
| Reference Dataset | Berkeley Earth |
| Units | K |
| Period | 1990–2014 |
Summary high
Zonal mean 2m temperature profiles show broad structural agreement with Berkeley Earth observations across all models, though distinct regional biases emerge, particularly in the Arctic and Tropics.
Key Findings
- Arctic (>60°N): IFS-FESOM exhibits a severe cold bias, deviating significantly (up to ~5-10 K visually) from observations poleward of 70°N. IFS-NEMO shows a similar but smaller cold bias, while ICON tracks Berkeley Earth closely.
- Tropics (20°S–20°N): ICON displays a systematic cold bias of approximately 1–2 K across the equatorial band, whereas both IFS variants capture the magnitude of the tropical temperature peak accurately.
- Southern High Latitudes: IFS-NEMO shows a warm bias around 60°S–70°S (Southern Ocean/Antarctic coast), while ICON shows a slight warm bias in the Southern Hemisphere mid-latitudes (40°S–60°S).
Spatial Patterns
Biases are meridionally distinct: the IFS models (especially FESOM) struggle primarily with high-latitude cooling in the Northern Hemisphere, while ICON's primary error is a uniform cooling in the tropical belt.
Model Agreement
Inter-model divergence is largest in the Arctic (>70°N), where the spread between ICON (warmest/accurate) and IFS-FESOM (coldest) is substantial. Agreement is highest in the Southern Hemisphere mid-latitudes, though ICON remains slightly distinct (warmer) from the IFS group.
Physical Interpretation
The strong Arctic cold bias in IFS-FESOM suggests potential issues with sea-ice thermodynamics (excessive thickness or extent) or insufficient poleward ocean heat transport compared to the NEMO configuration. ICON's tropical cold bias may result from tuning of cloud radiative effects (excessive reflection) or convective parameterization leading to lower surface temperatures. The warm bias in the Southern Ocean for IFS-NEMO is a common coupled model feature, often linked to cloud phase errors (lack of supercooled liquid) allowing too much shortwave radiation to reach the surface.
Caveats
- Zonal averaging masks potential compensating biases between land and ocean or across different longitudes.
- The CMIP6 MMM is largely obscured, making it difficult to benchmark high-resolution performance against the standard-resolution ensemble.