Ocean Surface Ocean SST Evaluation
Synthesis
Related diagnostics
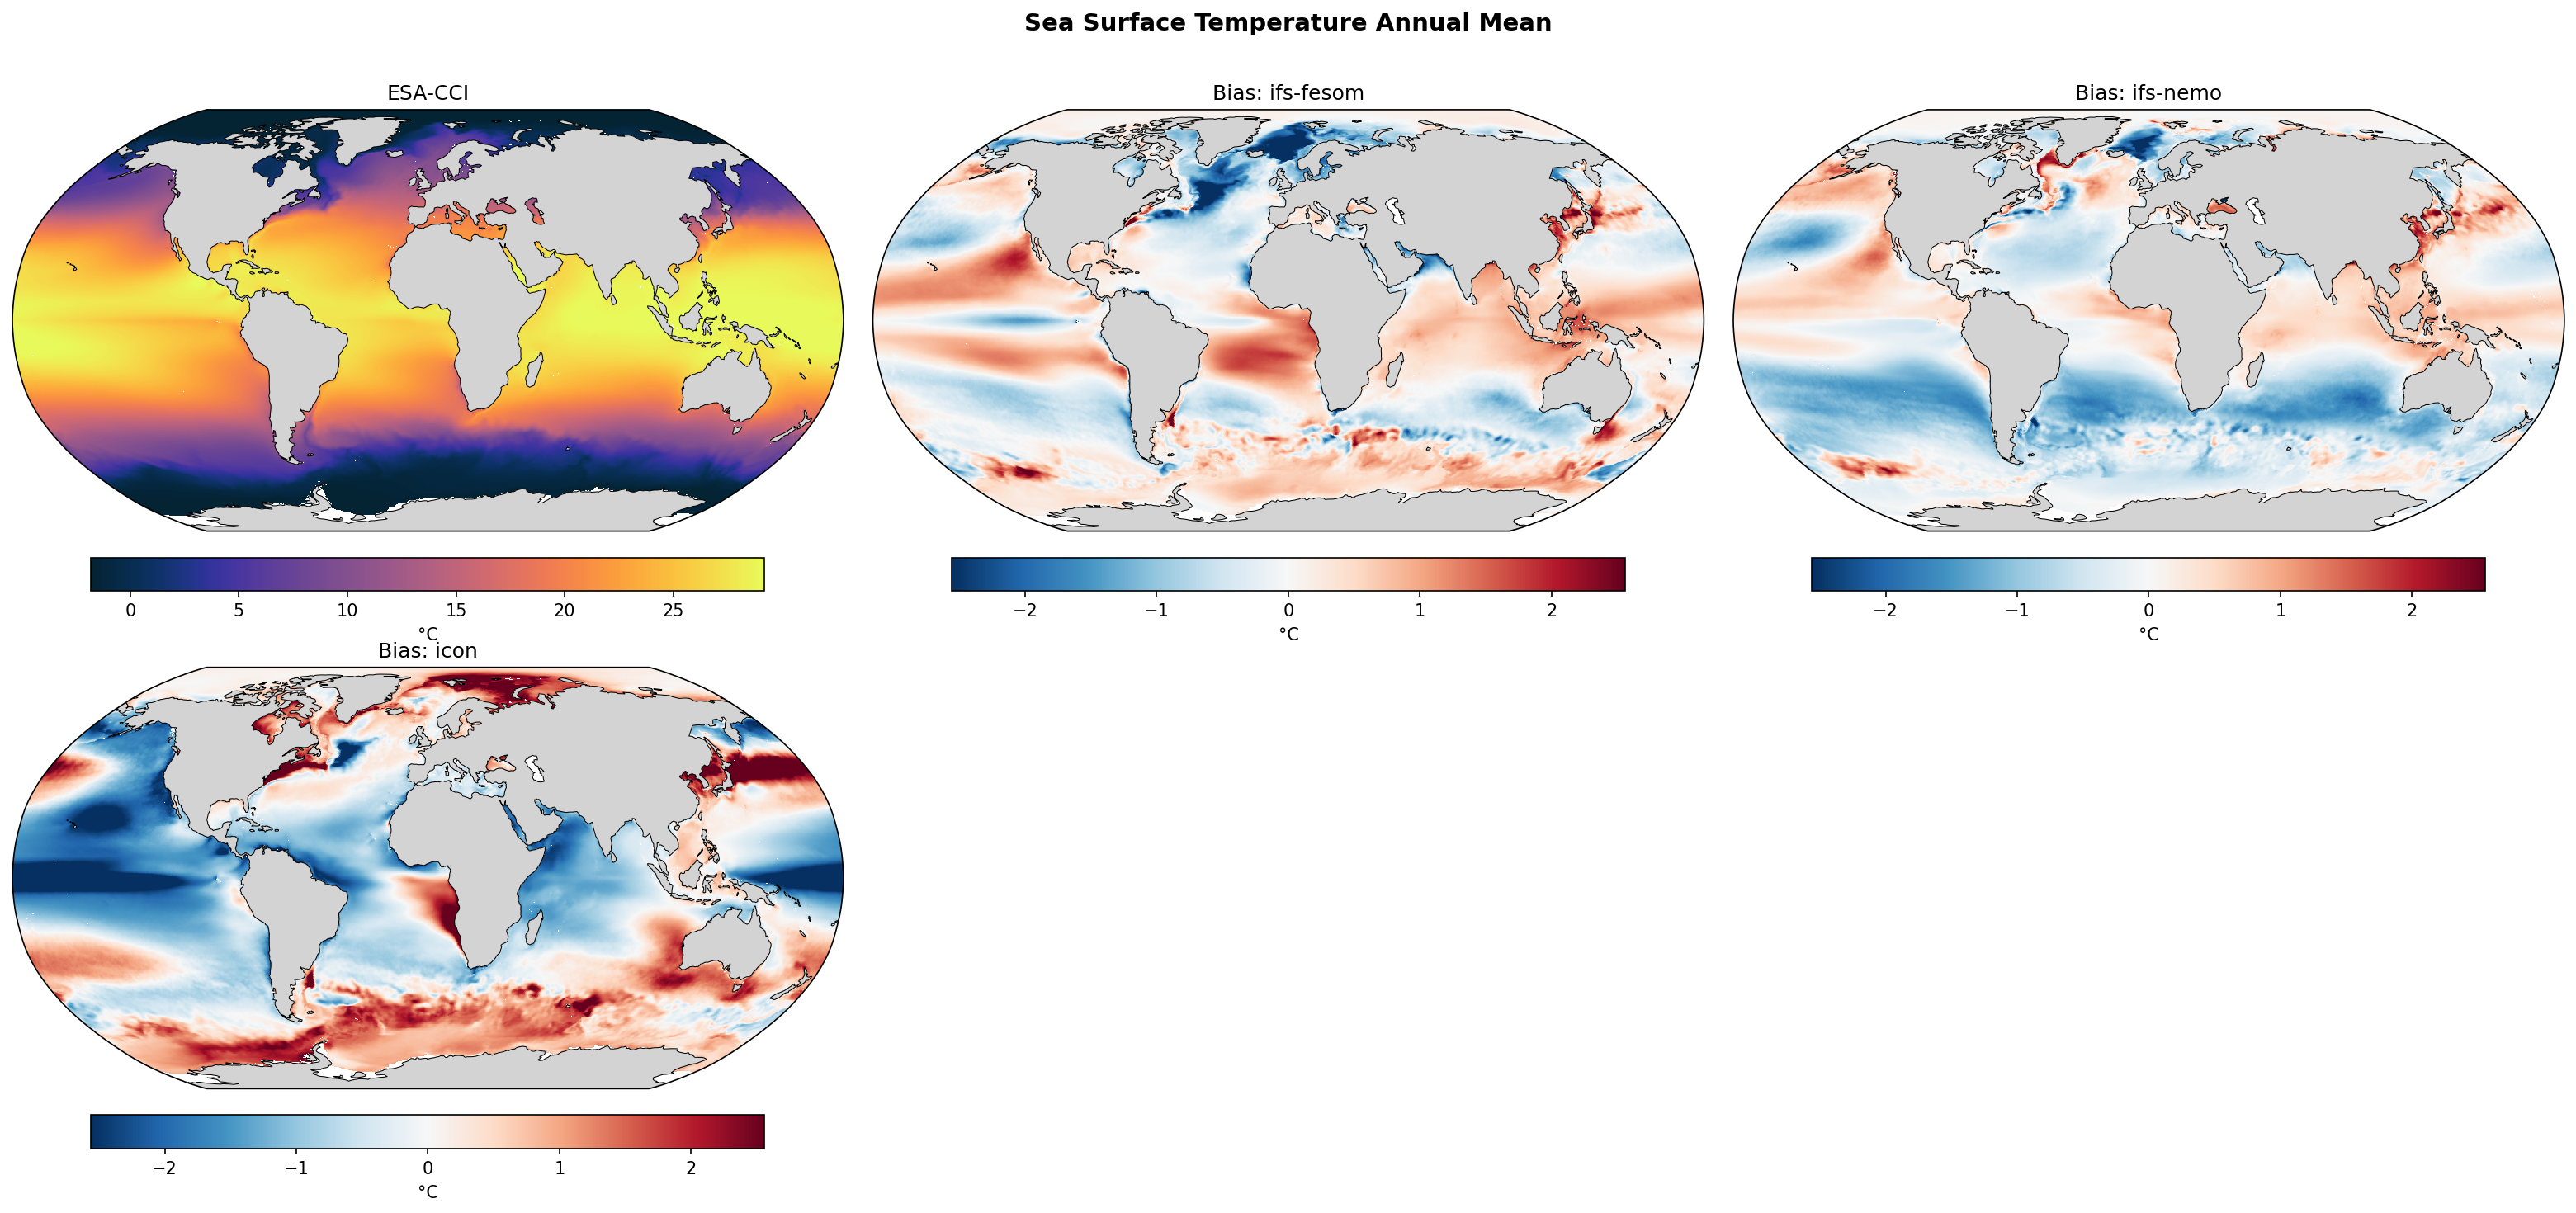
SST Annual Mean Bias
| Variables | avg_tos |
|---|---|
| Models | ifs-fesom, ifs-nemo, icon |
| Reference Dataset | ESA-CCI L4 v3.0.1 |
| Units | K |
| Period | 1990–2014 |
| ifs-fesom | Global Mean Bias: 0.15 · Rmse: 0.76 |
| ifs-nemo | Global Mean Bias: -0.20 · Rmse: 0.71 |
| icon | Global Mean Bias: -0.28 · Rmse: 1.36 |
Summary high
The figure displays annual mean sea surface temperature (SST) biases for three high-resolution coupled models (IFS-FESOM, IFS-NEMO, ICON) relative to ESA-CCI satellite observations.
Key Findings
- IFS-NEMO and IFS-FESOM exhibit moderate SST biases (RMSE ~0.71-0.76 K), while ICON shows substantially larger errors (RMSE ~1.36 K) characterized by extreme regional anomalies.
- All models struggle with western boundary current regions (Gulf Stream, Kuroshio), showing significant warm biases indicative of separation phase errors.
- ICON displays a severe warm bias across the Southern Ocean and widespread cold biases in the tropics and mid-latitudes, suggesting major ocean circulation or coupled feedback issues.
Spatial Patterns
Common patterns include a North Atlantic 'cold blob' in the subpolar gyre and warm biases in eastern boundary upwelling zones (e.g., off Peru and Angola). IFS-FESOM shows a warm bias in the eastern equatorial Pacific (weaker cold tongue), whereas ICON shows an intense tropical cold bias. In the Southern Ocean, ICON exhibits an anomalous circum-Antarctic warm bias (>2 K), in stark contrast to the moderate cold anomalies seen in the IFS models.
Model Agreement
IFS-NEMO and IFS-FESOM agree broadly on the spatial distribution of biases, particularly in the North Atlantic and coastal upwelling regions, though they differ slightly in global mean sign (+0.15 K vs -0.20 K). ICON stands out as a significant outlier with a completely different and much higher magnitude bias pattern.
Physical Interpretation
Warm biases in eastern boundary regions are likely driven by underestimated coastal upwelling or deficits in marine stratocumulus cloud cover (excessive incoming shortwave radiation). North Atlantic cold biases often relate to AMOC representation or local surface heat flux errors. The persistent warm biases along the US East Coast and Japan highlight that even at ~5 km resolution, accurately simulating the separation of the Gulf Stream and Kuroshio currents remains challenging. ICON's massive Southern Ocean warm bias points to potential issues with Antarctic Circumpolar Current positioning, excessive deep mixing, or significant cloud radiative forcing deficits over the Southern Ocean.
Caveats
- Biases may be heavily influenced by initial model drift due to the relatively short spin-up periods typical of these ultra-high-resolution simulations.
- SST biases are a coupled phenomenon; distinguishing between purely ocean dynamic errors (e.g., advection) and atmospheric forcing errors (e.g., cloud-radiative effects) requires further component-level analysis.
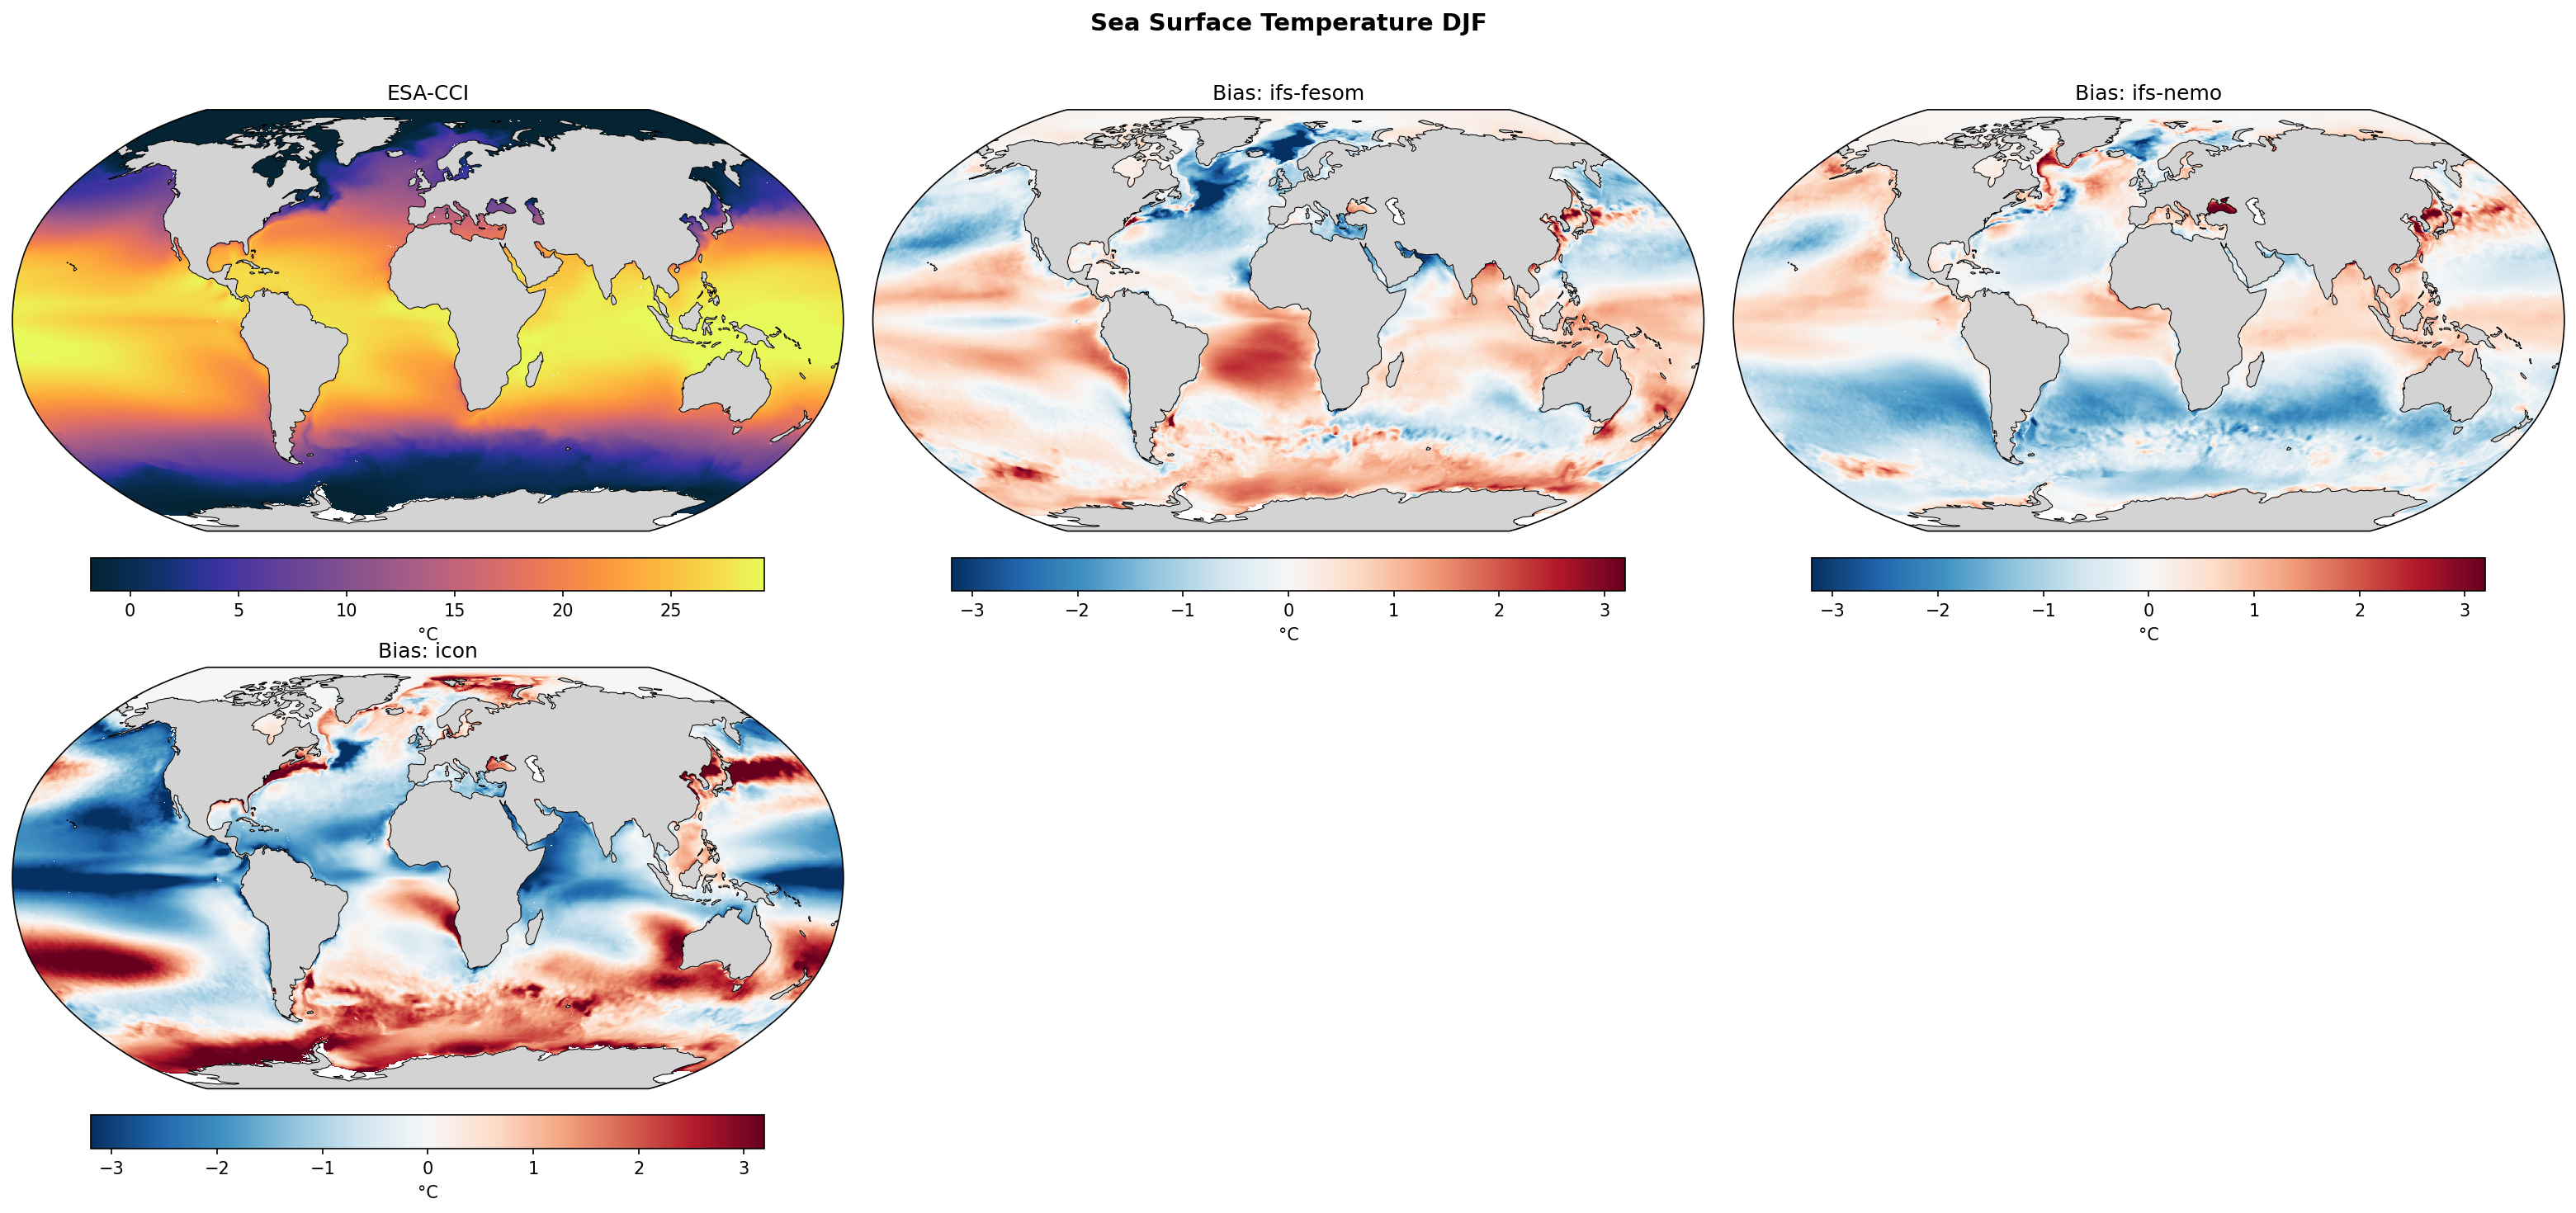
SST DJF Bias
| Variables | avg_tos |
|---|---|
| Models | ifs-fesom, ifs-nemo, icon |
| Reference Dataset | ESA-CCI L4 v3.0.1 |
| Units | K |
| Period | 1990–2014 |
| ifs-fesom | Global Mean Bias: 0.22 · Rmse: 0.93 |
| ifs-nemo | Global Mean Bias: -0.23 · Rmse: 0.85 |
| icon | Global Mean Bias: -0.23 · Rmse: 1.69 |
Summary high
This figure shows the spatial distribution of DJF sea surface temperature (SST) biases for three high-resolution DestinE models (IFS-FESOM, IFS-NEMO, ICON) relative to ESA-CCI satellite observations over the 1990-2014 period.
Key Findings
- ICON exhibits the most severe SST biases (RMSE 1.69 K), characterized by extreme cold anomalies across the Northern Hemisphere and tropics, and massive warm anomalies in the Southern Ocean.
- IFS-NEMO performs best globally (RMSE 0.85 K), showing a general cold bias in the Southern Ocean and equatorial Pacific, but warm biases in subtropical eastern boundary upwelling regions.
- IFS-FESOM shows a net global warm bias (+0.22 K), with prominent warming in the South Atlantic, Indian Ocean, and equatorial Pacific, alongside a distinct cold bias in the North Atlantic subpolar gyre.
- All models display localized dipole biases in western boundary current regions (Gulf Stream, Kuroshio), which are exceptionally pronounced in ICON.
Spatial Patterns
ICON shows a stark interhemispheric bias contrast: widespread cooling (< -3 K) in the North Atlantic, North Pacific, and tropical oceans, contrasted with intense warming (> 3 K) in the Southern Ocean and mid-latitude boundary currents. IFS-FESOM presents an El Niño-like warm bias in the equatorial Pacific and a prominent cold 'warming hole' in the North Atlantic. IFS-NEMO shows a La Niña-like cold equatorial Pacific and warm anomalies off the western coasts of the Americas and Africa.
Model Agreement
There is poor agreement among the models regarding the sign and spatial distribution of regional biases. IFS-FESOM has a global mean warm bias, whereas IFS-NEMO and ICON have cold biases. ICON's spatial variance (RMSE) is approximately double that of the IFS-based models. However, all models consistently struggle with western boundary currents and eastern boundary upwelling systems.
Physical Interpretation
ICON's extreme NH cold and SH warm biases suggest major deficiencies in meridional heat transport or profound errors in cloud radiative effects (e.g., insufficient Southern Ocean cloud cover). The severe warm biases in the Gulf Stream and Kuroshio extensions (especially in ICON) indicate delayed current separation, advecting tropical waters too far poleward. IFS-NEMO's warm biases in eastern boundary regions likely stem from under-represented marine stratocumulus clouds leading to excessive surface shortwave heating, a common issue in coupled models. IFS-FESOM's North Atlantic cold bias may point to a weaker AMOC or excessive wintertime heat loss.
Caveats
- The 1990-2014 evaluation period is relatively short and may convolve internal multidecadal variability (e.g., PDO, AMO phases) with systemic model biases.
- Satellite observations (ESA-CCI) have higher uncertainty in persistently cloudy regions (like the Southern Ocean) and near sea-ice margins.
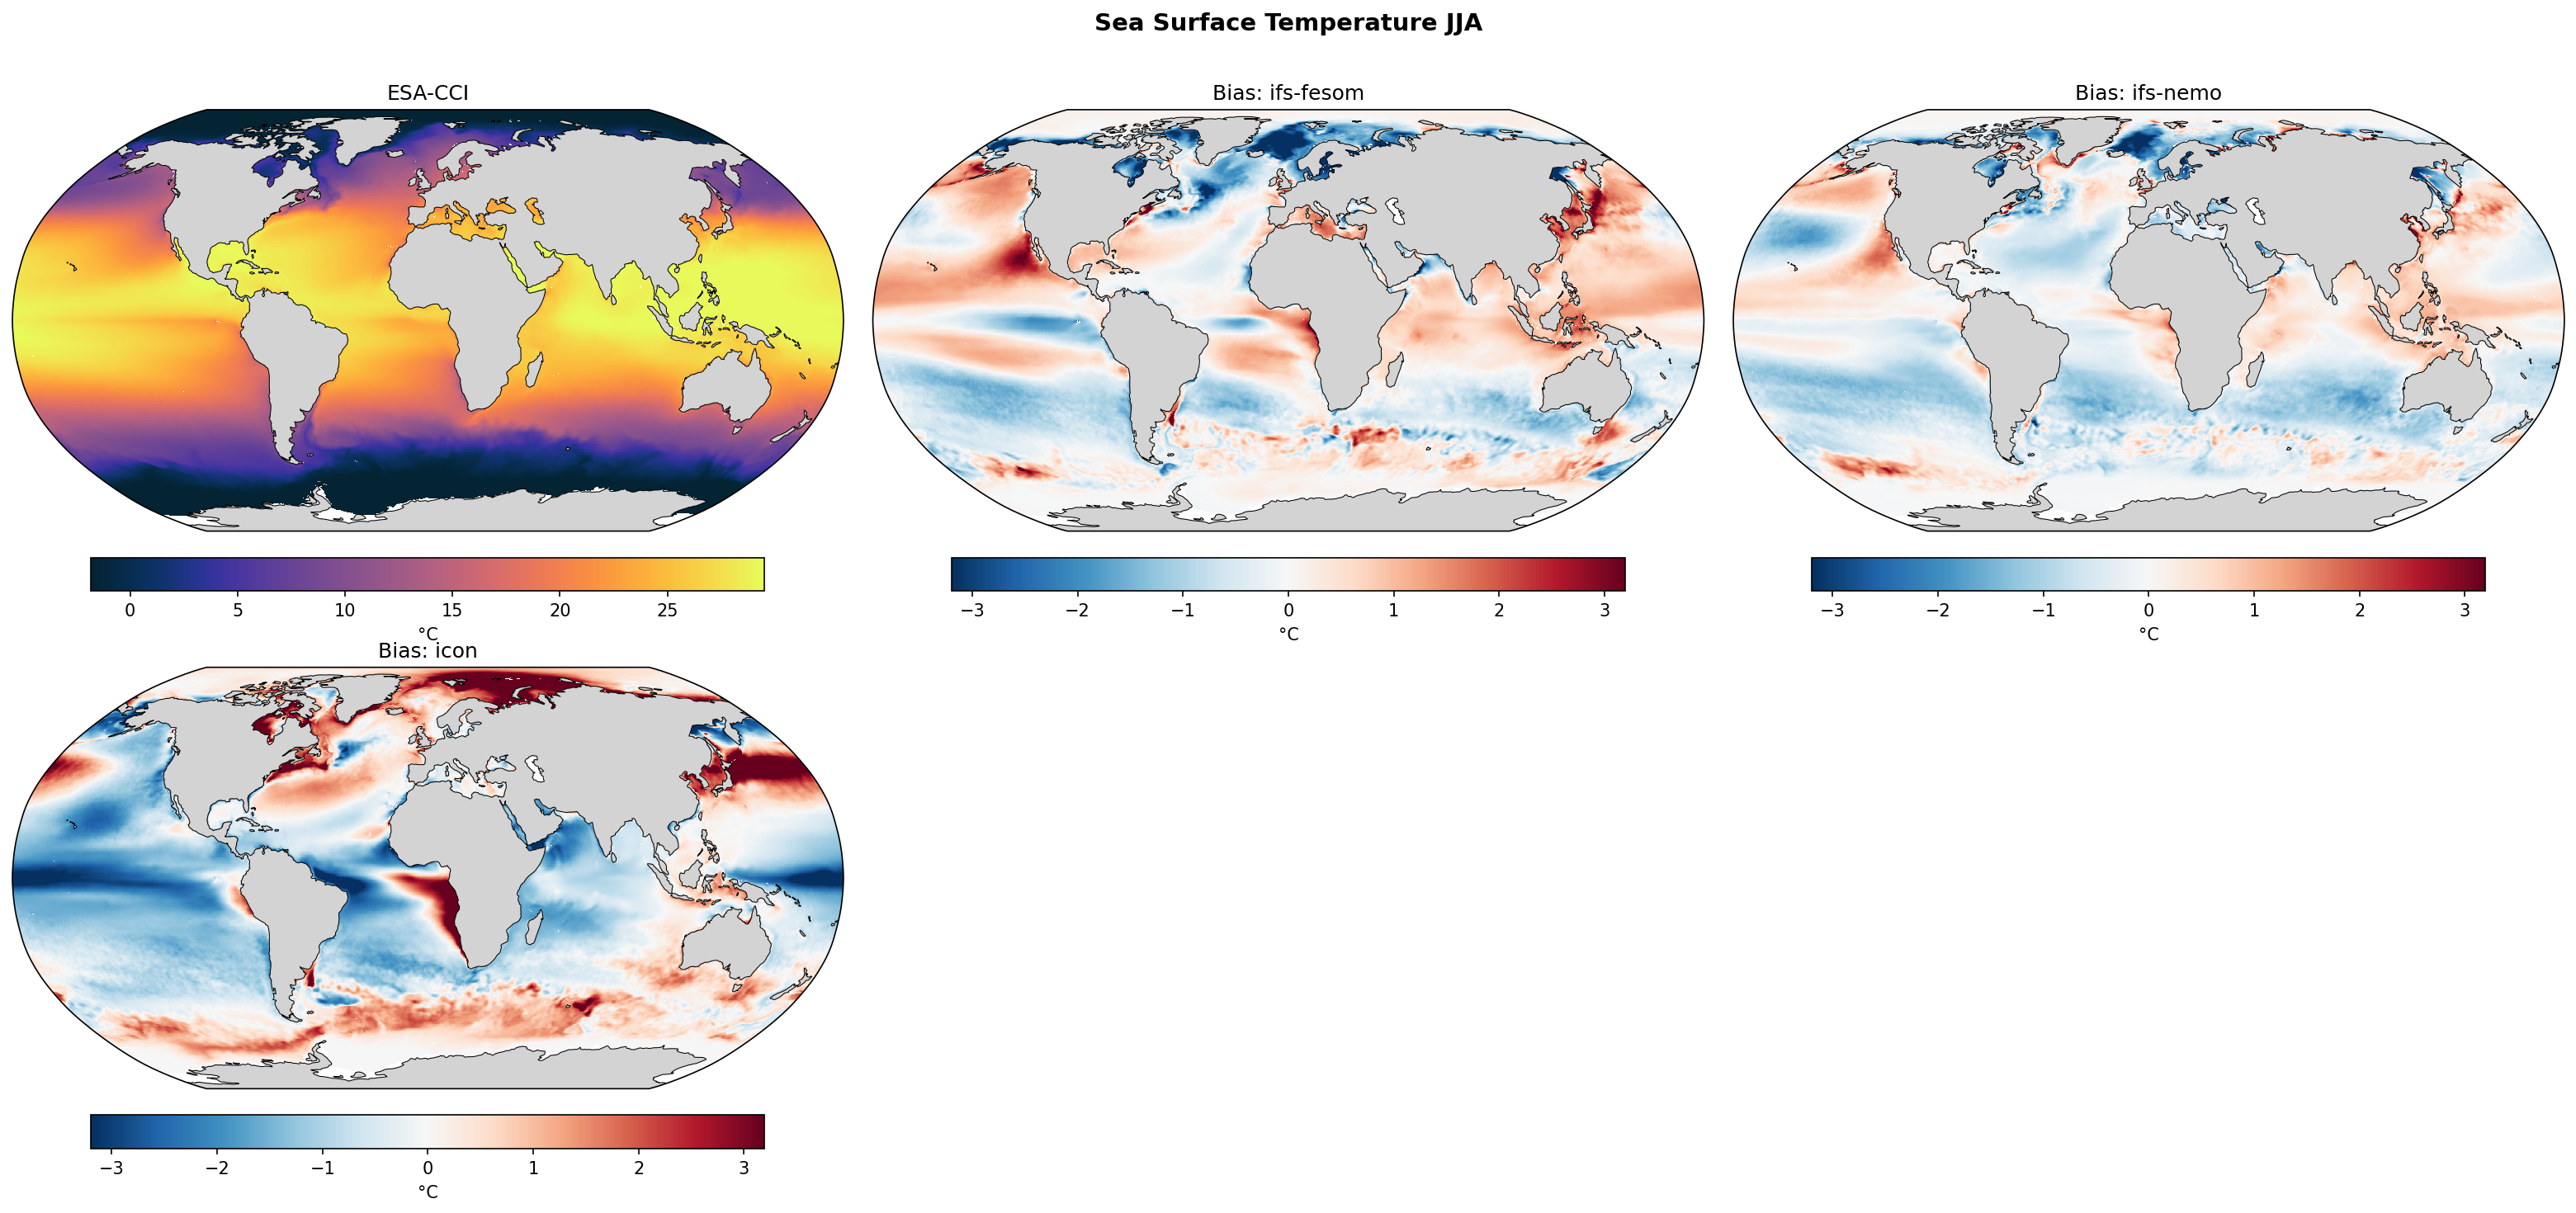
SST JJA Bias
| Variables | avg_tos |
|---|---|
| Models | ifs-fesom, ifs-nemo, icon |
| Reference Dataset | ESA-CCI L4 v3.0.1 |
| Units | K |
| Period | 1990–2014 |
| ifs-fesom | Global Mean Bias: 0.08 · Rmse: 0.93 |
| ifs-nemo | Global Mean Bias: -0.19 · Rmse: 0.75 |
| icon | Global Mean Bias: -0.32 · Rmse: 1.41 |
Summary high
Evaluation of JJA sea surface temperature biases for three high-resolution coupled models compared to ESA-CCI satellite observations, revealing pronounced regional bias differences and varying overall performance.
Key Findings
- IFS-NEMO performs best overall with the lowest RMSE (0.75 K) and the most subdued regional bias patterns.
- ICON displays severe regional biases (RMSE = 1.41 K), highlighted by extreme warm biases in eastern boundary upwelling systems and Northern Hemisphere high latitudes.
- All three models share a cold tongue bias in the central and eastern equatorial Pacific, a common feature in coupled global climate models.
Spatial Patterns
IFS-FESOM shows warm biases in the subtropical Pacific and western boundary currents, offset by a cold subpolar North Atlantic. IFS-NEMO exhibits broad but mild cold biases across the North Pacific and equatorial regions. ICON features intense warm biases (>3 K) in the Benguela and Humboldt coastal upwelling zones and Arctic marginal seas (Barents, Greenland, and Bering Seas), contrasted by widespread cold biases across the broader tropical and subtropical ocean basins.
Model Agreement
The models agree on the presence of a cold bias in the equatorial Pacific and some dipole structures near western boundary currents, but diverge substantially in magnitude and sign elsewhere. ICON is a significant outlier, exhibiting much larger RMSE and extreme regional warm biases compared to the relatively constrained errors in IFS-FESOM and IFS-NEMO.
Physical Interpretation
The pervasive equatorial Pacific cold tongue bias likely results from overly strong trade winds or excessive vertical mixing/upwelling. ICON's extreme warm biases in eastern boundary upwelling regions suggest poorly represented coastal upwelling dynamics or missing stratocumulus-SST radiative feedbacks, which are notoriously difficult to capture even at high resolution. ICON's warm biases in the subpolar/polar marginal seas point to insufficient summer sea ice extent, overly strong poleward ocean heat transport, or excessive surface stratification.
Caveats
- The 1990-2014 climatological period may encompass unphased internal multi-decadal variability (e.g., ENSO, PDO) in the free-running models that differs from the observational record.
- Large local biases around western boundary currents (Gulf Stream, Kuroshio) may partly reflect slight spatial displacements of sharp fronts rather than fundamental physical errors (the double penalty effect).
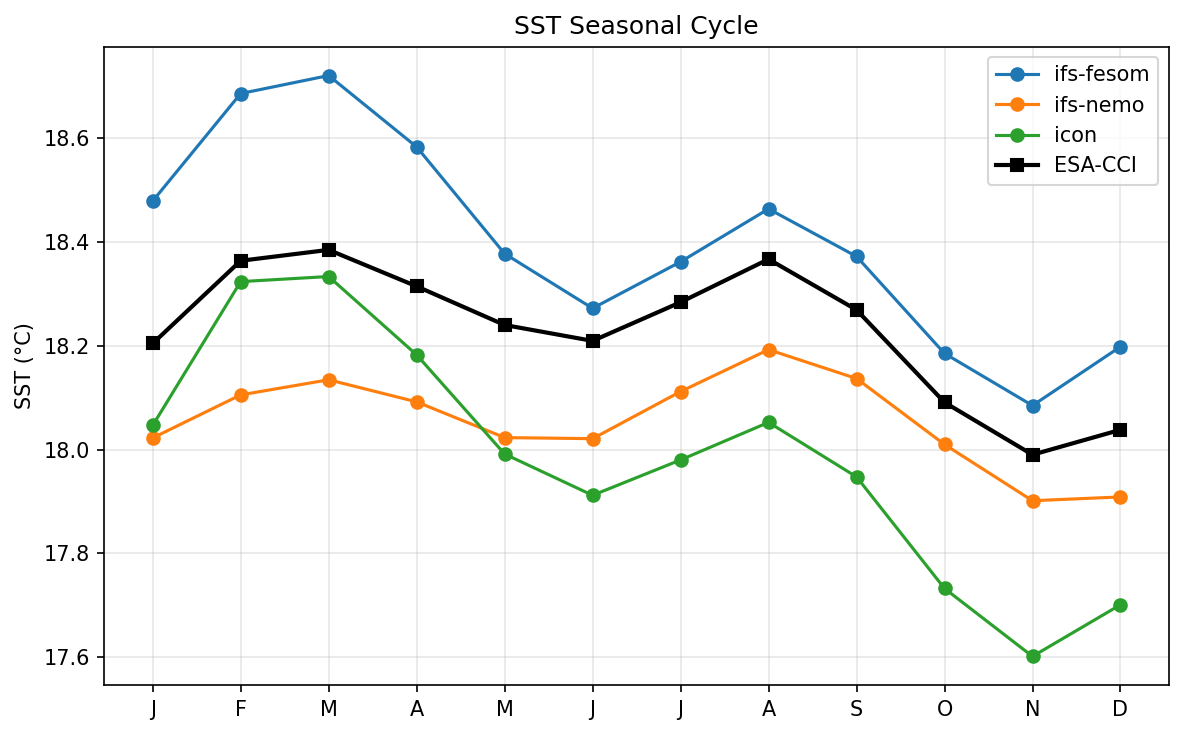
SST Seasonal Cycle
| Variables | avg_tos |
|---|---|
| Models | ifs-fesom, ifs-nemo, icon, ESA-CCI |
| Reference Dataset | ESA-CCI L4 v3.0.1 |
| Units | K |
| Period | 1990–2014 |
Summary high
This figure displays the global-mean Sea Surface Temperature (SST) seasonal cycle for three DestinE models compared against ESA-CCI observations, highlighting systematic mean-state biases and differences in seasonal amplitude.
Key Findings
- IFS-FESOM exhibits a systematic warm bias of approximately 0.1 to 0.3 °C throughout the year compared to observations.
- IFS-NEMO displays a consistent cold bias of roughly 0.1 to 0.2 °C across all months.
- ICON shows a seasonally dependent cold bias that amplifies significantly during boreal autumn, dropping almost 0.4 °C below observations by November.
- All models successfully capture the observed bimodal nature of the global SST seasonal cycle, peaking in March and August.
Spatial Patterns
The temporal pattern features a bimodal seasonal cycle with a primary maximum in March (~18.39 °C) and a secondary maximum in August (~18.37 °C), corresponding to the peak summer warming of the Southern and Northern Hemisphere oceans, respectively. While IFS-FESOM and IFS-NEMO maintain relatively constant offsets from observations, ICON's seasonal amplitude is exaggerated, with excessively rapid cooling from August to November.
Model Agreement
The models agree well with the observations on the phase of the seasonal cycle, capturing the timing of maxima and minima. However, they diverge significantly in their absolute mean states, bracketing the observations with both warm (IFS-FESOM) and cold (IFS-NEMO, ICON) biases. ICON shows the poorest agreement in terms of seasonal amplitude.
Physical Interpretation
The bimodal global SST cycle reflects the asynchronous heating of the Northern and Southern Hemisphere oceans. The systematic warm and cold biases in IFS-FESOM and IFS-NEMO suggest underlying imbalances in net surface heat fluxes or persistent differences in upper-ocean mixing parameterizations. ICON's rapid autumnal cooling implies potential issues with mixed layer depth dynamics, such as a too-shallow summer mixed layer in the Northern Hemisphere that is unable to store sufficient heat, leading to premature and excessive cooling.
Caveats
- Global mean metrics can obscure significant, compensating regional or hemispheric biases.
- Comparisons are sensitive to the definition of SST; satellites measure the subskin or foundation temperature, whereas models report the temperature of their uppermost ocean layer, which can be several meters thick.
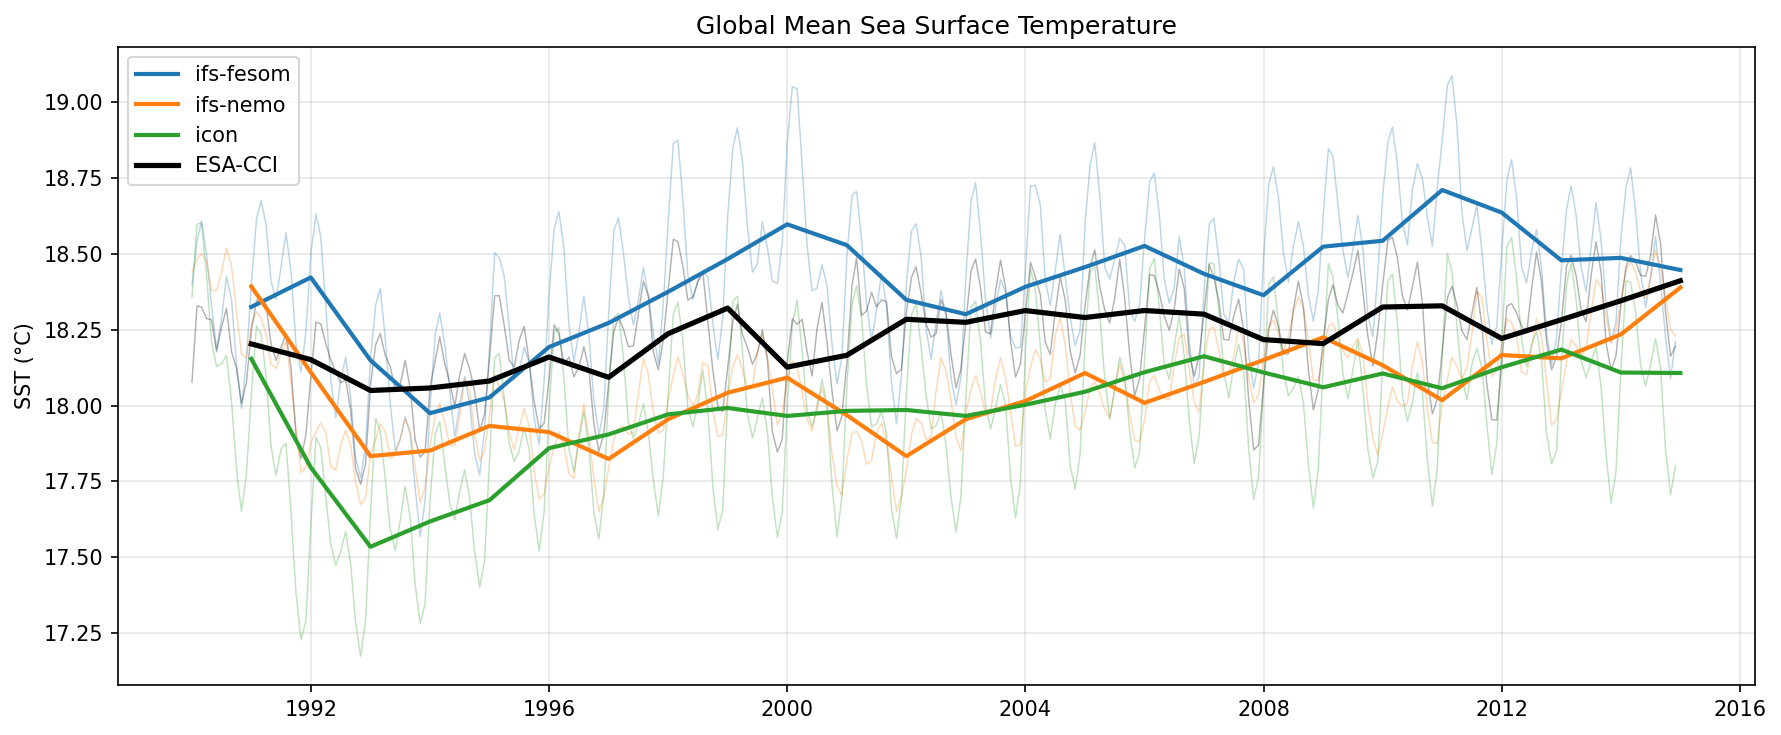
SST Global Mean Time Series
| Variables | avg_tos |
|---|---|
| Models | ifs-fesom, ifs-nemo, icon, ESA-CCI |
| Reference Dataset | ESA-CCI L4 v3.0.1 |
| Units | K |
| Period | 1990–2014 |
Summary high
Global mean sea surface temperature time series from 1990 to 2015, showing distinct mean-state offsets among the high-resolution DestinE models compared to ESA-CCI observations.
Key Findings
- IFS-FESOM exhibits a persistent warm bias of approximately 0.2 to 0.4 °C relative to ESA-CCI observations throughout the time series.
- IFS-NEMO and ICON display persistent cold biases of roughly 0.2 to 0.3 °C, with ICON being consistently the coldest model.
- ICON shows an exaggerated cooling response in the early 1990s, dropping much lower than observations and other models.
- All models generally capture the long-term warming trend and key interannual variability events, such as the 1998 El Niño.
Spatial Patterns
Temporally, all models track the observed decadal warming trend and the phase of interannual variations. The seasonal cycle amplitude (visible in the semi-transparent monthly lines) appears slightly larger in the models, particularly ICON, than in the observations.
Model Agreement
The models bracket the observational reference, indicating poor agreement on the absolute mean state but good agreement on temporal variability. IFS-FESOM is an outlier on the warm side, while ICON and IFS-NEMO cluster on the cold side.
Physical Interpretation
The persistent offsets in absolute SST reflect differing equilibrium states in the coupled systems, likely driven by differences in net surface energy flux balances or ocean mixing efficiencies. The sharp cooling in 1992-1993 is the climate response to the Mt. Pinatubo eruption; ICON's exaggerated drop suggests an overly strong aerosol forcing or climate sensitivity in its setup.
Caveats
- Global mean metrics obscure compensating regional biases (e.g., overly cold equatorial Pacific vs overly warm boundary currents).
- The initial state at 1990 strongly depends on the model spin-up procedure, which may explain the immediate divergence in absolute values.
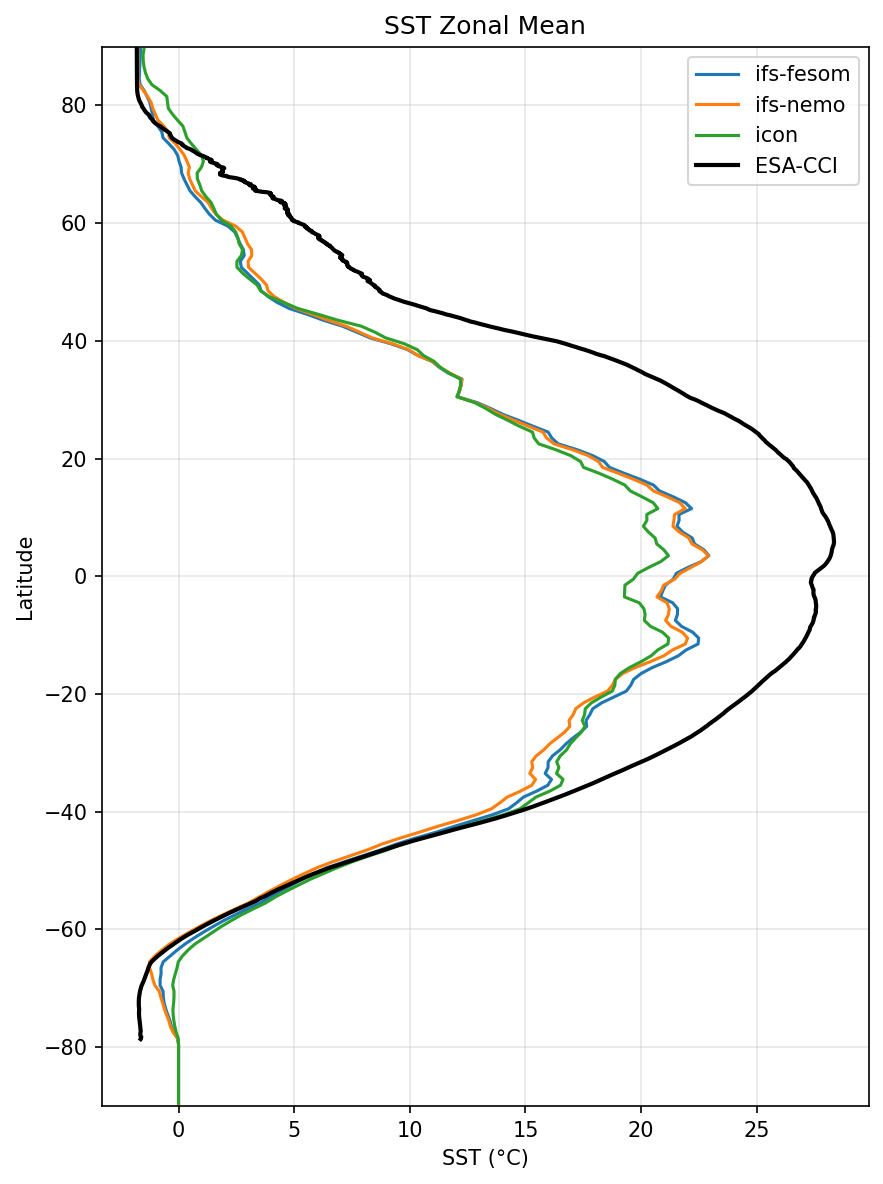
SST Zonal Mean Profile
| Variables | avg_tos |
|---|---|
| Models | ifs-fesom, ifs-nemo, icon, ESA-CCI |
| Reference Dataset | ESA-CCI L4 v3.0.1 |
| Units | K |
| Period | 1990–2014 |
Summary high
Zonal mean sea surface temperature (SST) profiles for three DestinE models compared against ESA-CCI observations, revealing a profound diagnostic processing error rather than physical climate features.
Key Findings
- The models appear to exhibit a massive 'cold bias' of up to 6-8°C in the tropics and Northern Hemisphere compared to ESA-CCI.
- This apparent bias is a diagnostic artifact caused by incorrectly including land points (treated as 0°C) in the zonal mean calculation for the models, while the observational dataset is correctly masked.
- In completely land-free latitudes (e.g., 50°S-60°S), the models match the ESA-CCI observations almost perfectly, strongly suggesting the underlying model SSTs are actually realistic.
Spatial Patterns
The magnitude of the apparent cold bias strictly tracks the global zonal land fraction. The artifact is largest at the equator and in the Northern Hemisphere where continental land mass is substantial. In the Southern Ocean (40°S-60°S), where the ocean fraction approaches 100%, the model and observational curves converge. Furthermore, sharp, unphysical steps in the model profiles (e.g., near 30°N) correspond precisely to abrupt changes in continental geometry (e.g., the northern coasts of Africa and the Gulf of Mexico).
Model Agreement
IFS-FESOM, IFS-NEMO, and ICON show nearly identical profiles, indicating all three model outputs were processed through the same faulty zonal mean diagnostic script. Minor variations between the models likely reflect slight differences in their native land-sea masks rather than genuine SST divergence.
Physical Interpretation
There is no physical or climatic mechanism driving the primary features of the model profiles in this plot; it is a purely mathematical artifact of averaging valid ocean temperatures with zero-valued land points across longitudes. The true physical performance of the models appears to be very good, as evidenced by the lack of bias in the land-free Southern Hemisphere latitudes where the diagnostic math inadvertently works correctly.
Caveats
- This figure is scientifically invalid for assessing actual model SST biases due to the unapplied land-sea mask in the diagnostic pipeline.
- Any genuine, subtle SST biases (e.g., Southern Ocean warm biases, tropical cold tongues, or boundary current errors) are completely obscured by this processing artifact.