Evaluation Global Climatology Biases CMIP6
CMIP6 Multi-Model Mean Context
Comparison with CMIP6 ensemble mean from 10 members.
Contributing models: ACCESS-ESM1-5, AWI-CM-1-1-MR, CNRM-CM6-1, CNRM-ESM2-1, EC-Earth3, GISS-E2-1-G, INM-CM5-0, IPSL-CM6A-LR, MPI-ESM1-2-LR, MRI-ESM2-0
Synthesis
Related diagnostics
10m U Wind Annual Mean Bias
| Variables | avg_10u |
|---|---|
| Models | ifs-fesom, ifs-nemo, icon, CMIP6 MMM, MPI-ESM1-2-LR/r1i1p1f1, GISS-E2-1-G/r1i1p1f2, IPSL-CM6A-LR/r1i1p1f1, ACCESS-ESM1-5/r1i1p1f1, EC-Earth3/r1i1p1f1, CNRM-CM6-1/r1i1p1f2, AWI-CM-1-1-MR/r1i1p1f1, CNRM-ESM2-1/r1i1p1f2, INM-CM5-0/r1i1p1f1, MRI-ESM2-0/r1i1p1f1 |
| Reference Dataset | ERA5 |
| Units | m/s |
| Period | 1990–2014 |
| ifs-fesom | Global Mean Bias: 0.03 · Rmse: 0.58 |
| ifs-nemo | Global Mean Bias: -0.06 · Rmse: 0.44 |
| icon | Global Mean Bias: 0.25 · Rmse: 1.51 |
| CMIP6 MMM | Global Mean Bias: 0.02 · Rmse: 0.62 |
| MPI-ESM1-2-LR/r1i1p1f1 | Global Mean Bias: 0.08 · Rmse: 0.91 |
| GISS-E2-1-G/r1i1p1f2 | Global Mean Bias: 0.14 · Rmse: 1.12 |
| IPSL-CM6A-LR/r1i1p1f1 | Global Mean Bias: -0.03 · Rmse: 0.85 |
| ACCESS-ESM1-5/r1i1p1f1 | Global Mean Bias: -0.18 · Rmse: 0.86 |
| EC-Earth3/r1i1p1f1 | Global Mean Bias: 0.05 · Rmse: 0.62 |
| CNRM-CM6-1/r1i1p1f2 | Global Mean Bias: 0.03 · Rmse: 0.88 |
| AWI-CM-1-1-MR/r1i1p1f1 | Global Mean Bias: 0.09 · Rmse: 0.81 |
| CNRM-ESM2-1/r1i1p1f2 | Global Mean Bias: 0.03 · Rmse: 0.89 |
| INM-CM5-0/r1i1p1f1 | Global Mean Bias: 0.08 · Rmse: 1.06 |
| MRI-ESM2-0/r1i1p1f1 | Global Mean Bias: -0.06 · Rmse: 0.99 |
Summary high
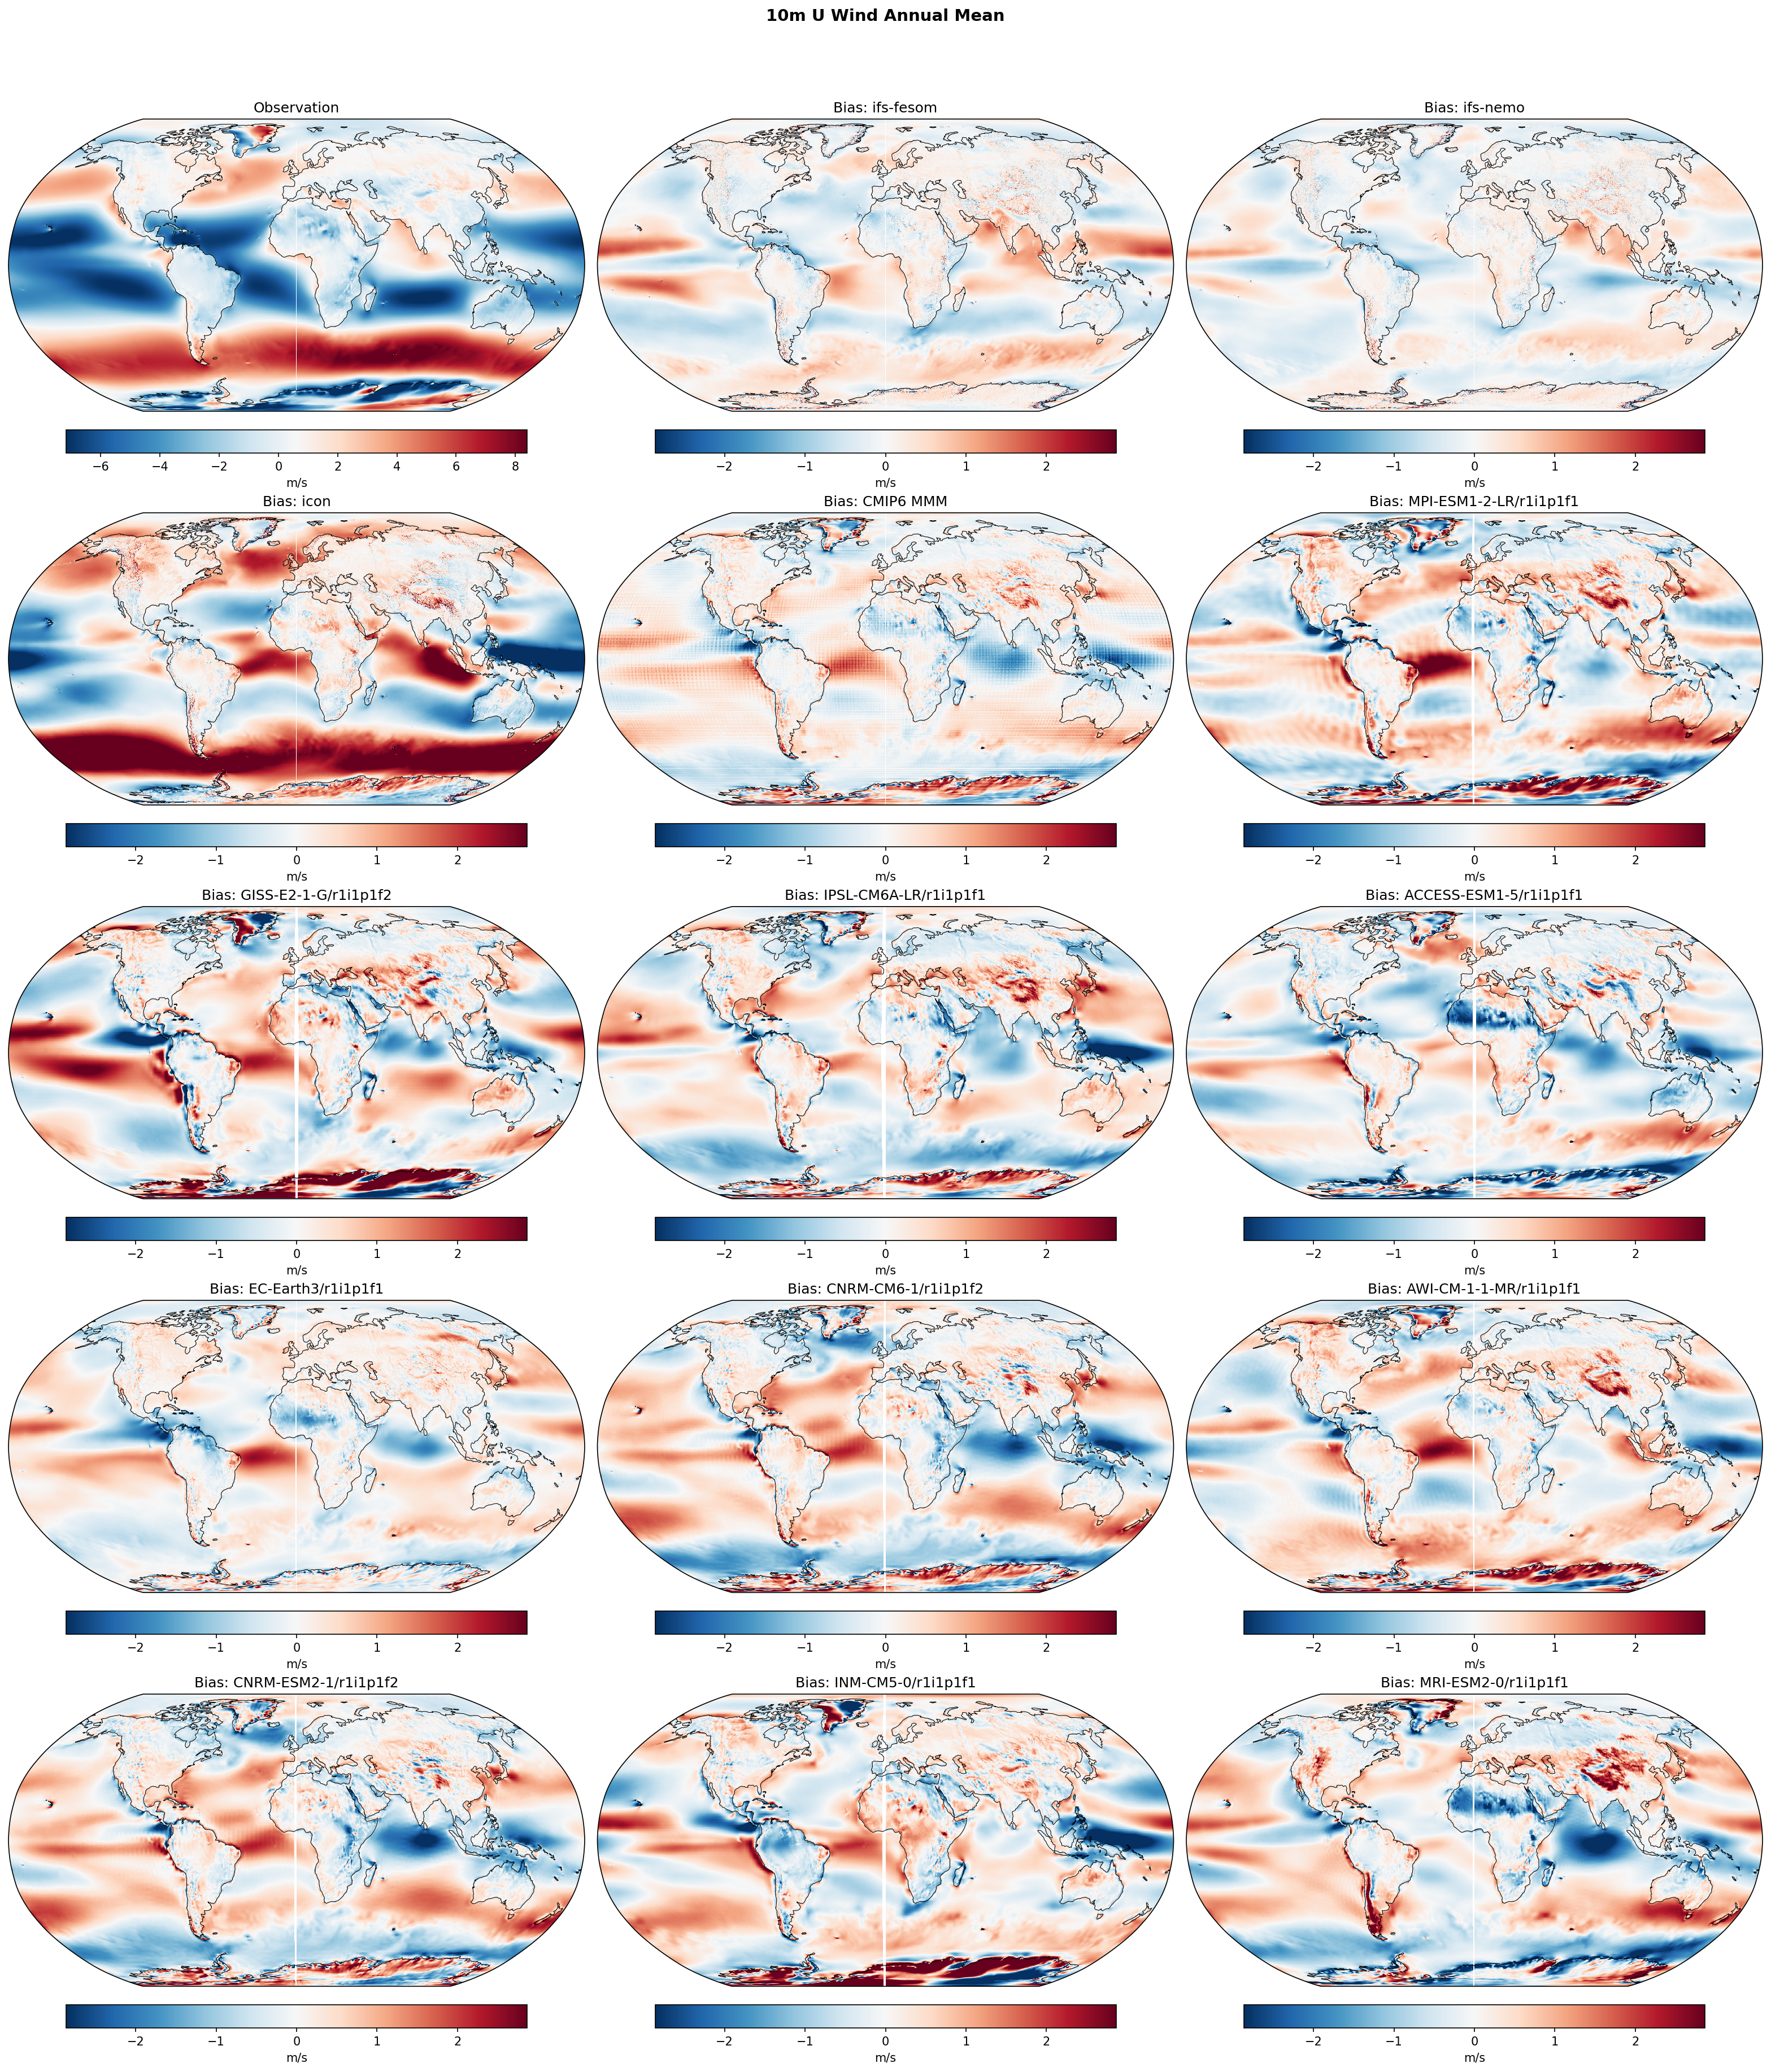
Evaluation of the annual mean 10m zonal (U) wind climatology reveals outstanding performance by the high-resolution IFS models but a severe overestimation of the global wind circulation in the ICON model.
Key Findings
- IFS-NEMO and IFS-FESOM demonstrate the highest fidelity to ERA5 observations, achieving the lowest global RMSEs (0.43 m/s and 0.55 m/s, respectively) and outperforming the CMIP6 multi-model mean.
- ICON is a stark outlier with massive global biases (RMSE 1.50 m/s), characterized by exaggerated trade winds and overly intense mid-latitude westerlies.
- Individual CMIP6 models frequently exhibit structural biases in the Southern Ocean, often presenting as dipole patterns indicative of equatorward-shifted or overly weak westerly jets.
Spatial Patterns
The ICON model displays intense negative biases across the tropical Pacific and Atlantic oceans (indicating overly strong easterly trade winds) and intense positive biases in the Southern Ocean and Northern Hemisphere mid-latitudes (indicating overly strong westerlies). In contrast, individual CMIP6 models (e.g., GISS-E2-1-G, INM-CM5-0) frequently show bands of positive bias around 30-40°S and negative bias around 60°S, corresponding to an equatorward displacement of the Southern Hemisphere eddy-driven jet. The IFS models are remarkably free of these broad, systematic spatial bias patterns.
Model Agreement
IFS-FESOM and IFS-NEMO show excellent agreement with observations and with each other. ICON diverges fundamentally from all other models and observations. CMIP6 models display wide inter-model spread regarding the exact strength and latitudinal position of the major wind belts, though the CMIP6 MMM effectively smooths many of these individual, opposing errors.
Physical Interpretation
The superior performance of the high-resolution IFS models likely stems from better-resolved orographic drag, improved boundary layer parameterizations, and more accurately resolved transient eddy momentum fluxes, which are critical for maintaining the correct latitudinal position of the westerly jets. ICON's globally exaggerated winds strongly point to insufficient surface friction/drag or overly vigorous parameterized convection driving an artificially strong Hadley circulation. The equatorward bias of the Southern Ocean jet in many CMIP6 models is a well-known coarse-resolution artifact, linked to the under-representation of eddy-driven momentum convergence poleward of the jet core.
Caveats
- The severe biases in ICON suggest a fundamental tuning issue (e.g., missing or untuned surface drag parameterizations) rather than a pure resolution-based limitation, making direct dynamical comparisons with the IFS models challenging for this specific configuration.
- While ERA5 is a high-quality reference, surface wind estimates in the observation-sparse Southern Ocean rely heavily on satellite scatterometer data and model physics, introducing minor observational uncertainties.
10m U Wind DJF Bias
| Variables | avg_10u |
|---|---|
| Models | ifs-fesom, ifs-nemo, icon, CMIP6 MMM, MPI-ESM1-2-LR/r1i1p1f1, GISS-E2-1-G/r1i1p1f2, IPSL-CM6A-LR/r1i1p1f1, ACCESS-ESM1-5/r1i1p1f1, EC-Earth3/r1i1p1f1, CNRM-CM6-1/r1i1p1f2, AWI-CM-1-1-MR/r1i1p1f1, CNRM-ESM2-1/r1i1p1f2, INM-CM5-0/r1i1p1f1, MRI-ESM2-0/r1i1p1f1 |
| Reference Dataset | ERA5 |
| Units | m/s |
| Period | 1990–2014 |
| CMIP6 MMM | Global Mean Bias: -0.04 · Rmse: None |
| MPI-ESM1-2-LR/r1i1p1f1 | Global Mean Bias: 0.02 · Rmse: None |
| GISS-E2-1-G/r1i1p1f2 | Global Mean Bias: 0.13 · Rmse: None |
| IPSL-CM6A-LR/r1i1p1f1 | Global Mean Bias: -0.08 · Rmse: None |
| ACCESS-ESM1-5/r1i1p1f1 | Global Mean Bias: -0.28 · Rmse: None |
| EC-Earth3/r1i1p1f1 | Global Mean Bias: 0.00 · Rmse: None |
| CNRM-CM6-1/r1i1p1f2 | Global Mean Bias: -0.05 · Rmse: None |
| AWI-CM-1-1-MR/r1i1p1f1 | Global Mean Bias: 0.05 · Rmse: None |
| CNRM-ESM2-1/r1i1p1f2 | Global Mean Bias: -0.07 · Rmse: None |
| INM-CM5-0/r1i1p1f1 | Global Mean Bias: 0.09 · Rmse: None |
| MRI-ESM2-0/r1i1p1f1 | Global Mean Bias: -0.12 · Rmse: None |
Summary high
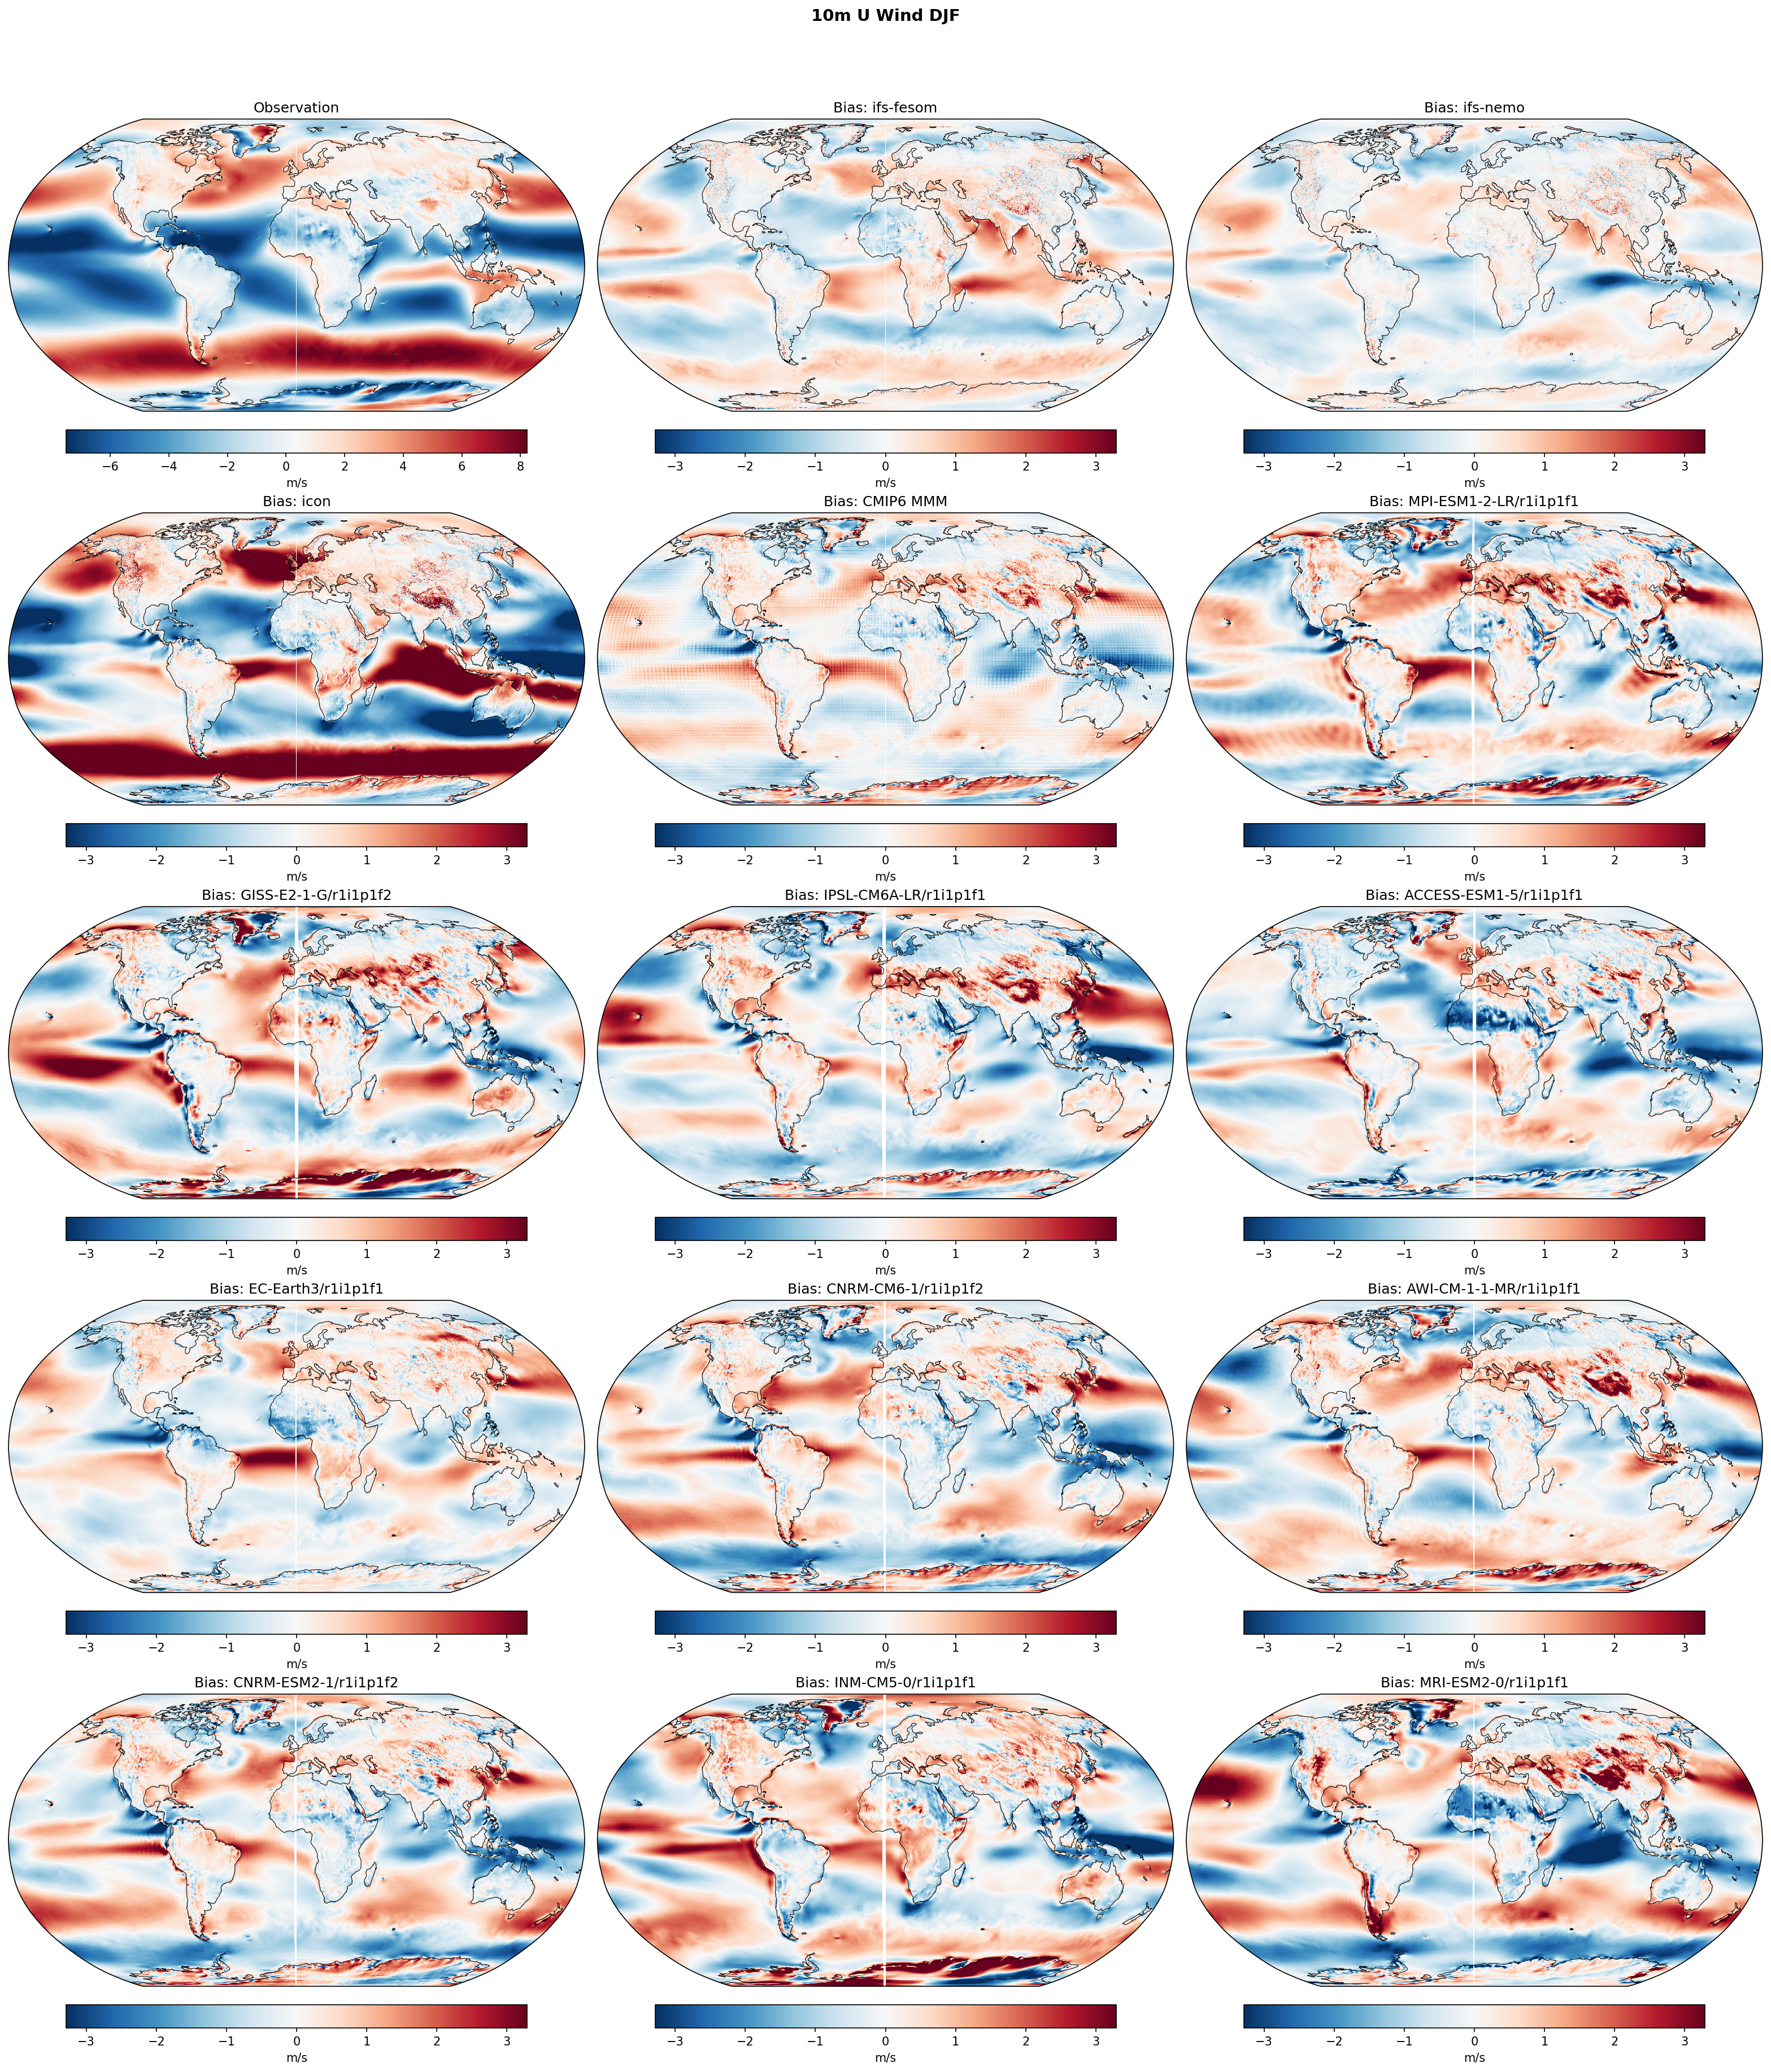
Evaluation of DJF 10m zonal wind biases reveals that while IFS-based high-resolution models show moderate biases comparable to CMIP6 models, the ICON model exhibits exceptionally large global biases characterized by drastically weakened surface circulation.
Key Findings
- The ICON model displays severe, widespread biases, heavily underestimating the strength of both mid-latitude westerlies (negative bias) and tropical easterlies (positive bias), often saturating the color scale (±3 m/s).
- IFS-FESOM and IFS-NEMO show very similar, moderate bias patterns, performing on par with or better than individual CMIP6 models and indicating that the choice of ocean model has limited impact on this atmospheric field.
- Many CMIP6 models and the IFS models exhibit a meridional dipole bias in the Southern Ocean, indicative of an equatorward shift or structural error in the representation of the eddy-driven jet.
Spatial Patterns
Observations highlight strong westerlies in the Southern Ocean and Northern Hemisphere storm tracks, alongside easterly trades in the tropics. Bias maps for IFS and CMIP6 models frequently show negative biases in the core of the mid-latitude jets and positive biases in the tropics, indicating a general weakening of the surface circulation. In ICON, this pattern is extreme: massive negative biases dominate the North Pacific, North Atlantic, and Southern Ocean westerlies, while massive positive biases cover the tropical oceans, effectively representing a 'flattened' global wind field.
Model Agreement
IFS-FESOM and IFS-NEMO are in strong agreement with each other and broadly align with the bias magnitudes and spatial structures seen in the CMIP6 multi-model mean (MMM). ICON strongly disagrees with all other models, presenting an outlier case with biases that are structurally similar but vastly larger in magnitude. Inter-model spread among individual CMIP6 models is high, particularly in the North Pacific and Southern Ocean.
Physical Interpretation
The extreme underestimation of surface winds in ICON suggests systemic issues with surface drag formulation, boundary layer momentum mixing, or the coupling between resolved and parameterized momentum transport at high resolution. The dipole biases in the Southern Ocean seen in IFS and CMIP6 models reflect the longstanding challenge in coupled climate models of correctly positioning the eddy-driven jet and the Antarctic Circumpolar Current. Widespread positive biases in the tropics (weakened trade winds) are typically linked to deficiencies in representing the strength of the Hadley and Walker circulations or shallow convective momentum transport.
Caveats
- The extreme magnitude of the ICON biases suggests a potential configuration, tuning, or spin-up issue for this specific high-resolution run, rather than standard structural model drift.
- Evaluation relies on ERA5 reanalysis, which itself contains uncertainties in surface wind fields over observation-sparse regions like the Southern Ocean.
10m U Wind JJA Bias
| Variables | avg_10u |
|---|---|
| Models | ifs-fesom, ifs-nemo, icon, CMIP6 MMM, MPI-ESM1-2-LR/r1i1p1f1, GISS-E2-1-G/r1i1p1f2, IPSL-CM6A-LR/r1i1p1f1, ACCESS-ESM1-5/r1i1p1f1, EC-Earth3/r1i1p1f1, CNRM-CM6-1/r1i1p1f2, AWI-CM-1-1-MR/r1i1p1f1, CNRM-ESM2-1/r1i1p1f2, INM-CM5-0/r1i1p1f1, MRI-ESM2-0/r1i1p1f1 |
| Reference Dataset | ERA5 |
| Units | m/s |
| Period | 1990–2014 |
| CMIP6 MMM | Global Mean Bias: 0.00 · Rmse: None |
| MPI-ESM1-2-LR/r1i1p1f1 | Global Mean Bias: 0.09 · Rmse: None |
| GISS-E2-1-G/r1i1p1f2 | Global Mean Bias: 0.10 · Rmse: None |
| IPSL-CM6A-LR/r1i1p1f1 | Global Mean Bias: -0.06 · Rmse: None |
| ACCESS-ESM1-5/r1i1p1f1 | Global Mean Bias: -0.15 · Rmse: None |
| EC-Earth3/r1i1p1f1 | Global Mean Bias: 0.03 · Rmse: None |
| CNRM-CM6-1/r1i1p1f2 | Global Mean Bias: 0.04 · Rmse: None |
| AWI-CM-1-1-MR/r1i1p1f1 | Global Mean Bias: 0.09 · Rmse: None |
| CNRM-ESM2-1/r1i1p1f2 | Global Mean Bias: 0.03 · Rmse: None |
| INM-CM5-0/r1i1p1f1 | Global Mean Bias: -0.06 · Rmse: None |
| MRI-ESM2-0/r1i1p1f1 | Global Mean Bias: -0.07 · Rmse: None |
Summary high
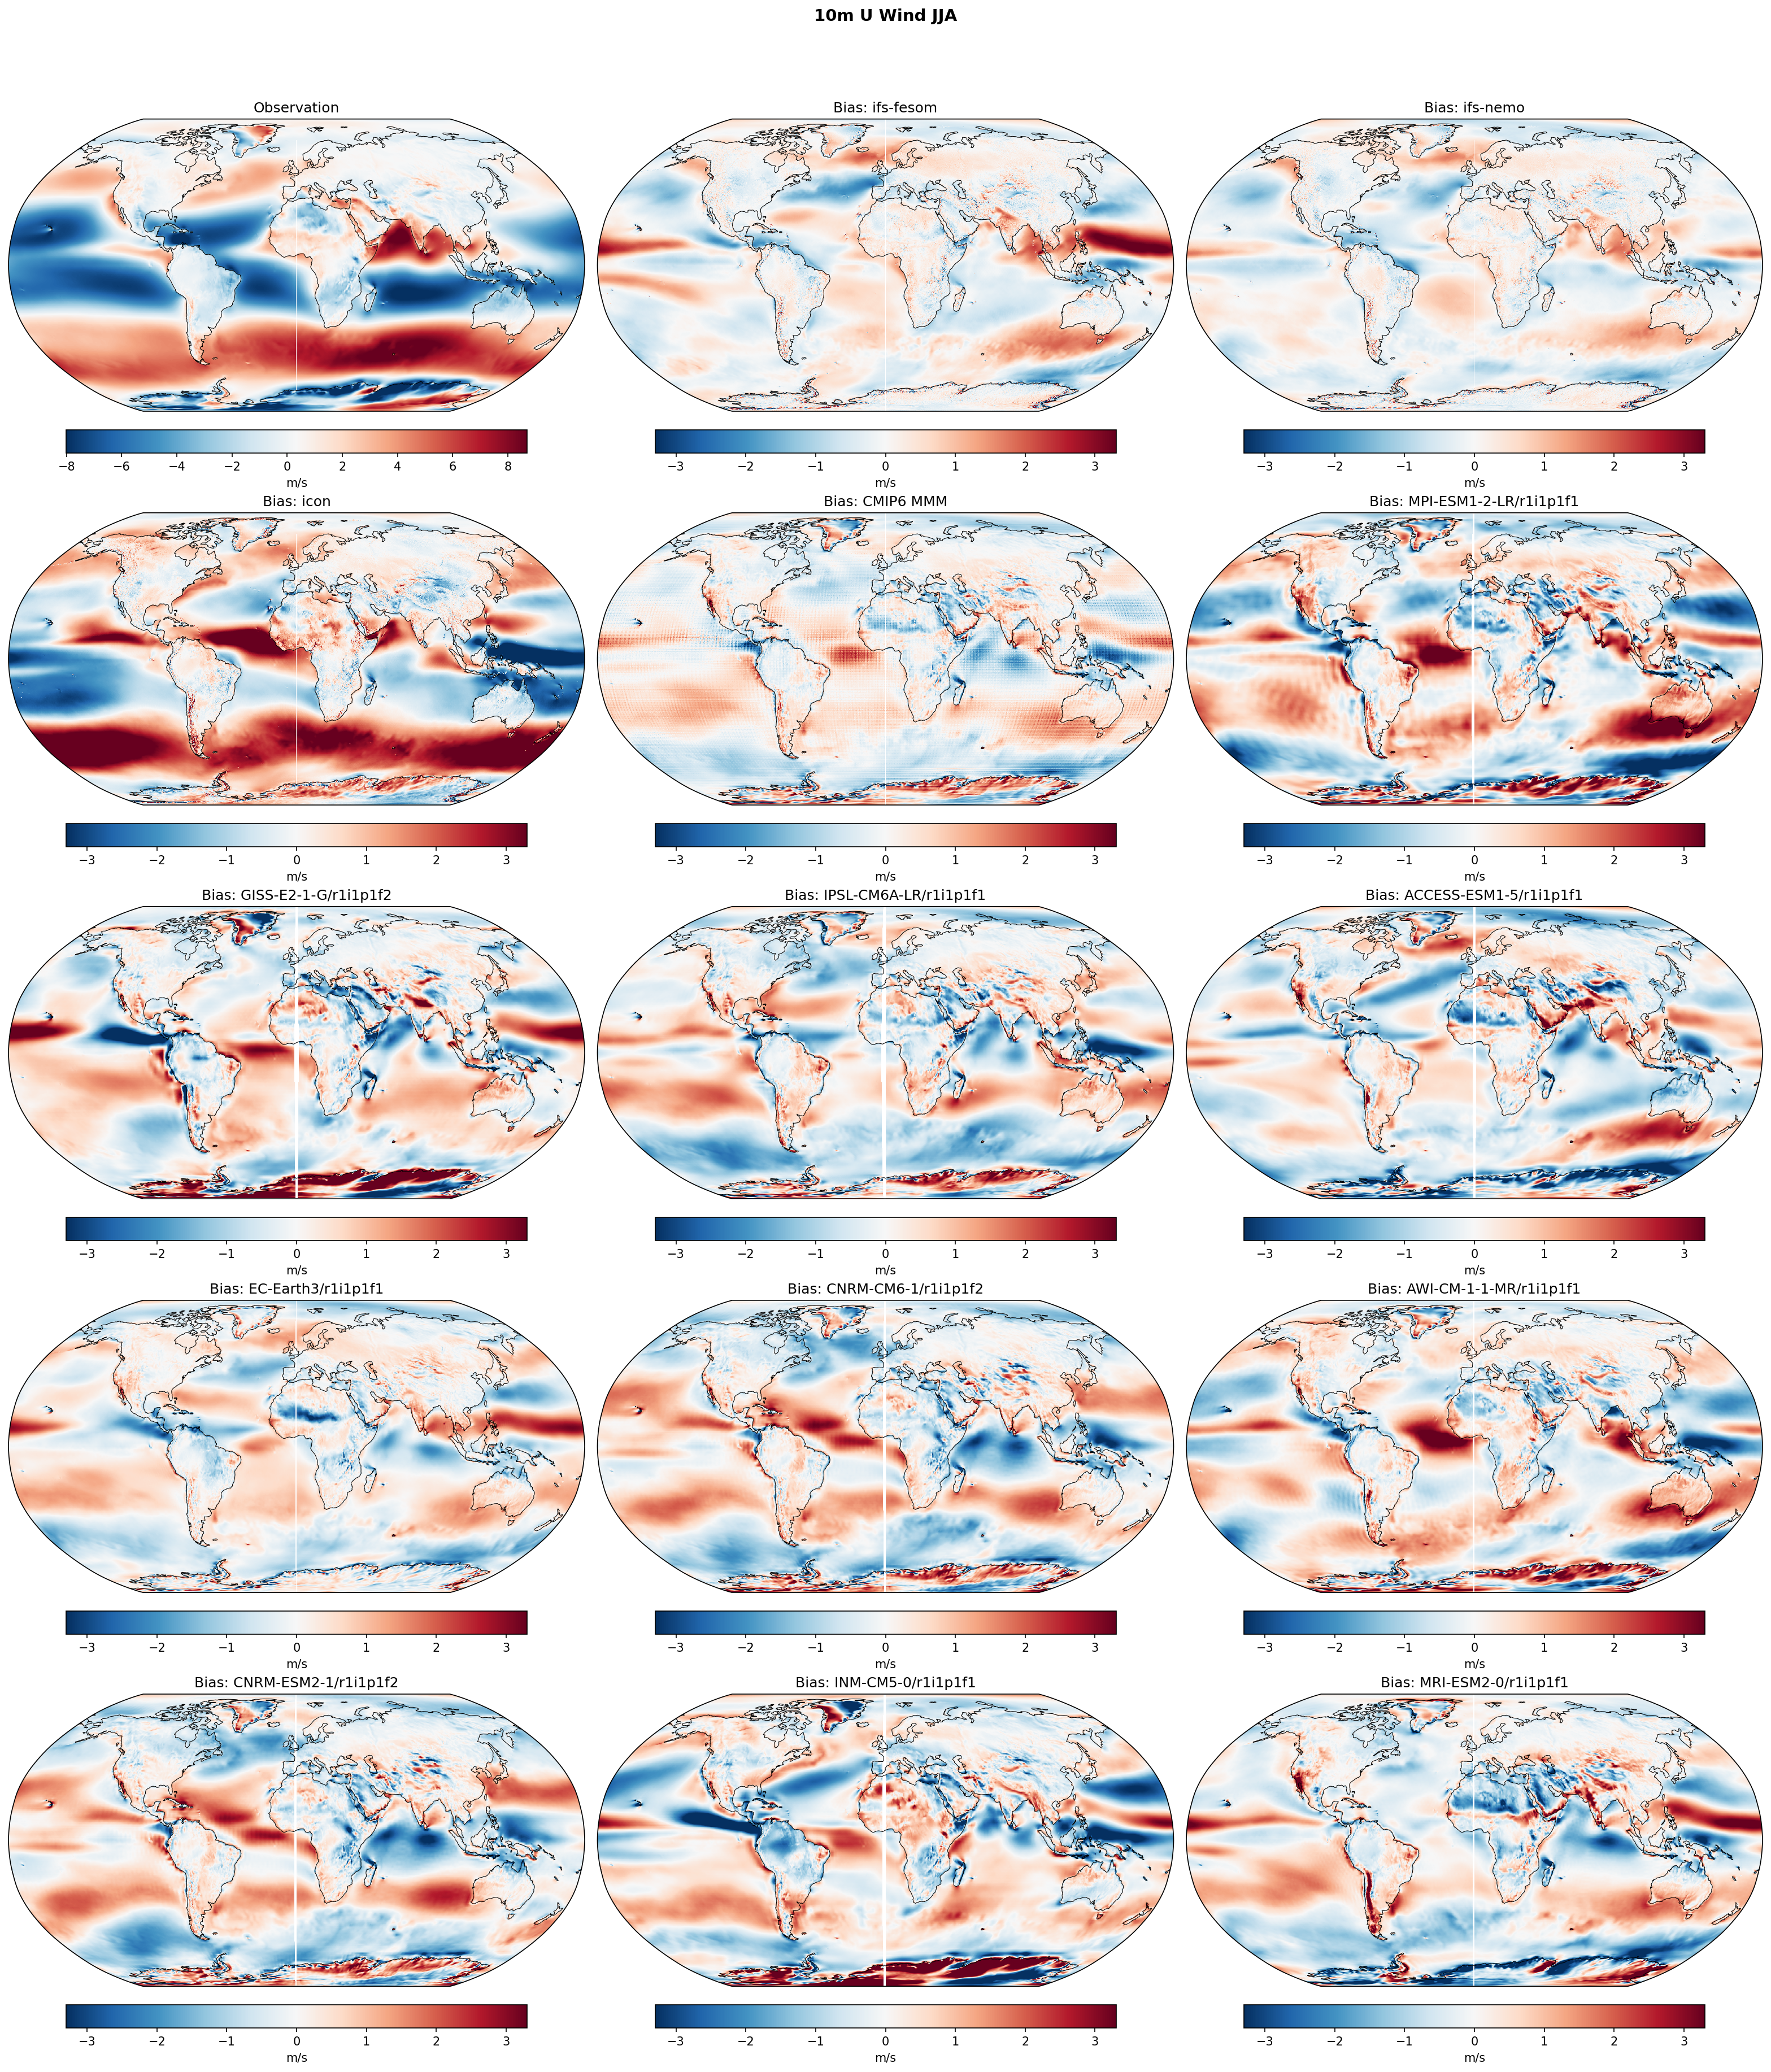
The figure displays bias maps of JJA 10m zonal wind (U wind) relative to ERA5 for three high-resolution DestinE models (IFS-FESOM, IFS-NEMO, ICON), the CMIP6 multi-model mean, and several individual CMIP6 models.
Key Findings
- IFS-FESOM and IFS-NEMO show moderate positive U-wind biases in the tropical Pacific and Atlantic, indicating an underestimation of the easterly trade winds.
- ICON exhibits severe systematic biases globally, with heavily overestimated trade winds (strong negative bias), an overestimated Southern Ocean westerly jet (strong positive bias), and a drastically underestimated Indian Summer Monsoon flow.
- IFS models exhibit a positively biased westerly flow in the Arabian Sea, suggesting an over-vigorous Indian summer monsoon circulation.
- Most models, including the high-resolution ones, display a dipole bias pattern in the Southern Ocean, reflecting persistent challenges in simulating the exact latitudinal position of the eddy-driven jet.
Spatial Patterns
Prominent spatial patterns include positive biases across the equatorial Pacific and Atlantic in the IFS and many CMIP6 models. In the Arabian Sea, the IFS models show strong positive biases (overly strong westerly monsoon flow), whereas ICON shows intense negative biases. In the Southern Ocean, dipole patterns (e.g., negative north, positive south) indicate a poleward shift of the westerly jet in many models.
Model Agreement
IFS-FESOM and IFS-NEMO agree closely with one another and perform on par with top-tier CMIP6 models, though the CMIP6 MMM exhibits the lowest overall bias due to error cancellation. ICON strongly diverges from all other models and observations, showing severe, basin-wide magnitude errors.
Physical Interpretation
Positive zonal wind biases in the tropical easterly regime (IFS models, many CMIP6) imply excessively weak trade winds, often linked to an underestimated Walker circulation or misrepresentation of boundary layer momentum mixing. ICON's strong negative tropical biases indicate overly intense trade winds. Dipole biases in the Southern Ocean represent shifts in the mid-latitude eddy-driven jet, which are highly sensitive to resolved baroclinic eddies, surface friction, and sea ice extent. The Arabian Sea biases reflect model sensitivities in capturing the cross-equatorial Somali jet during the JJA monsoon.
Caveats
- The severe, widespread biases in the ICON simulation suggest a structural or tuning issue in this specific configuration, which may obscure the potential benefits of its high resolution.
- ERA5 reanalysis surface winds contain their own uncertainties, particularly over the data-sparse Southern Ocean, where satellite scatterometer data assimilation is critical.
10m V Wind Annual Mean Bias
| Variables | avg_10v |
|---|---|
| Models | ifs-fesom, ifs-nemo, icon, CMIP6 MMM, MPI-ESM1-2-LR/r1i1p1f1, GISS-E2-1-G/r1i1p1f2, IPSL-CM6A-LR/r1i1p1f1, ACCESS-ESM1-5/r1i1p1f1, EC-Earth3/r1i1p1f1, CNRM-CM6-1/r1i1p1f2, AWI-CM-1-1-MR/r1i1p1f1, CNRM-ESM2-1/r1i1p1f2, INM-CM5-0/r1i1p1f1, MRI-ESM2-0/r1i1p1f1 |
| Reference Dataset | ERA5 |
| Units | m/s |
| Period | 1990–2014 |
| ifs-fesom | Global Mean Bias: -0.00 · Rmse: 0.50 |
| ifs-nemo | Global Mean Bias: 0.07 · Rmse: 0.41 |
| icon | Global Mean Bias: -0.07 · Rmse: 0.82 |
| CMIP6 MMM | Global Mean Bias: -0.05 · Rmse: 0.54 |
| MPI-ESM1-2-LR/r1i1p1f1 | Global Mean Bias: -0.01 · Rmse: 0.78 |
| GISS-E2-1-G/r1i1p1f2 | Global Mean Bias: -0.11 · Rmse: 0.98 |
| IPSL-CM6A-LR/r1i1p1f1 | Global Mean Bias: 0.01 · Rmse: 0.71 |
| ACCESS-ESM1-5/r1i1p1f1 | Global Mean Bias: -0.08 · Rmse: 0.73 |
| EC-Earth3/r1i1p1f1 | Global Mean Bias: -0.09 · Rmse: 0.53 |
| CNRM-CM6-1/r1i1p1f2 | Global Mean Bias: -0.06 · Rmse: 0.66 |
| AWI-CM-1-1-MR/r1i1p1f1 | Global Mean Bias: 0.00 · Rmse: 0.67 |
| CNRM-ESM2-1/r1i1p1f2 | Global Mean Bias: -0.06 · Rmse: 0.67 |
| INM-CM5-0/r1i1p1f1 | Global Mean Bias: -0.06 · Rmse: 0.89 |
| MRI-ESM2-0/r1i1p1f1 | Global Mean Bias: -0.04 · Rmse: 0.92 |
Summary high
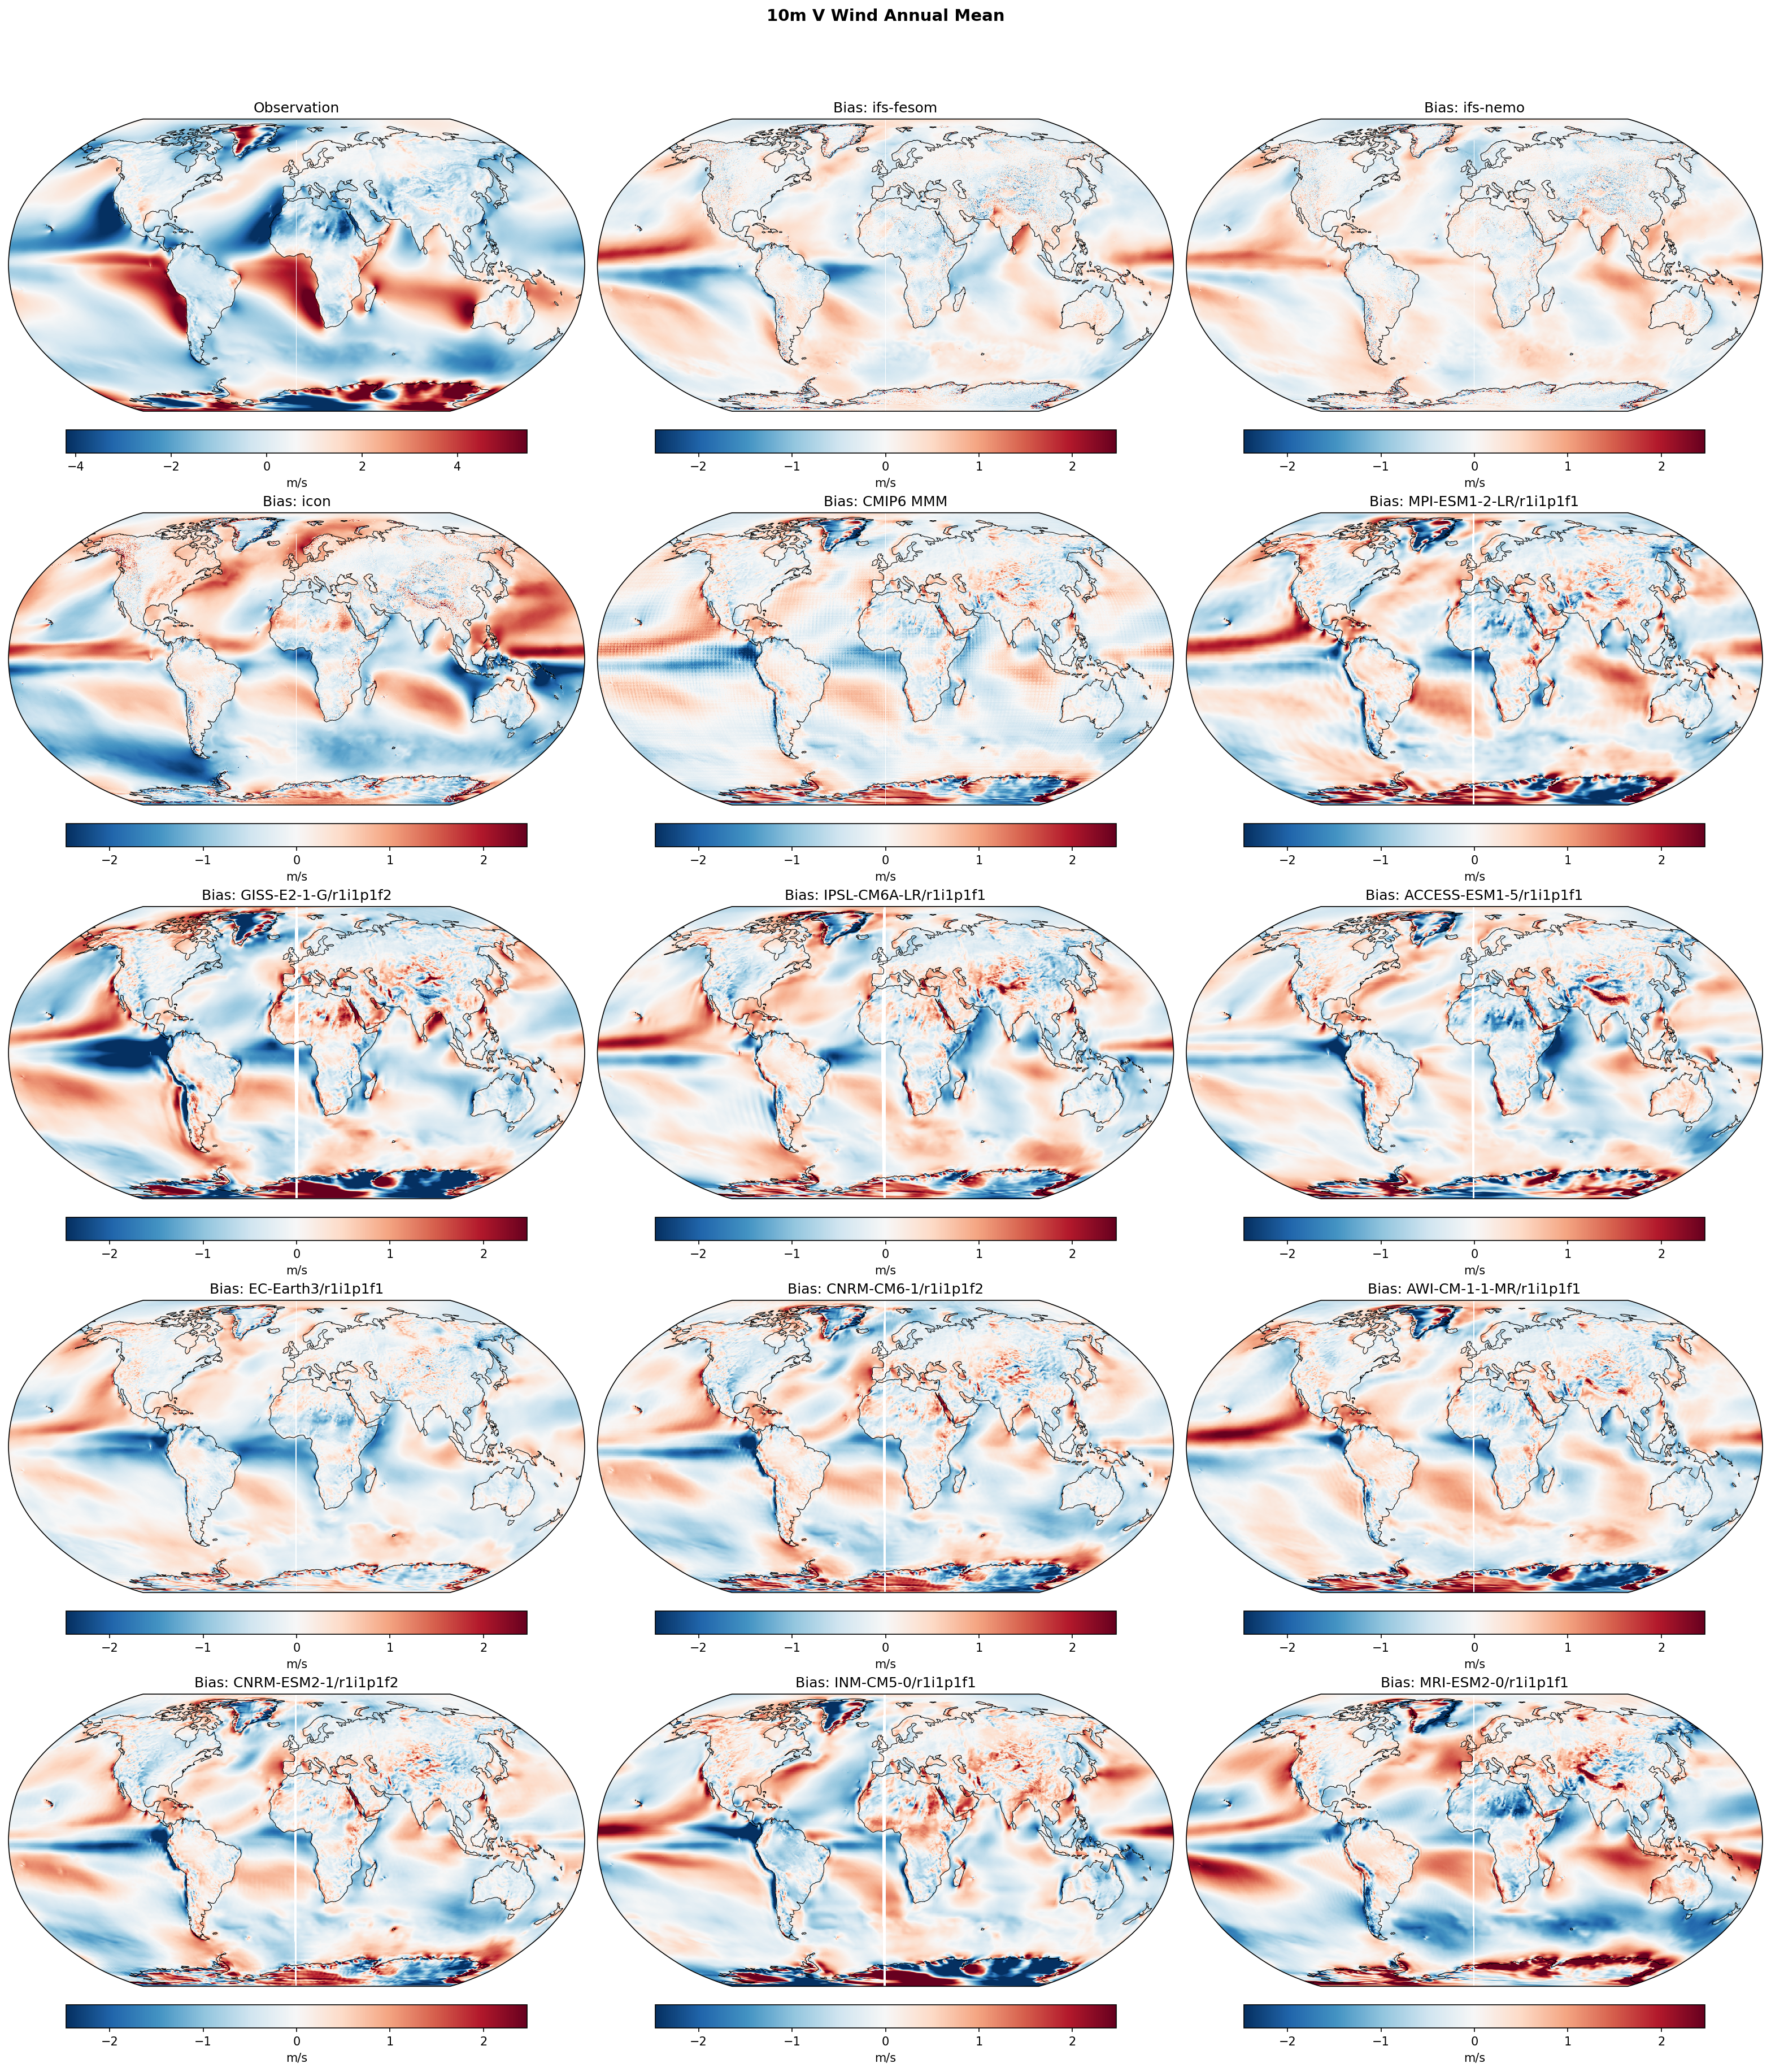
The figure presents annual mean bias maps for 10m meridional (V) wind compared to ERA5, highlighting the exceptional performance of IFS-based high-resolution models and significant systematic errors in ICON and several CMIP6 models.
Key Findings
- IFS-NEMO and IFS-FESOM achieve the lowest global RMSE (0.39 and 0.48 m/s, respectively), significantly outperforming the CMIP6 multi-model mean and demonstrating the value of their configurations.
- ICON exhibits severe regional biases (RMSE 0.80 m/s), notably underestimating the northward Somali jet in the Indian Ocean and distorting trade winds in the Pacific and Atlantic.
- Standard CMIP6 models systematically struggle with tropical meridional flow, commonly exhibiting dipole biases across the equator related to ITCZ misplacement.
Spatial Patterns
In the Indian Ocean, a strong negative (blue) bias off the Horn of Africa in ICON and CMIP6 models like GISS and MRI indicates a suppressed northward Somali jet. In the eastern tropical Pacific and Atlantic, prominent dipole biases are common in CMIP6 models and ICON, reflecting misplaced or overly diffuse ITCZ convergence. Conversely, IFS-FESOM and IFS-NEMO show near-zero biases in these highly dynamic tropical regions. Strong, alternating bias bands in the Southern Ocean are evident in ICON, INM, and MRI, but are notably absent in the IFS models.
Model Agreement
IFS-FESOM and IFS-NEMO show excellent agreement with ERA5 and with each other. ICON diverges significantly from the other DestinE models, exhibiting higher RMSE and sharing large-scale structural biases with lower-performing CMIP6 models (e.g., GISS-E2-1-G and MRI-ESM2-0). EC-Earth3 stands out as the best-performing CMIP6 model, approaching the accuracy of the IFS models.
Physical Interpretation
Accurate 10m meridional winds depend heavily on resolving narrow convergence zones (ITCZ), boundary layer dynamics, and coastal topography. The superior performance of IFS models suggests a more accurate coupling and representation of the Hadley circulation. The severe negative bias in the Arabian Sea seen in ICON and some CMIP6 models reflects a failure to capture the strong, topographically-guided Somali Low-Level Jet, which requires accurate resolution of the East African highlands and land-sea thermal contrasts.
Caveats
- Annual mean diagnostics obscure seasonal extremes, potentially masking compensating errors in highly seasonal regimes like the Asian monsoon.
- ERA5 10m winds over open oceans are an assimilation product and may contain intrinsic model biases, although they are heavily constrained by satellite scatterometry.
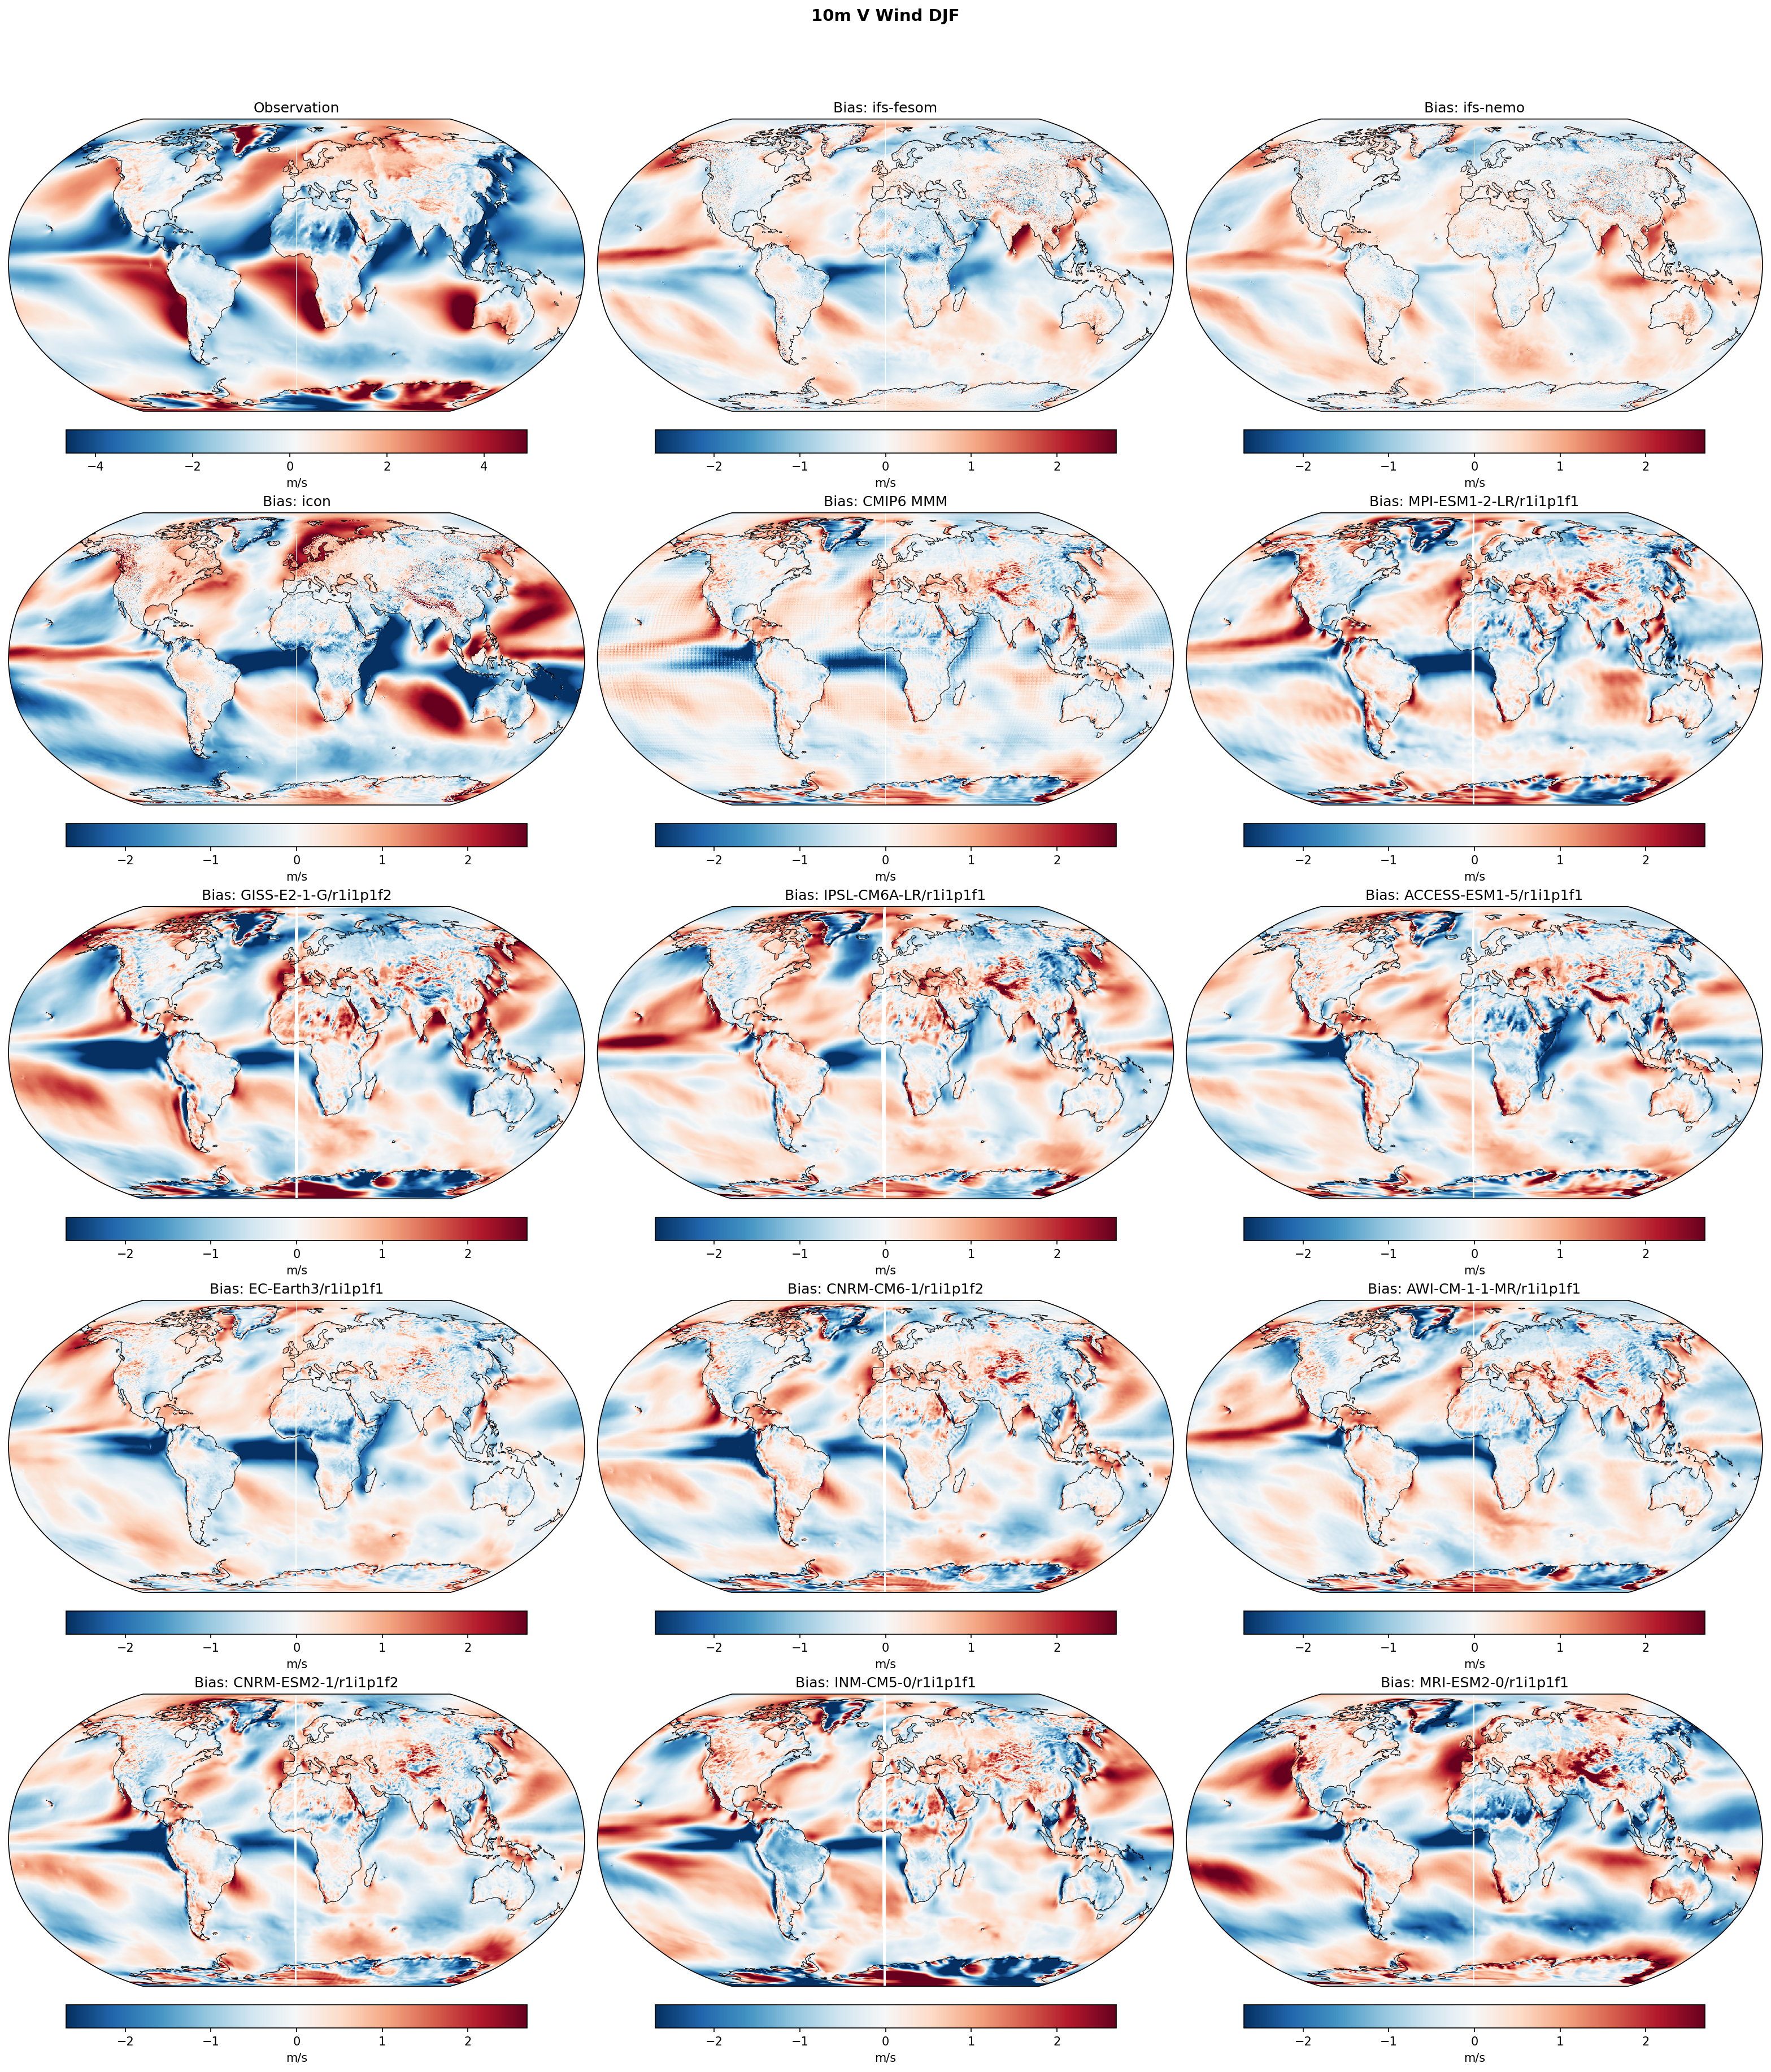
10m V Wind DJF Bias
| Variables | avg_10v |
|---|---|
| Models | ifs-fesom, ifs-nemo, icon, CMIP6 MMM, MPI-ESM1-2-LR/r1i1p1f1, GISS-E2-1-G/r1i1p1f2, IPSL-CM6A-LR/r1i1p1f1, ACCESS-ESM1-5/r1i1p1f1, EC-Earth3/r1i1p1f1, CNRM-CM6-1/r1i1p1f2, AWI-CM-1-1-MR/r1i1p1f1, CNRM-ESM2-1/r1i1p1f2, INM-CM5-0/r1i1p1f1, MRI-ESM2-0/r1i1p1f1 |
| Reference Dataset | ERA5 |
| Units | m/s |
| Period | 1990–2014 |
| CMIP6 MMM | Global Mean Bias: -0.07 · Rmse: None |
| MPI-ESM1-2-LR/r1i1p1f1 | Global Mean Bias: -0.08 · Rmse: None |
| GISS-E2-1-G/r1i1p1f2 | Global Mean Bias: -0.09 · Rmse: None |
| IPSL-CM6A-LR/r1i1p1f1 | Global Mean Bias: 0.09 · Rmse: None |
| ACCESS-ESM1-5/r1i1p1f1 | Global Mean Bias: -0.06 · Rmse: None |
| EC-Earth3/r1i1p1f1 | Global Mean Bias: -0.12 · Rmse: None |
| CNRM-CM6-1/r1i1p1f2 | Global Mean Bias: -0.07 · Rmse: None |
| AWI-CM-1-1-MR/r1i1p1f1 | Global Mean Bias: -0.07 · Rmse: None |
| CNRM-ESM2-1/r1i1p1f2 | Global Mean Bias: -0.08 · Rmse: None |
| INM-CM5-0/r1i1p1f1 | Global Mean Bias: 0.00 · Rmse: None |
| MRI-ESM2-0/r1i1p1f1 | Global Mean Bias: -0.09 · Rmse: None |
Summary high
This figure evaluates the DJF climatological mean biases of 10m meridional wind (V wind) in three high-resolution DestinE models (IFS-FESOM, IFS-NEMO, ICON) and several CMIP6 models relative to ERA5 reanalysis.
Key Findings
- ICON exhibits extreme, large-scale biases across the tropics and subtropics, most notably a severe positive bias in the Indian Ocean that completely misses the winter monsoon cross-equatorial flow.
- IFS-FESOM and IFS-NEMO perform well, displaying bias magnitudes and spatial patterns comparable to the best-performing CMIP6 models and the CMIP6 multi-model mean.
- CMIP6 models show characteristic regional biases, such as latitudinal shifts in the Southern Hemisphere westerlies and errors in eastern boundary upwelling zones, but broadly capture the observed large-scale meridional circulation.
Spatial Patterns
Observations show characteristic trade wind structures, with northerly flow (negative/blue) in the Northern Hemisphere trades and the Indian Ocean winter monsoon, and southerly flow (positive/red) in the Southern Hemisphere trades. The IFS models show minor overly northerly biases in the central equatorial Pacific. ICON displays a massive positive (southerly) bias in the Indian Ocean and equatorial Atlantic, and strong negative biases in the eastern Pacific and southern Indian Ocean, saturating the color bar over vast areas.
Model Agreement
IFS-FESOM and IFS-NEMO show high inter-model agreement and generally align with the behavior of the CMIP6 ensemble. In stark contrast, ICON is an extreme outlier, diverging fundamentally from both the observations and all other evaluated models.
Physical Interpretation
The extreme biases in ICON indicate a severe breakdown in the simulation of the Hadley circulation, the trade winds, and the Asian winter monsoon. The positive bias in the Indian Ocean suggests a failure to capture the strong northerly cross-equatorial monsoon flow. In the IFS and CMIP6 models, the banded bias structures in the Southern Ocean likely reflect common model errors in the latitudinal positioning and strength of the eddy-driven mid-latitude jet.
Caveats
- The extreme magnitude of ICON's biases suggests a potential systemic issue with this specific simulation run (e.g., severe ITCZ lock-in, tuning issues, or short spin-up) rather than a fundamental limitation of high-resolution modeling.
- Global mean bias statistics may obscure the severity of spatial errors in models like ICON due to the cancellation of massive positive and negative regional biases.
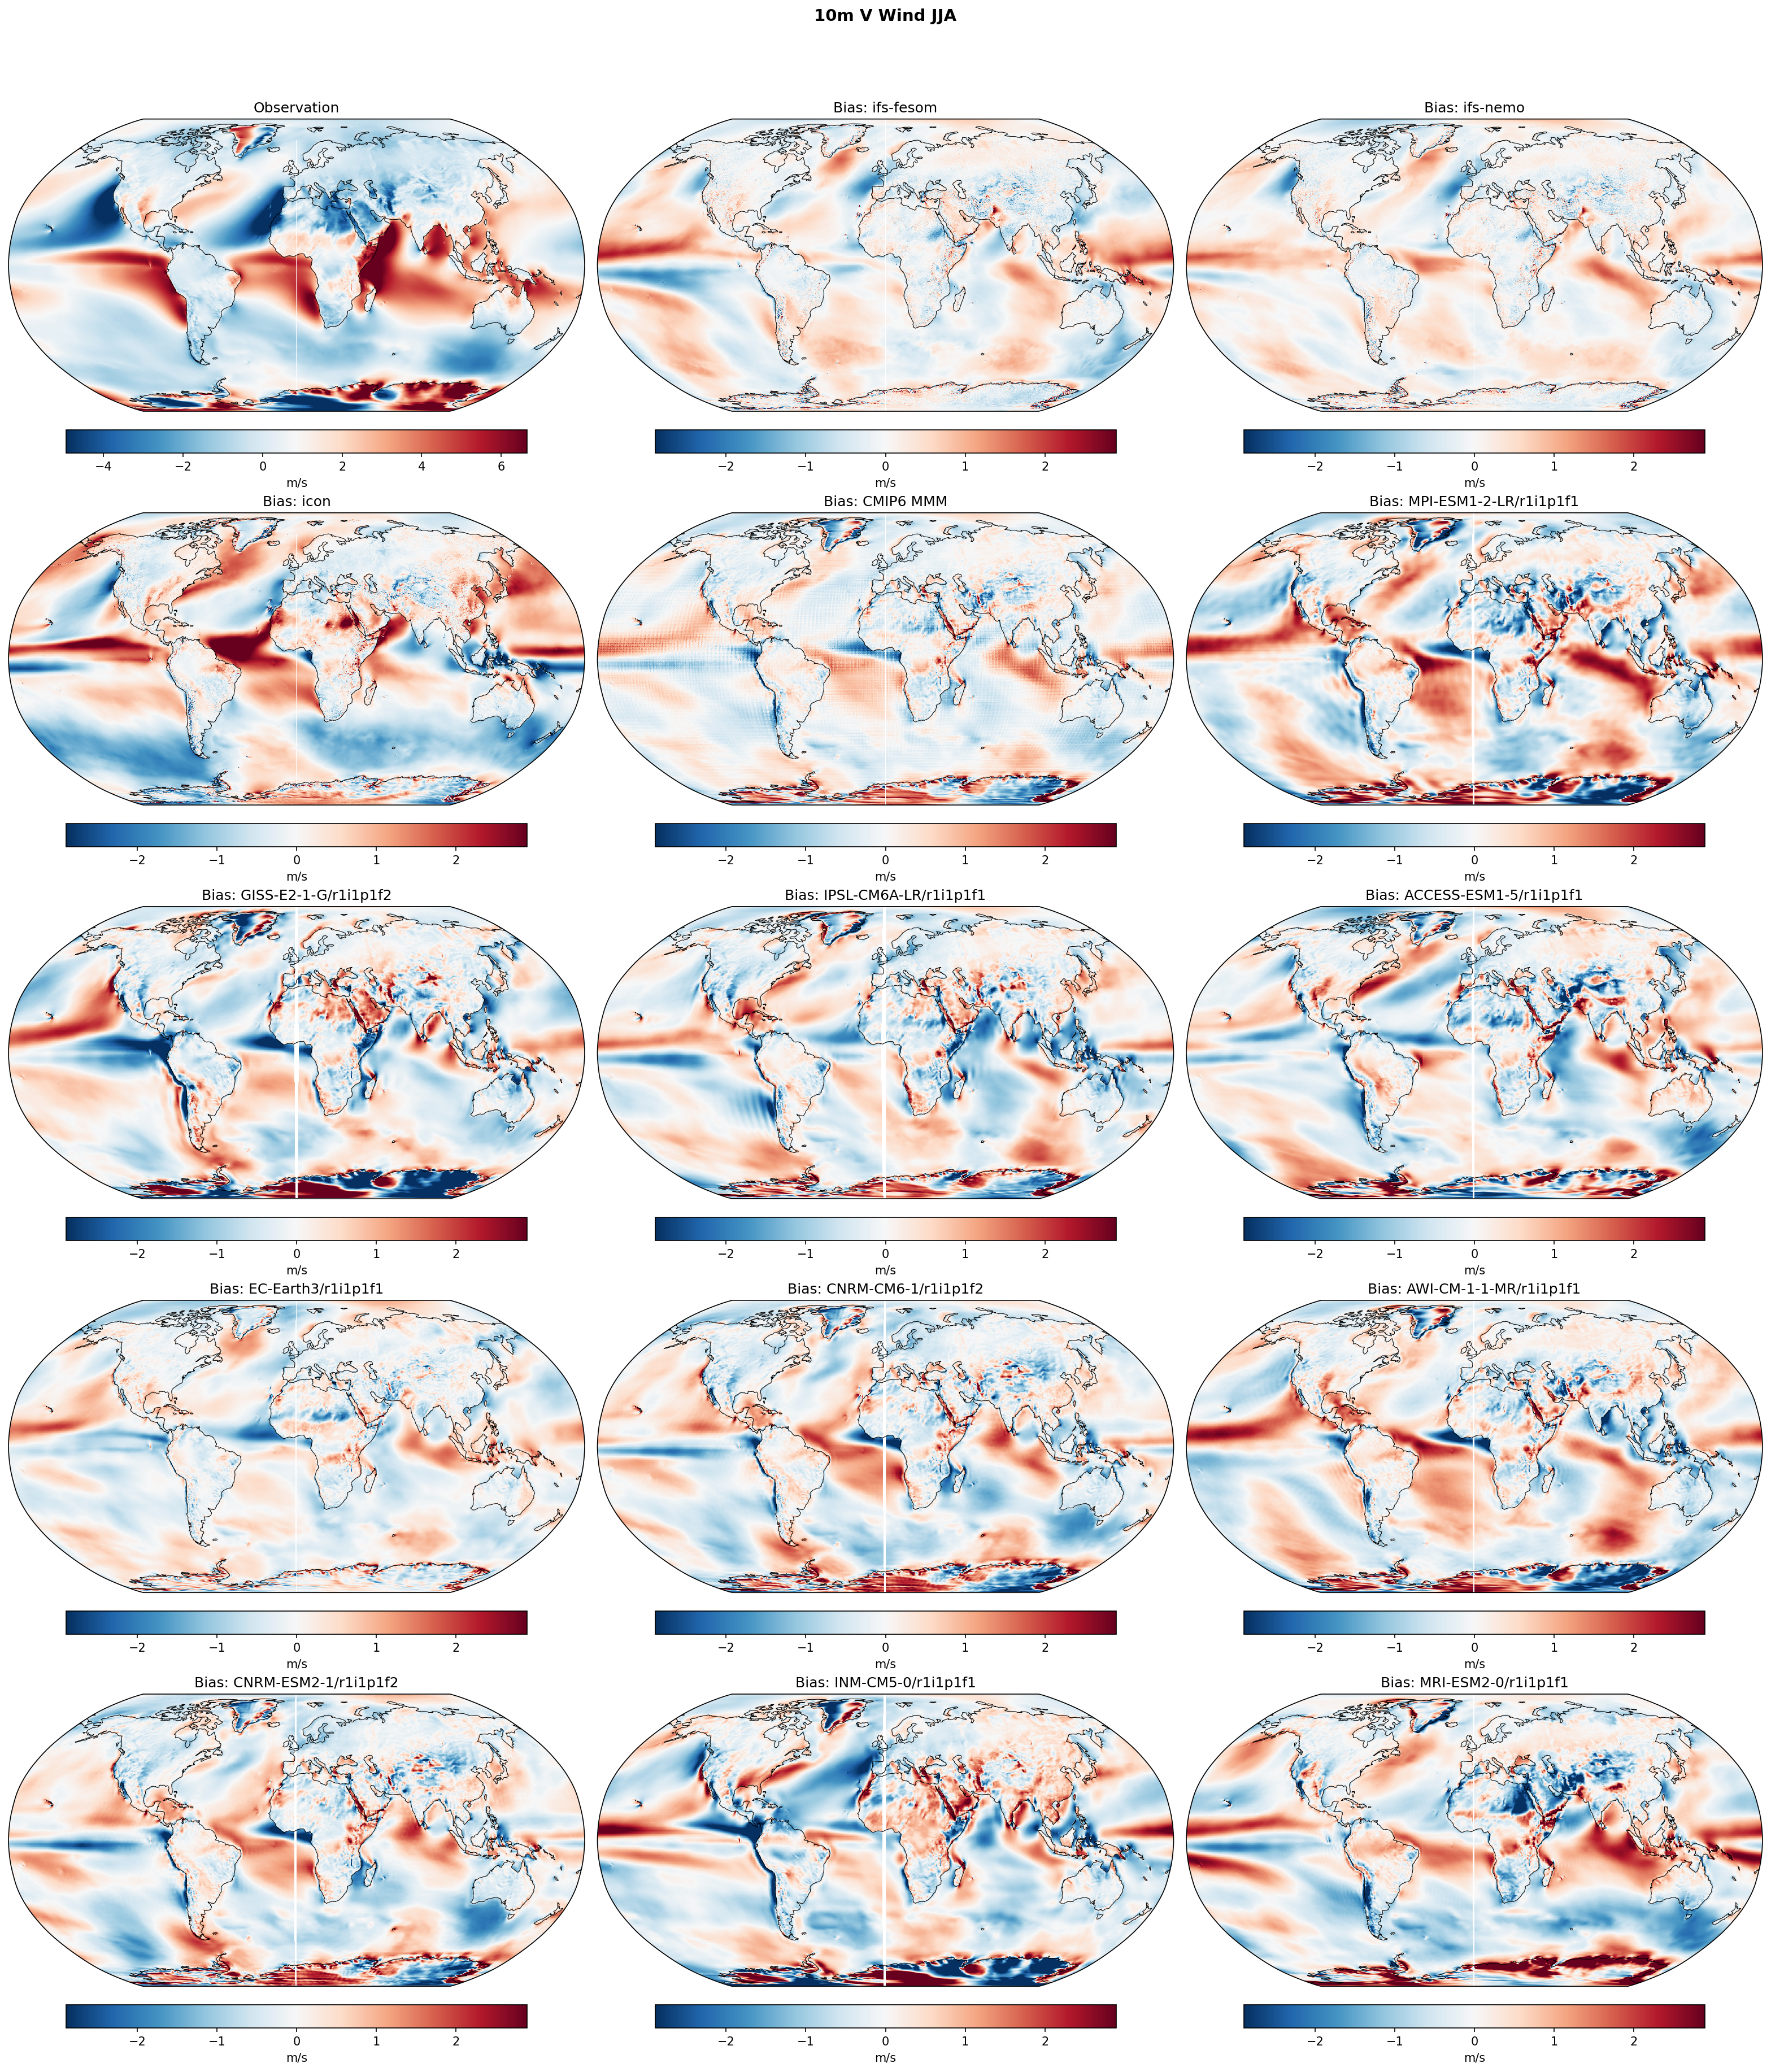
10m V Wind JJA Bias
| Variables | avg_10v |
|---|---|
| Models | ifs-fesom, ifs-nemo, icon, CMIP6 MMM, MPI-ESM1-2-LR/r1i1p1f1, GISS-E2-1-G/r1i1p1f2, IPSL-CM6A-LR/r1i1p1f1, ACCESS-ESM1-5/r1i1p1f1, EC-Earth3/r1i1p1f1, CNRM-CM6-1/r1i1p1f2, AWI-CM-1-1-MR/r1i1p1f1, CNRM-ESM2-1/r1i1p1f2, INM-CM5-0/r1i1p1f1, MRI-ESM2-0/r1i1p1f1 |
| Reference Dataset | ERA5 |
| Units | m/s |
| Period | 1990–2014 |
| CMIP6 MMM | Global Mean Bias: -0.02 · Rmse: None |
| MPI-ESM1-2-LR/r1i1p1f1 | Global Mean Bias: 0.09 · Rmse: None |
| GISS-E2-1-G/r1i1p1f2 | Global Mean Bias: -0.12 · Rmse: None |
| IPSL-CM6A-LR/r1i1p1f1 | Global Mean Bias: -0.06 · Rmse: None |
| ACCESS-ESM1-5/r1i1p1f1 | Global Mean Bias: -0.07 · Rmse: None |
| EC-Earth3/r1i1p1f1 | Global Mean Bias: -0.03 · Rmse: None |
| CNRM-CM6-1/r1i1p1f2 | Global Mean Bias: -0.03 · Rmse: None |
| AWI-CM-1-1-MR/r1i1p1f1 | Global Mean Bias: 0.07 · Rmse: None |
| CNRM-ESM2-1/r1i1p1f2 | Global Mean Bias: -0.03 · Rmse: None |
| INM-CM5-0/r1i1p1f1 | Global Mean Bias: -0.12 · Rmse: None |
| MRI-ESM2-0/r1i1p1f1 | Global Mean Bias: 0.03 · Rmse: None |
Summary high
This figure evaluates global biases in June-July-August (JJA) 10m meridional (V) wind climatology across high-resolution DestinE models (IFS-FESOM, IFS-NEMO, ICON) and CMIP6 models relative to ERA5.
Key Findings
- The ICON model exhibits severe, anomalously large biases globally, most notably a massive positive V-wind bias across the equatorial Pacific and Atlantic, indicating fundamental errors in trade wind convergence and ITCZ representation.
- Almost all models, including the high-resolution DestinE suite and the CMIP6 MMM, show a strong negative bias over the Arabian Sea and Indian Ocean, reflecting a systematic underestimation of the Somali jet and the Asian summer monsoon cross-equatorial flow.
- IFS-FESOM and IFS-NEMO show highly similar bias spatial patterns to each other and generally resemble the CMIP6 MMM, demonstrating that ~5 km resolution alone does not eliminate large-scale systematic circulation biases.
Spatial Patterns
Observations (ERA5) highlight the strong southerly Somali jet in the Indian Ocean, trade wind convergence in the tropics, and northerly flow along the western coasts of the Americas and Africa. Bias maps reveal a ubiquitous negative anomaly in the Indian Ocean. A striking, continuous band of positive bias spans the equatorial Pacific and Atlantic in ICON (>2 m/s), while IFS models show a weaker, more confined positive bias in the eastern equatorial Pacific. The Southern Ocean exhibits alternating wave-like bias structures that vary significantly among individual models.
Model Agreement
There is a stark divergence between ICON and the IFS-based DestinE models, with ICON performing significantly worse in capturing the large-scale V-wind climatology. IFS-FESOM and IFS-NEMO exhibit strong inter-model agreement and share broad regional bias patterns with the CMIP6 MMM (e.g., the weakened Somali jet). Individual CMIP6 models show wide spread in the tropics and mid-latitudes, though the Indian Ocean negative bias is highly consistent.
Physical Interpretation
The pervasive negative bias in the Indian Ocean indicates that both traditional and storm-resolving models struggle to simulate the full strength of the low-level cross-equatorial Somali jet, likely due to representation of regional topography (e.g., East African Highlands) or land-sea thermal contrasts driving the monsoon. ICON's extreme positive equatorial biases strongly point to an overly northward displaced or overly diffuse Intertropical Convergence Zone (ITCZ), failing to correctly capture the convergence of the northeast and southeast trade winds. Positive biases along the eastern ocean basins suggest models underestimate the northerly flow on the eastern flanks of the subtropical anticyclones.
Caveats
- ERA5 10m wind fields contain their own uncertainties, particularly over the data-sparse Southern Ocean and within complex tropical convective systems, which may alias into apparent model biases.
- The extreme biases in the ICON model suggest a potential structural or tuning issue specific to this configuration rather than a fundamental limitation of high-resolution modeling.
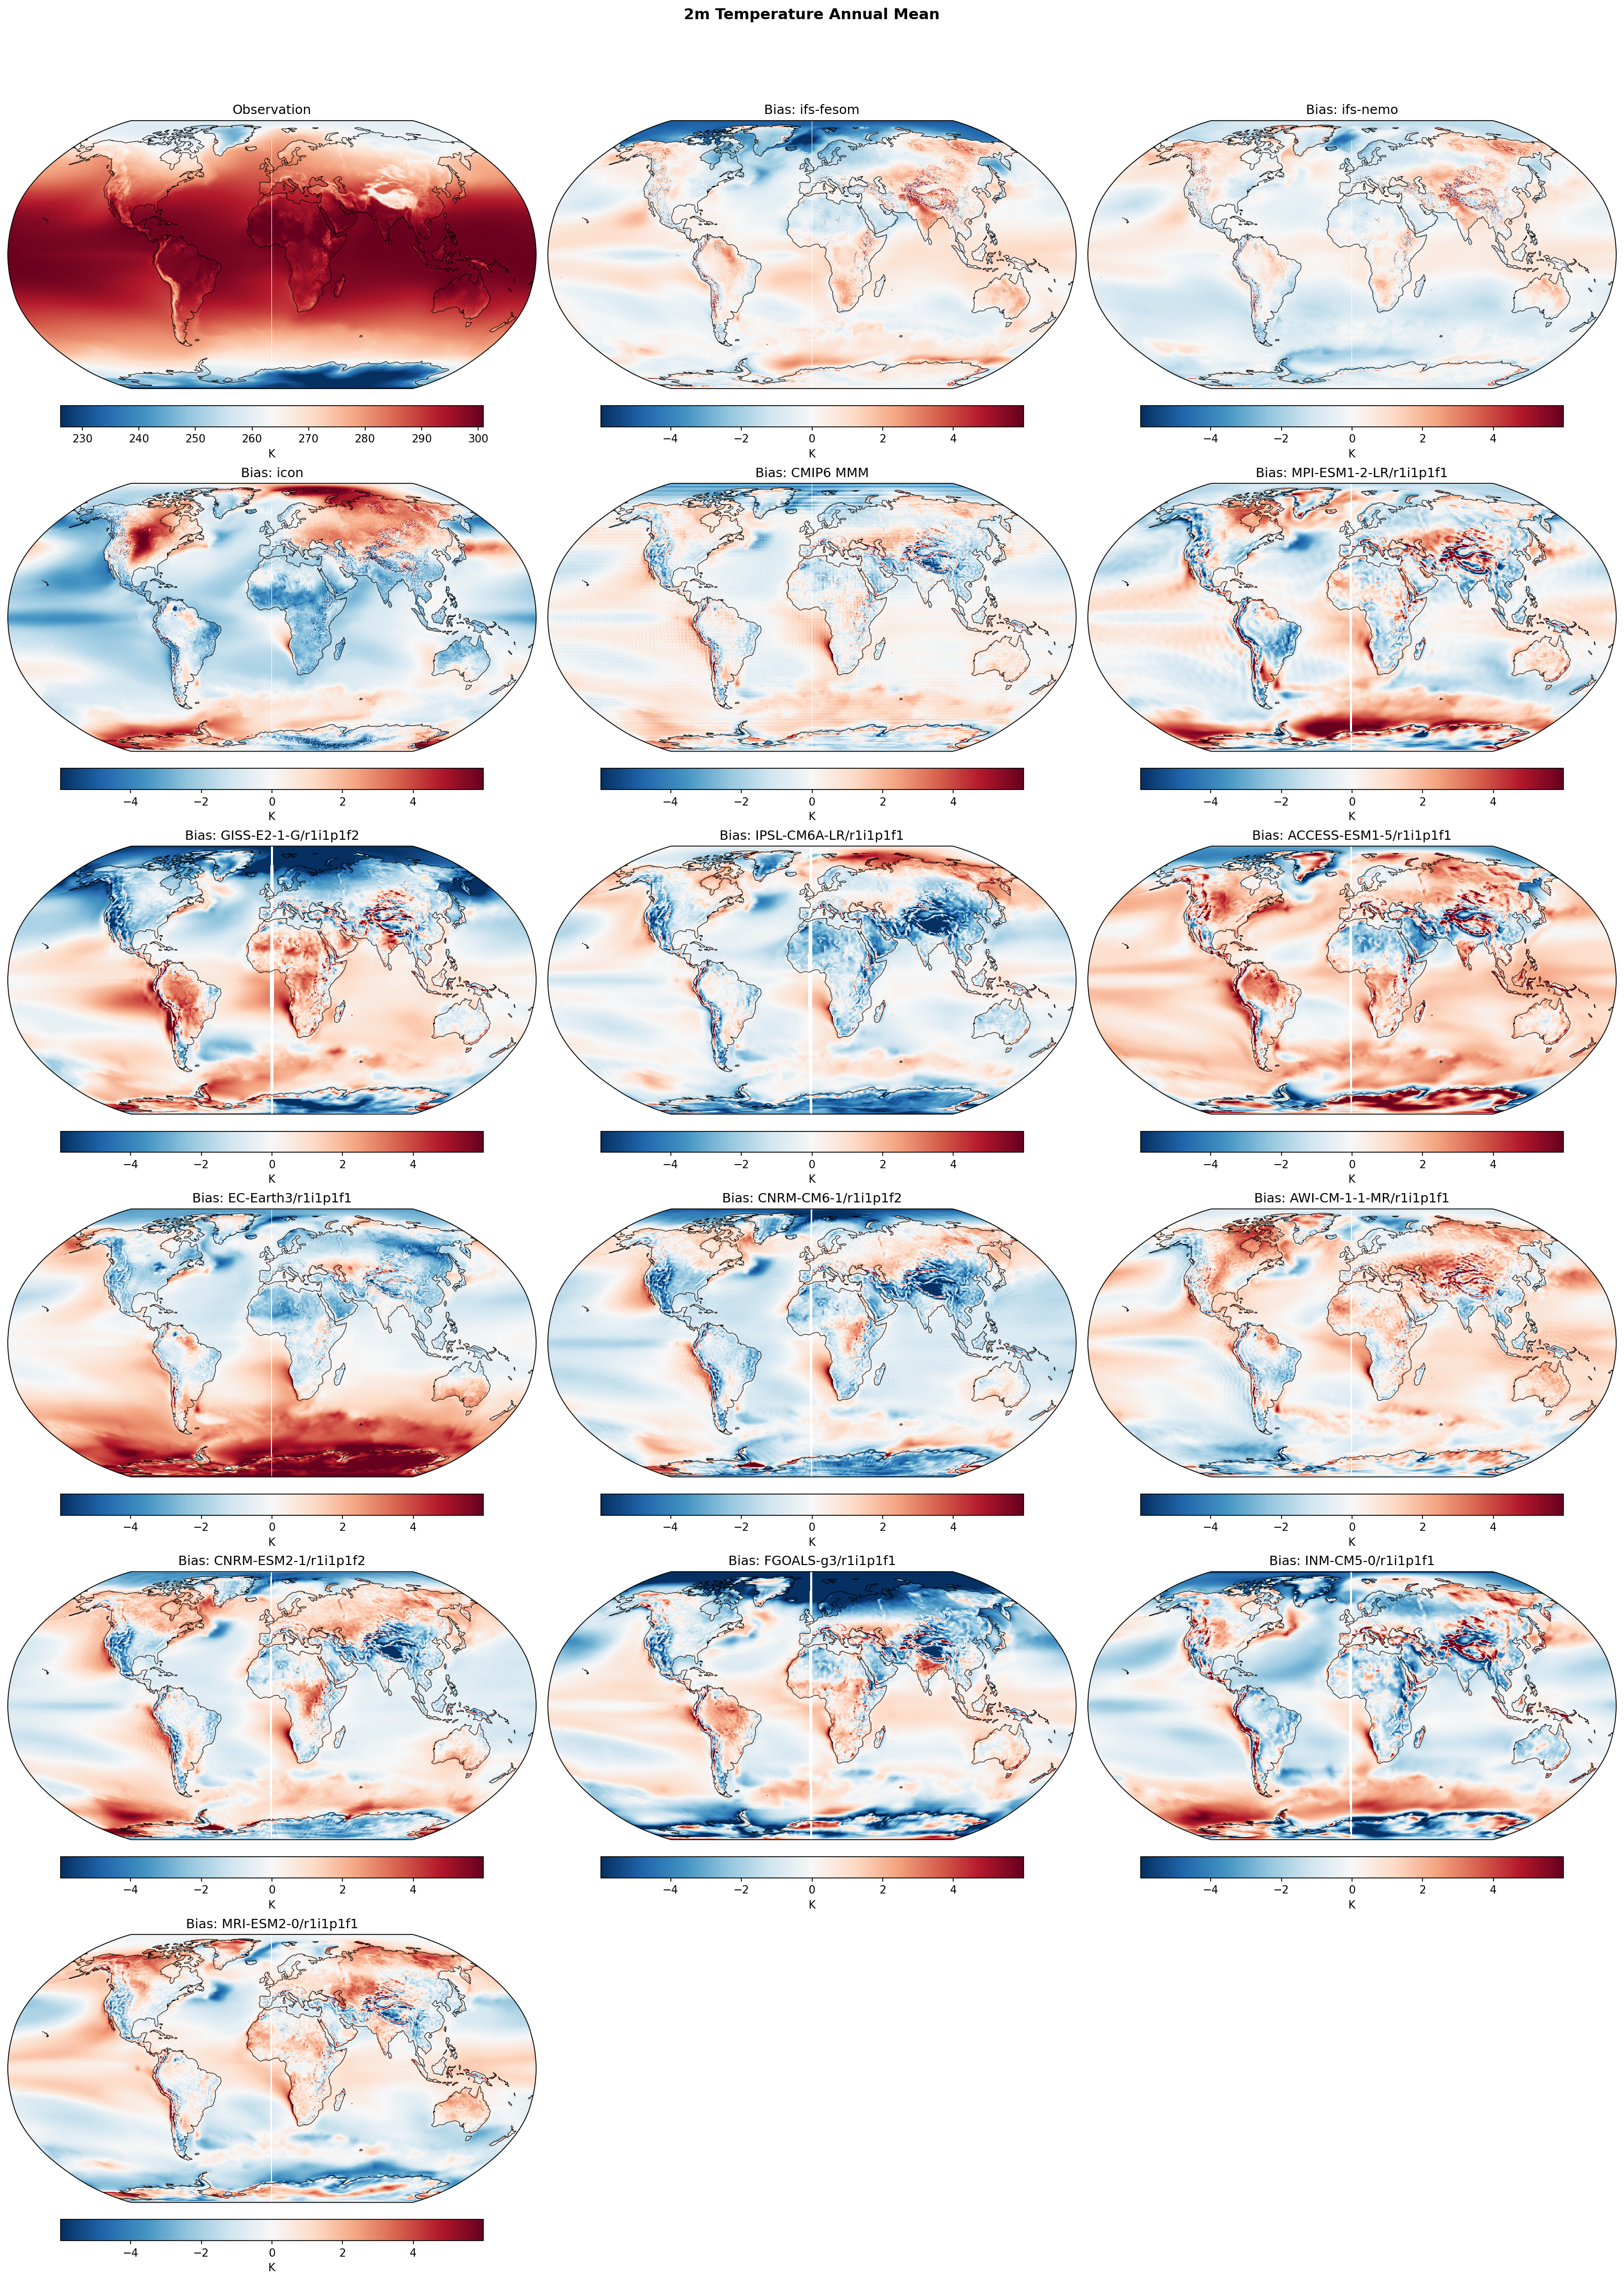
2m Temperature Annual Mean Bias
| Variables | avg_2t |
|---|---|
| Models | ifs-fesom, ifs-nemo, icon, CMIP6 MMM, MPI-ESM1-2-LR/r1i1p1f1, GISS-E2-1-G/r1i1p1f2, IPSL-CM6A-LR/r1i1p1f1, ACCESS-ESM1-5/r1i1p1f1, EC-Earth3/r1i1p1f1, CNRM-CM6-1/r1i1p1f2, AWI-CM-1-1-MR/r1i1p1f1, CNRM-ESM2-1/r1i1p1f2, FGOALS-g3/r1i1p1f1, INM-CM5-0/r1i1p1f1, MRI-ESM2-0/r1i1p1f1 |
| Reference Dataset | ERA5 |
| Units | K |
| Period | 1990–2014 |
| ifs-fesom | Global Mean Bias: 0.14 · Rmse: 1.22 |
| ifs-nemo | Global Mean Bias: -0.10 · Rmse: 0.96 |
| icon | Global Mean Bias: -0.70 · Rmse: 1.94 |
| CMIP6 MMM | Global Mean Bias: 0.08 · Rmse: 1.10 |
| MPI-ESM1-2-LR/r1i1p1f1 | Global Mean Bias: 0.14 · Rmse: 1.81 |
| GISS-E2-1-G/r1i1p1f2 | Global Mean Bias: 0.00 · Rmse: 2.30 |
| IPSL-CM6A-LR/r1i1p1f1 | Global Mean Bias: -0.40 · Rmse: 1.74 |
| ACCESS-ESM1-5/r1i1p1f1 | Global Mean Bias: 0.91 · Rmse: 1.97 |
| EC-Earth3/r1i1p1f1 | Global Mean Bias: 0.47 · Rmse: 2.07 |
| CNRM-CM6-1/r1i1p1f2 | Global Mean Bias: -0.58 · Rmse: 1.74 |
| AWI-CM-1-1-MR/r1i1p1f1 | Global Mean Bias: 0.48 · Rmse: 1.44 |
| CNRM-ESM2-1/r1i1p1f2 | Global Mean Bias: 0.06 · Rmse: 1.68 |
| FGOALS-g3/r1i1p1f1 | Global Mean Bias: -0.48 · Rmse: 2.55 |
| INM-CM5-0/r1i1p1f1 | Global Mean Bias: -0.33 · Rmse: 1.96 |
| MRI-ESM2-0/r1i1p1f1 | Global Mean Bias: 0.15 · Rmse: 1.46 |
Summary high
This figure presents spatial bias maps of the annual mean 2m temperature relative to ERA5 (1990-2014) for three high-resolution DestinE models, the CMIP6 multi-model mean, and several individual CMIP6 models.
Key Findings
- IFS-NEMO demonstrates the highest spatial fidelity with an RMSE of 0.92 K, outperforming all individual CMIP6 models and the CMIP6 multi-model mean.
- ICON displays a pervasive systematic cold bias (-0.76 K global mean), which is most pronounced over the Arctic and Northern Hemisphere continents.
- The high-resolution IFS models successfully mitigate the warm biases in eastern boundary coastal upwelling regions that commonly afflict coarser CMIP6 models.
Spatial Patterns
Many CMIP6 models and the CMIP6 MMM exhibit pronounced warm biases in the Southern Ocean and eastern boundary upwelling zones (e.g., Humboldt and Benguela currents). These coastal warm biases are noticeably absent in IFS-FESOM and IFS-NEMO. Conversely, ICON is characterized by severe cold anomalies over North America, Eurasia, and the Arctic, paired with a distinct warm anomaly over the Southern Ocean. Topographically complex regions, such as the Himalayas, show strong cold biases in many coarse CMIP6 models, which are notably reduced in the IFS models.
Model Agreement
IFS-NEMO and IFS-FESOM show strong agreement with ERA5, maintaining low global mean biases and RMSEs. ICON diverges significantly from the other high-resolution models due to its severe global cold bias. The individual CMIP6 models exhibit a wide inter-model spread, ranging from pervasive warm biases (e.g., ACCESS-ESM1-5, EC-Earth3) to strong cold biases (e.g., CNRM-CM6-1, FGOALS-g3).
Physical Interpretation
The ~5 km resolution of the DestinE models allows for superior representation of coastal bathymetry, ocean eddies, and boundary currents, physically explaining the mitigation of the warm eastern boundary upwelling biases that are prevalent in ~100 km CMIP6 models. Additionally, higher atmospheric resolution improves the simulation of surface fluxes and boundary layer dynamics over complex orography. The severe systematic cold bias in ICON suggests a fundamental energetic imbalance, potentially driven by overly reflective cloud parameterizations or excessive aerosol cooling.
Caveats
- Observational uncertainties in ERA5 over data-sparse, high-altitude regions and the poles may conflate model structural errors with reanalysis limitations.
- Coupled model spin-up state and internal decadal variability can strongly influence regional temperature anomaly patterns (such as the North Atlantic warming hole) over the relatively short 25-year evaluation period.
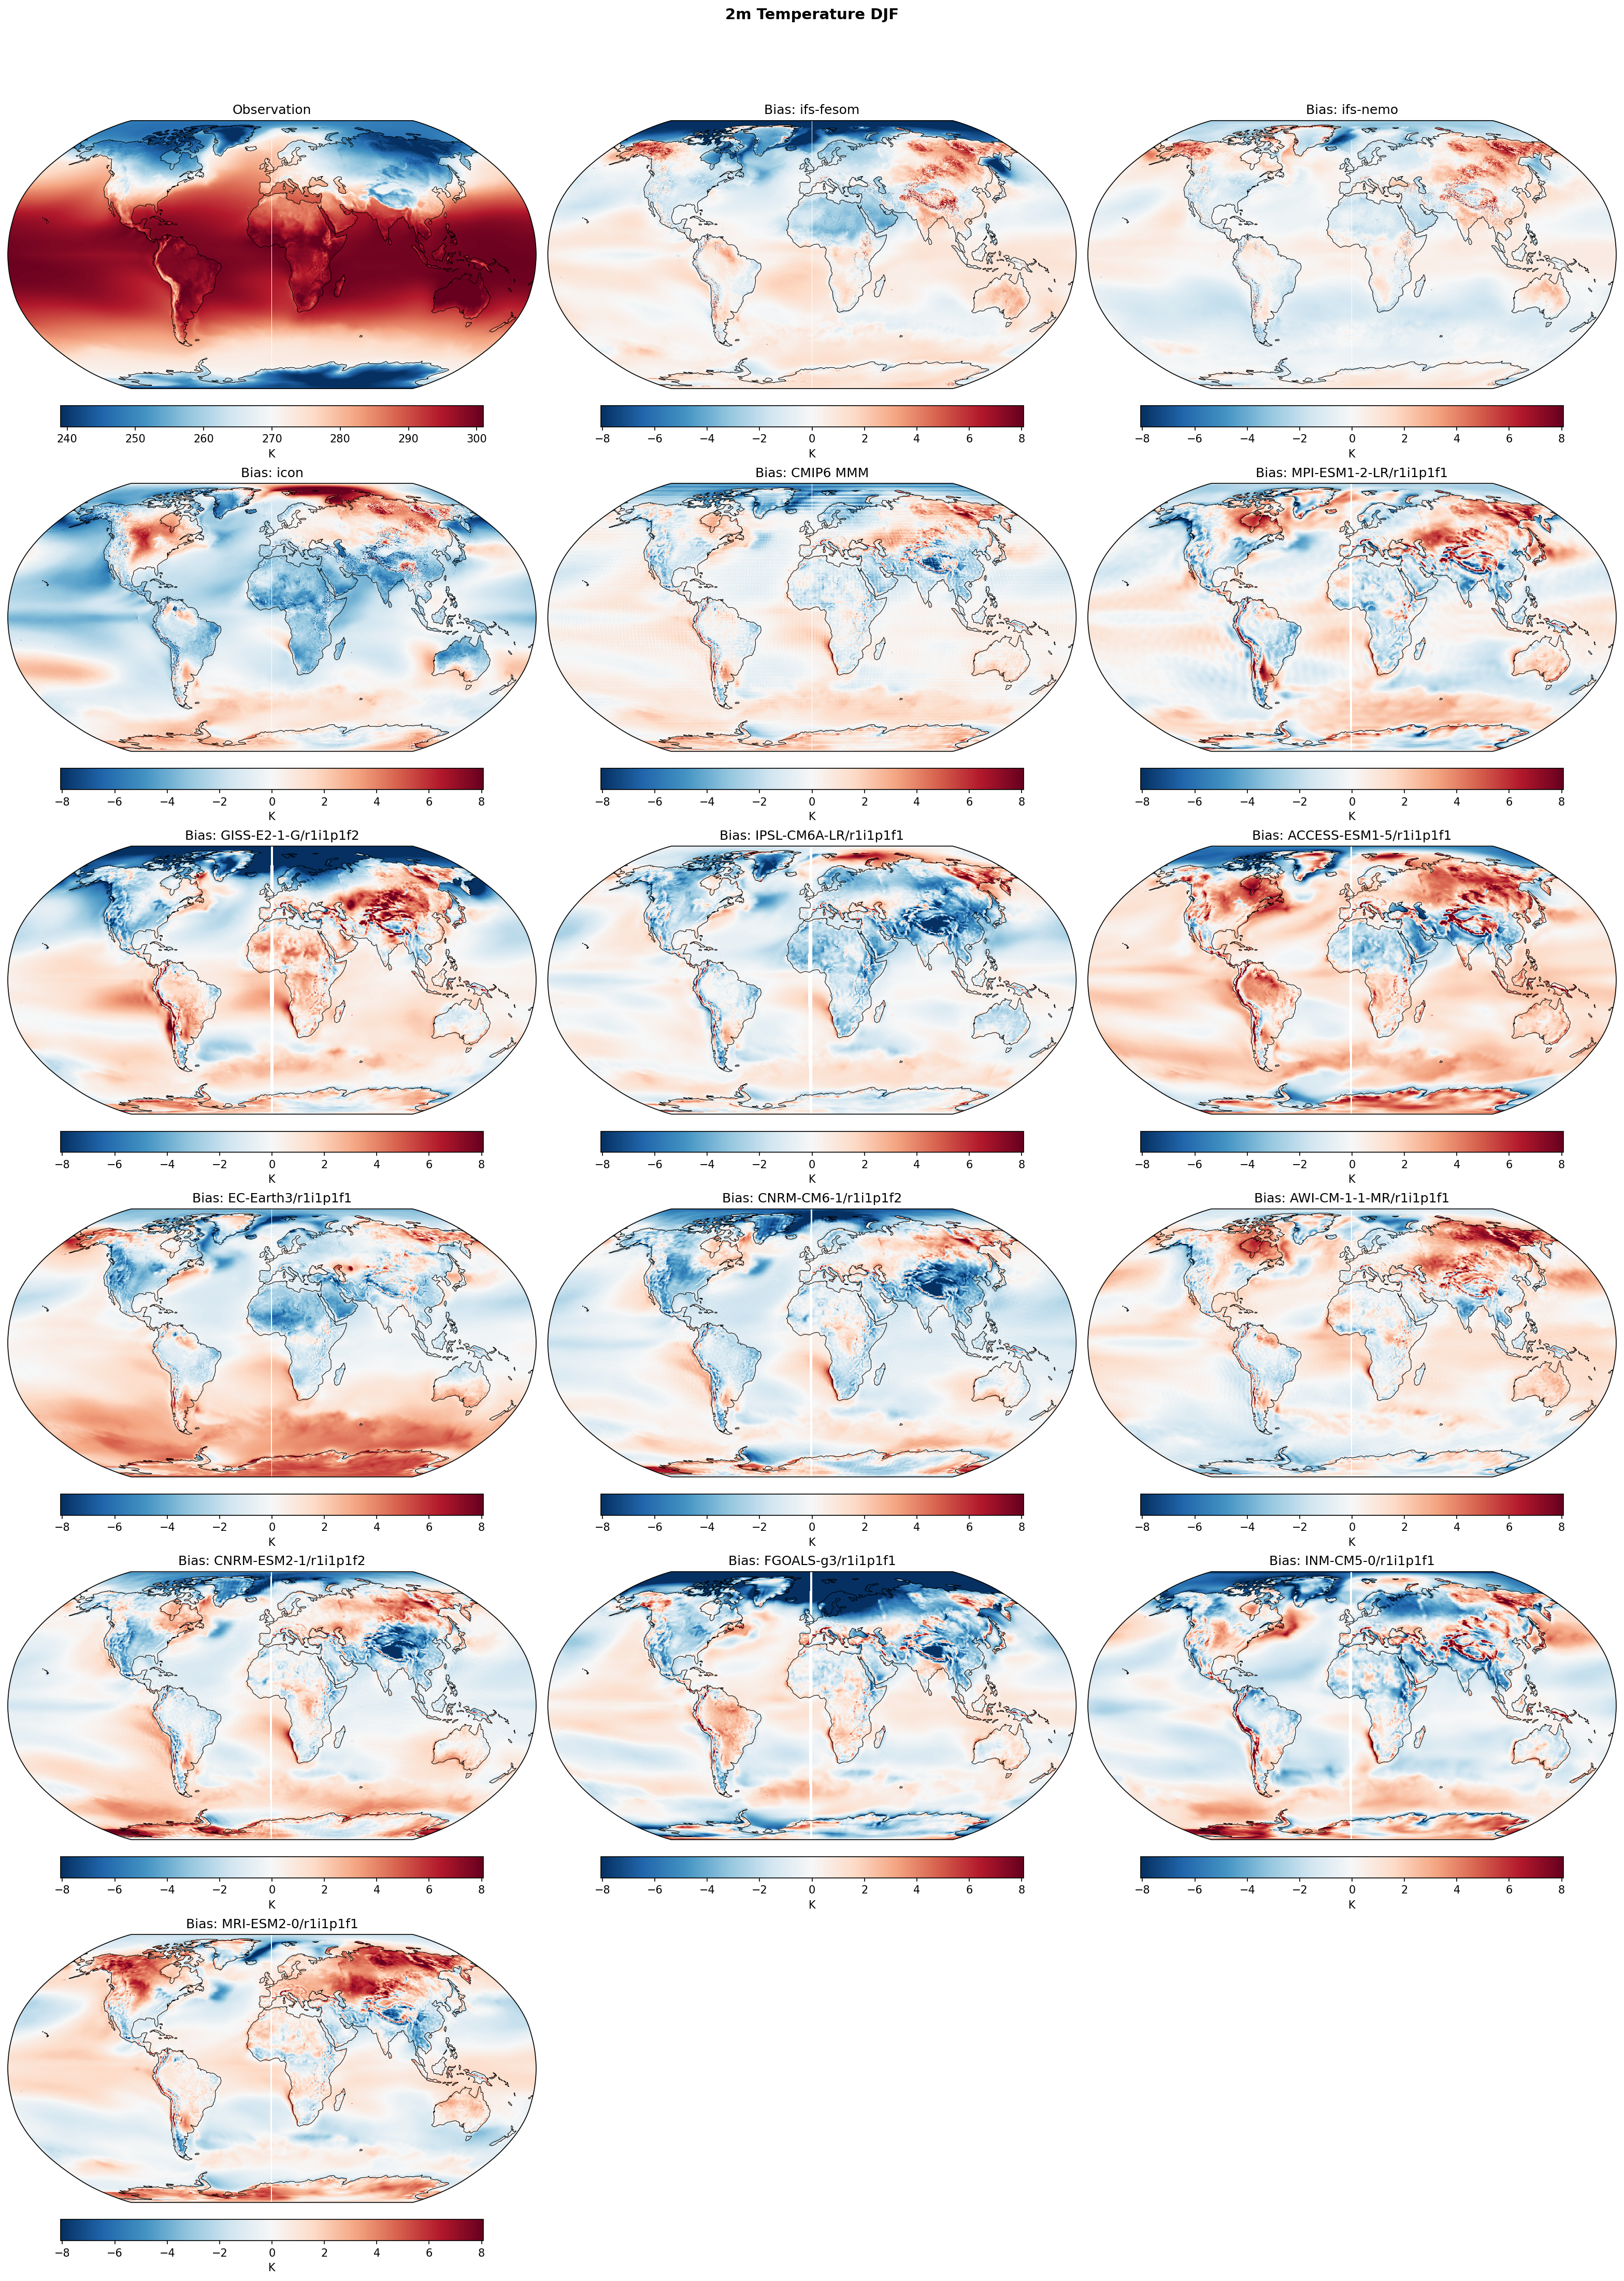
2m Temperature DJF Bias
| Variables | avg_2t |
|---|---|
| Models | ifs-fesom, ifs-nemo, icon, CMIP6 MMM, MPI-ESM1-2-LR/r1i1p1f1, GISS-E2-1-G/r1i1p1f2, IPSL-CM6A-LR/r1i1p1f1, ACCESS-ESM1-5/r1i1p1f1, EC-Earth3/r1i1p1f1, CNRM-CM6-1/r1i1p1f2, AWI-CM-1-1-MR/r1i1p1f1, CNRM-ESM2-1/r1i1p1f2, FGOALS-g3/r1i1p1f1, INM-CM5-0/r1i1p1f1, MRI-ESM2-0/r1i1p1f1 |
| Reference Dataset | ERA5 |
| Units | K |
| Period | 1990–2014 |
| CMIP6 MMM | Global Mean Bias: 0.08 · Rmse: None |
| MPI-ESM1-2-LR/r1i1p1f1 | Global Mean Bias: 0.12 · Rmse: None |
| GISS-E2-1-G/r1i1p1f2 | Global Mean Bias: 0.18 · Rmse: None |
| IPSL-CM6A-LR/r1i1p1f1 | Global Mean Bias: -0.52 · Rmse: None |
| ACCESS-ESM1-5/r1i1p1f1 | Global Mean Bias: 0.95 · Rmse: None |
| EC-Earth3/r1i1p1f1 | Global Mean Bias: 0.36 · Rmse: None |
| CNRM-CM6-1/r1i1p1f2 | Global Mean Bias: -0.60 · Rmse: None |
| AWI-CM-1-1-MR/r1i1p1f1 | Global Mean Bias: 0.47 · Rmse: None |
| CNRM-ESM2-1/r1i1p1f2 | Global Mean Bias: 0.04 · Rmse: None |
| FGOALS-g3/r1i1p1f1 | Global Mean Bias: -0.65 · Rmse: None |
| INM-CM5-0/r1i1p1f1 | Global Mean Bias: -0.36 · Rmse: None |
| MRI-ESM2-0/r1i1p1f1 | Global Mean Bias: 0.40 · Rmse: None |
Summary high
Global maps of 2m temperature biases during boreal winter (DJF) for high-resolution DestinE models (IFS-FESOM, IFS-NEMO, ICON), the CMIP6 multi-model mean (MMM), and individual CMIP6 models relative to ERA5.
Key Findings
- High-resolution DestinE models substantially reduce the severe cold biases over major mountain ranges (Tibetan Plateau, Andes, Rockies) that are pervasive in the CMIP6 models.
- The CMIP6 MMM exhibits a broad cold bias over Northern Hemisphere landmasses in DJF, whereas IFS-FESOM and IFS-NEMO show slight warm biases in these regions.
- The widespread Southern Ocean warm bias common in many CMIP6 models is largely mitigated in the DestinE models, which instead show neutral to slight cold biases.
Spatial Patterns
Pronounced localized cold biases (exceeding -8 K) align with major topographic features in almost all CMIP6 models, a pattern notably absent or diminished in DestinE models. Over the global oceans, ICON exhibits widespread cold biases, particularly in the North Pacific, North Atlantic, and Southern Ocean, contrasting with the more neutral oceanic biases in the IFS-based models.
Model Agreement
IFS-FESOM and IFS-NEMO display strong mutual agreement and generally lower global bias magnitudes compared to the CMIP6 ensemble. ICON diverges notably from the IFS models, exhibiting distinct cold biases over oceans. Individual CMIP6 models show high inter-model spread, particularly over Northern Hemisphere winter continents and the Southern Ocean.
Physical Interpretation
The reduction of topographical biases in DestinE models is a direct physical consequence of the ~5 km resolution accurately resolving orography, thereby minimizing elevation mismatches and improving local flow dynamics. The shift from CMIP6 cold biases to IFS warm biases over NH winter landmasses likely stems from differing parameterizations of stable boundary layer mixing and snow-albedo feedbacks. Southern Ocean differences relate to the representation of low-level stratocumulus clouds and ocean mesoscale eddies.
Caveats
- ERA5 has a spatial resolution of ~31 km, meaning the 'observational' reference is coarser than the DestinE models (~5 km), complicating the assessment of fine-scale topographic and coastal biases.
- The analysis is restricted to the DJF season; boundary layer and cloud-radiative biases often exhibit strong seasonality.
2m Temperature JJA Bias
| Variables | avg_2t |
|---|---|
| Models | ifs-fesom, ifs-nemo, icon, CMIP6 MMM, MPI-ESM1-2-LR/r1i1p1f1, GISS-E2-1-G/r1i1p1f2, IPSL-CM6A-LR/r1i1p1f1, ACCESS-ESM1-5/r1i1p1f1, EC-Earth3/r1i1p1f1, CNRM-CM6-1/r1i1p1f2, AWI-CM-1-1-MR/r1i1p1f1, CNRM-ESM2-1/r1i1p1f2, FGOALS-g3/r1i1p1f1, INM-CM5-0/r1i1p1f1, MRI-ESM2-0/r1i1p1f1 |
| Reference Dataset | ERA5 |
| Units | K |
| Period | 1990–2014 |
| CMIP6 MMM | Global Mean Bias: 0.11 · Rmse: None |
| MPI-ESM1-2-LR/r1i1p1f1 | Global Mean Bias: 0.14 · Rmse: None |
| GISS-E2-1-G/r1i1p1f2 | Global Mean Bias: -0.10 · Rmse: None |
| IPSL-CM6A-LR/r1i1p1f1 | Global Mean Bias: -0.34 · Rmse: None |
| ACCESS-ESM1-5/r1i1p1f1 | Global Mean Bias: 0.85 · Rmse: None |
| EC-Earth3/r1i1p1f1 | Global Mean Bias: 0.60 · Rmse: None |
| CNRM-CM6-1/r1i1p1f2 | Global Mean Bias: -0.48 · Rmse: None |
| AWI-CM-1-1-MR/r1i1p1f1 | Global Mean Bias: 0.45 · Rmse: None |
| CNRM-ESM2-1/r1i1p1f2 | Global Mean Bias: 0.17 · Rmse: None |
| FGOALS-g3/r1i1p1f1 | Global Mean Bias: -0.25 · Rmse: None |
| INM-CM5-0/r1i1p1f1 | Global Mean Bias: -0.25 · Rmse: None |
| MRI-ESM2-0/r1i1p1f1 | Global Mean Bias: -0.02 · Rmse: None |
Summary high
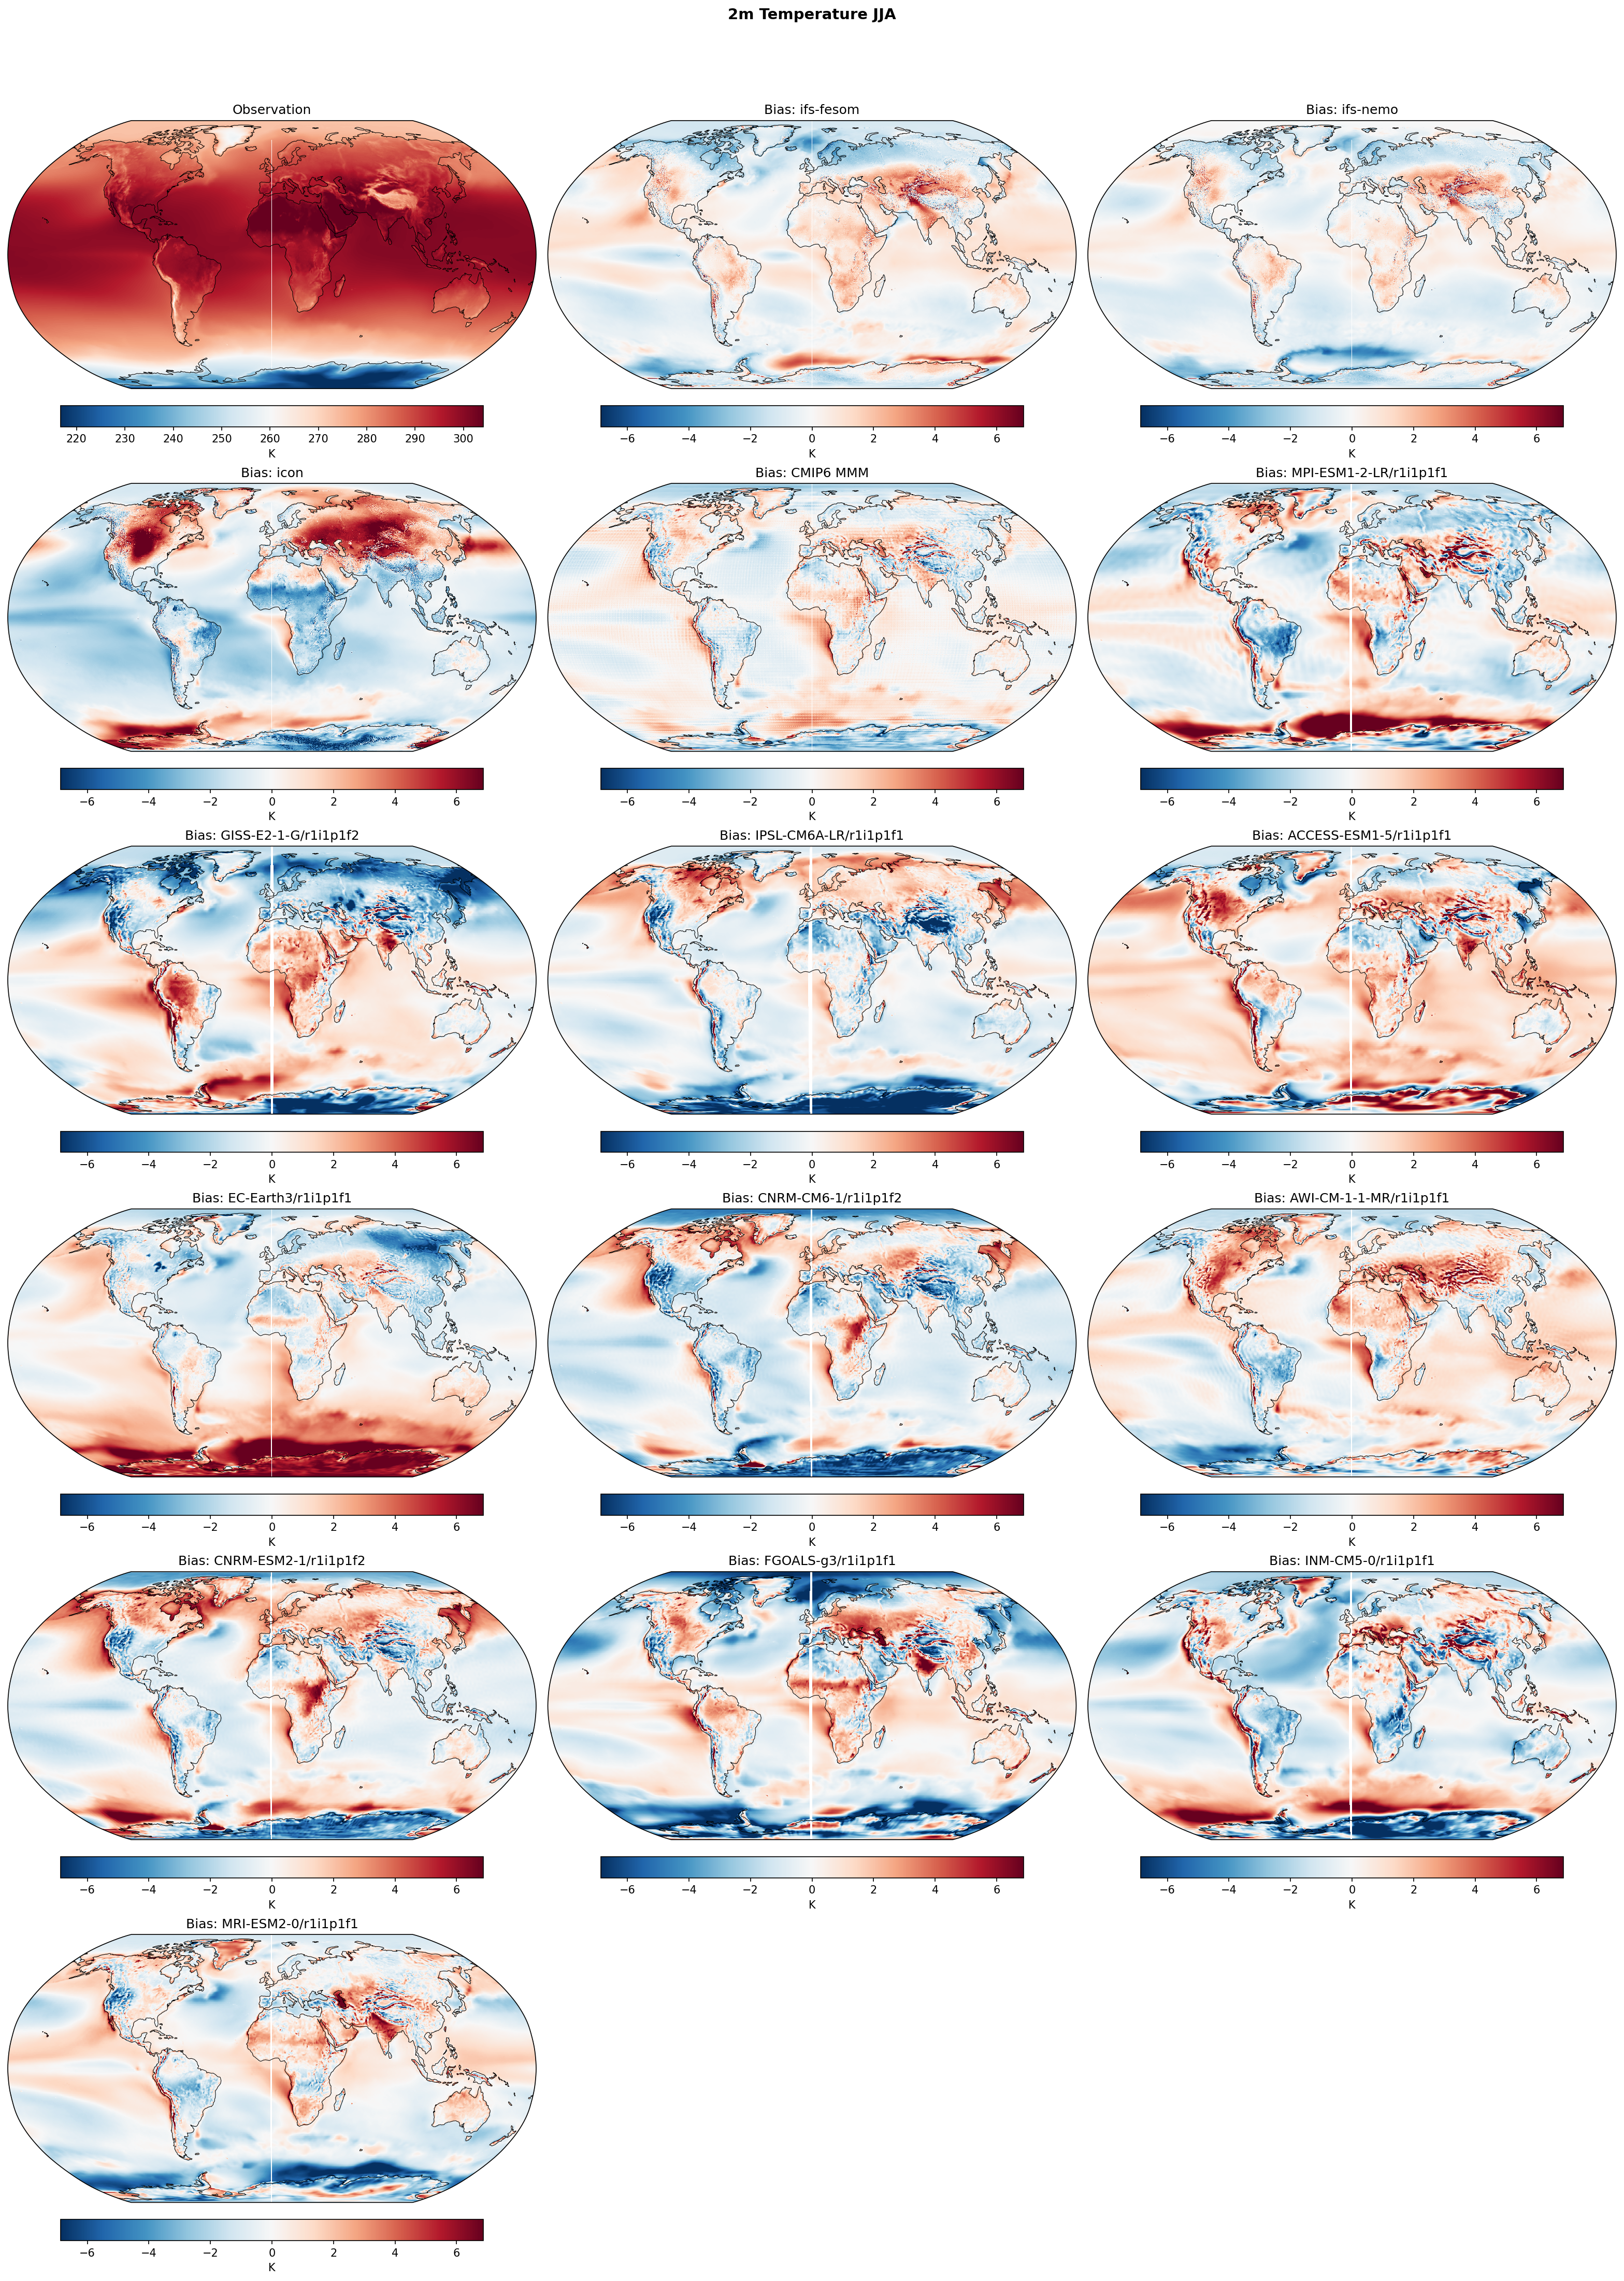
The figure presents JJA (June-July-August) 2m temperature climatology bias maps for three high-resolution DestinE models (IFS-FESOM, IFS-NEMO, ICON), the CMIP6 multi-model mean, and individual CMIP6 models, evaluated against ERA5 reanalysis for the period 1990-2014.
Key Findings
- IFS-FESOM and IFS-NEMO exhibit generally small large-scale biases, characterized by a mild widespread cold anomaly over oceans and localized warm biases over complex topography.
- The ICON model displays severe warm biases exceeding +6 K over high-latitude Northern Hemisphere landmasses (North America, Siberia, Greenland) during the summer season.
- The high-resolution IFS models largely eliminate the pervasive Southern Ocean and Antarctic warm bias that dominates the CMIP6 MMM and many individual CMIP6 models.
Spatial Patterns
IFS-FESOM and IFS-NEMO share highly similar bias patterns, with broad, slight negative biases (-1 to -2 K) across most ocean basins and notable warm biases (+4 to +6 K) over the Tibetan Plateau/Himalayas and the central United States. ICON diverges sharply with extreme warm biases over NH high-latitude land and cold biases over tropical land (e.g., Africa, South America). The CMIP6 MMM shows a general cold bias over NH land and a distinct warm bias over the Southern Ocean and Antarctica. Many CMIP6 models feature a North Atlantic cold bias ('warming hole'), which is present but weaker in the IFS models.
Model Agreement
The two IFS-based DestinE models show excellent structural agreement with each other and generally better fidelity than the CMIP6 MMM over the oceans. ICON shows poor agreement with both the IFS models and observations over NH land in JJA. Individual CMIP6 models show massive inter-model spread, ranging from strong global cooling (GISS-E2-1-G) to strong global warming (ACCESS-ESM1-5), highlighting the persistent uncertainty in CMIP-class models that the DestinE ensemble aims to narrow.
Physical Interpretation
The severe summer warm bias in ICON over NH land strongly suggests deficiencies in land-atmosphere coupling, likely driven by overly rapid soil moisture depletion, leading to suppressed latent heat fluxes and amplified sensible heating. The prominent warm bias over the Tibetan Plateau in both high-resolution IFS models and CMIP6 models indicates persistent challenges in parameterizing snow albedo feedbacks, surface energy balance, or unresolved orographic drag over extreme topography. The reduction of the Southern Ocean warm bias in IFS-FESOM/NEMO compared to CMIP6 may stem from improved high-resolution ocean eddy dynamics or better cloud-radiation interactions in the storm tracks.
Caveats
- Over regions with sparse observational coverage and extreme topography, such as the Tibetan Plateau and Antarctica, ERA5 reanalysis itself contains significant uncertainties, complicating the interpretation of model biases.
- The evaluation period (1990-2014) is relatively short and biases in coupled models, particularly over ocean basins like the North Atlantic, may be partially aliased by unphased internal decadal variability.
Surface Sensible Heat Flux Annual Mean Bias
| Variables | avg_ishf |
|---|---|
| Models | ifs-fesom, ifs-nemo, icon |
| Reference Dataset | ERA5 |
| Units | W/m2 |
| Period | 1990–2014 |
| ifs-fesom | Global Mean Bias: -1.22 · Rmse: 8.13 |
| ifs-nemo | Global Mean Bias: -1.08 · Rmse: 7.21 |
| icon | Global Mean Bias: -3.81 · Rmse: 11.27 |
Summary high
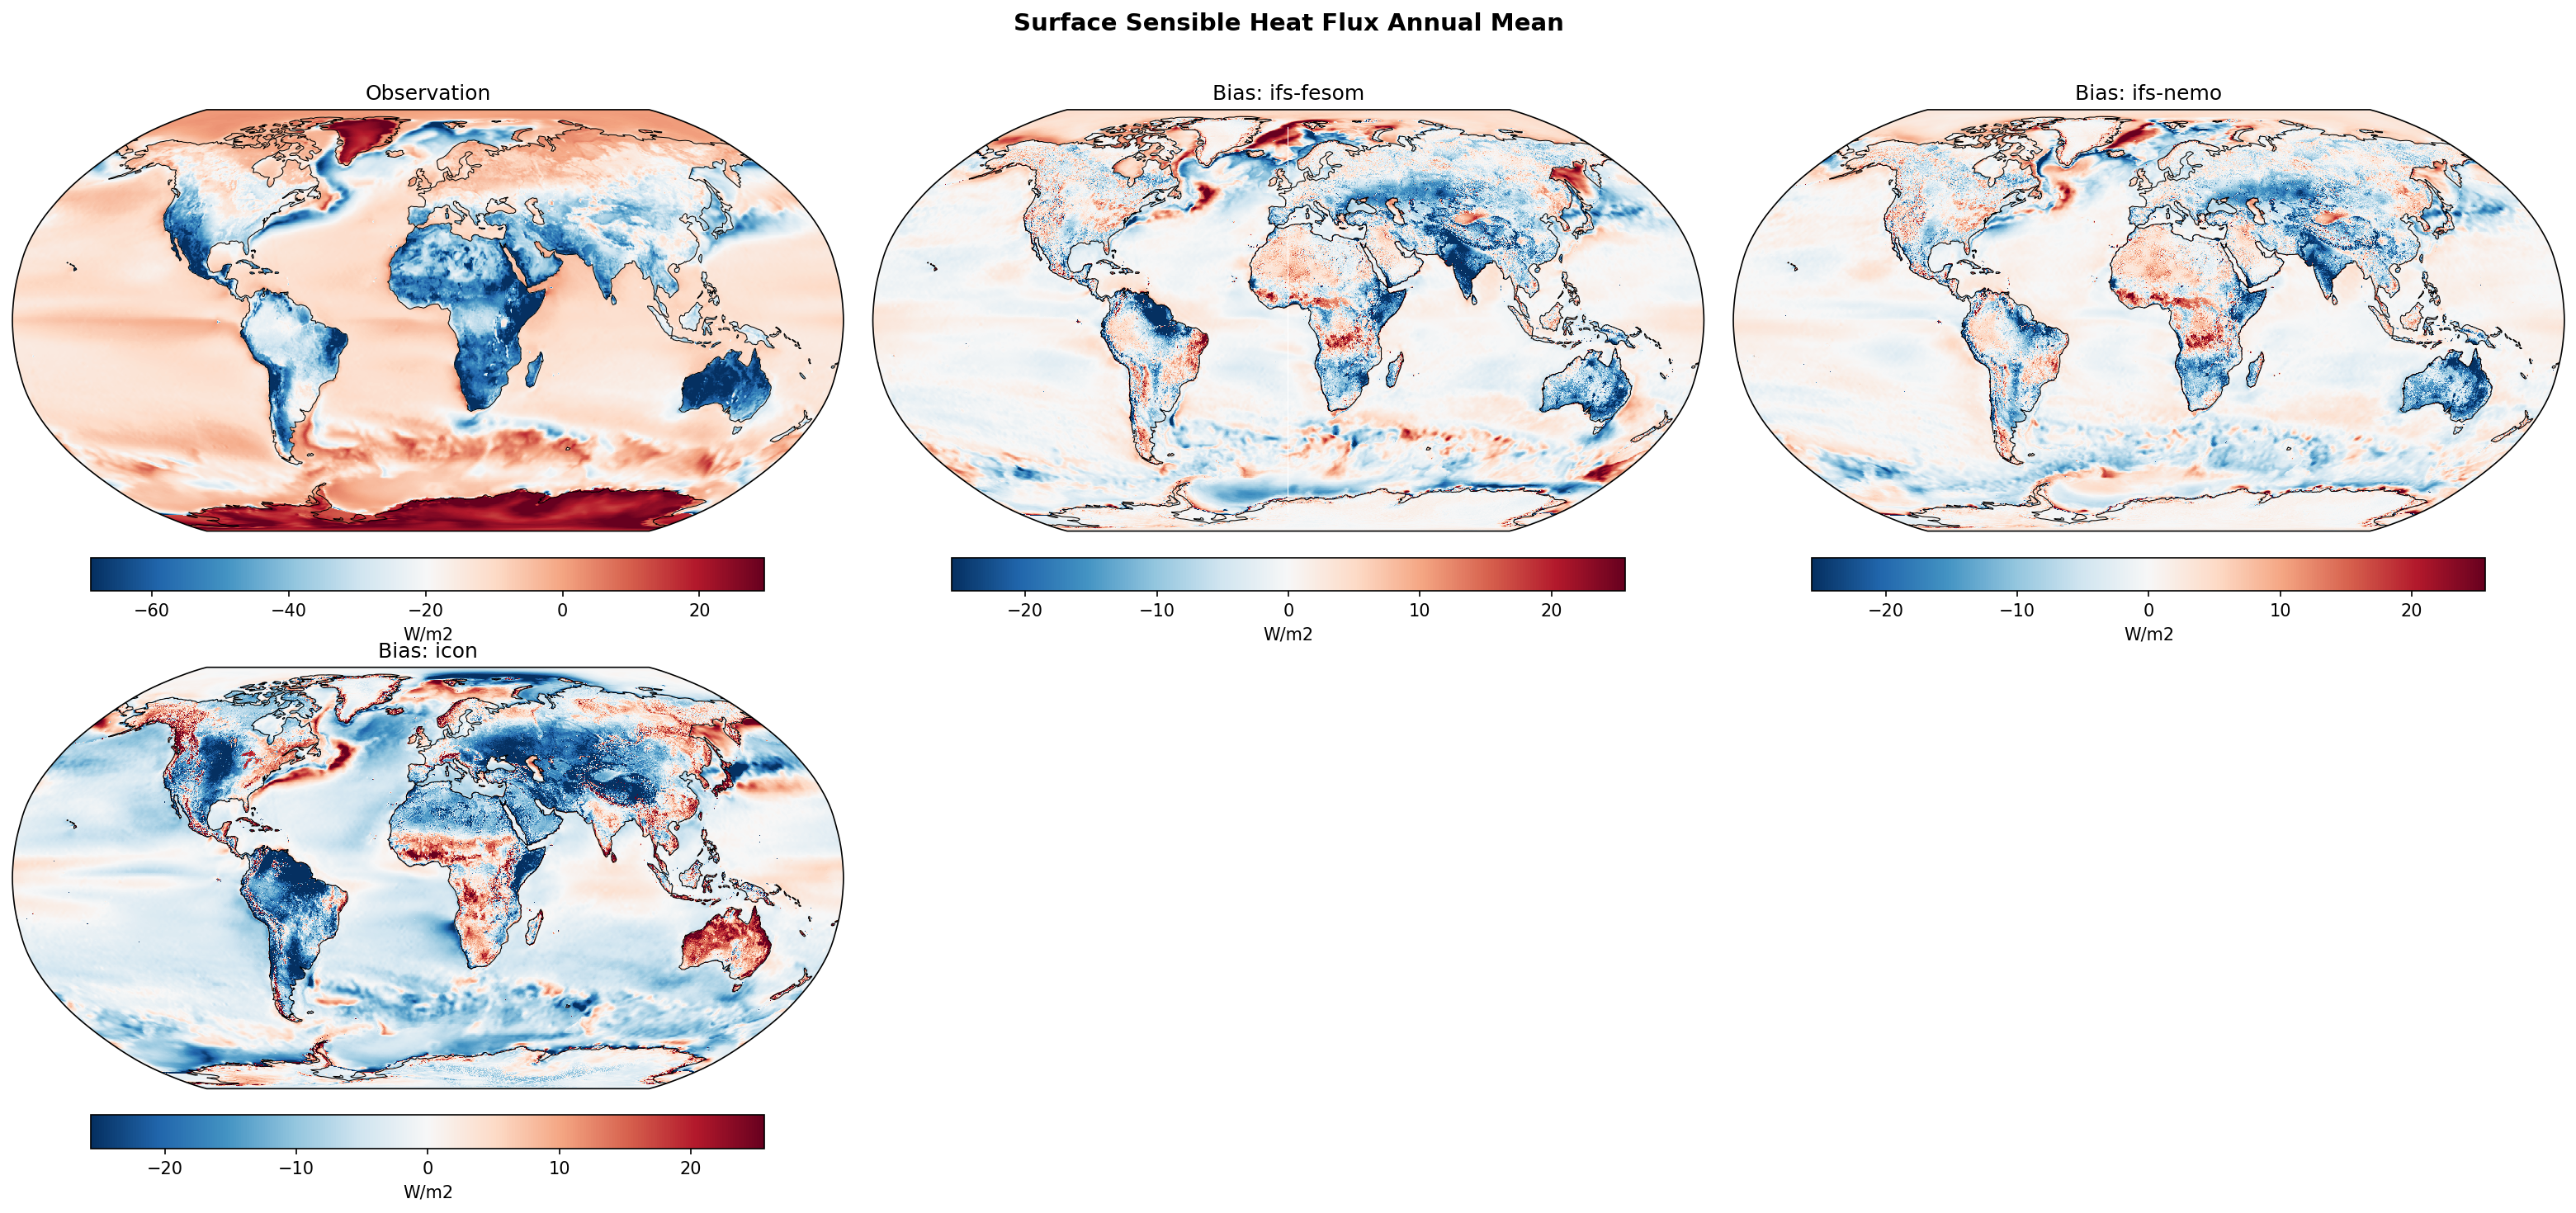
Annual mean surface sensible heat flux biases are evaluated against ERA5, revealing that the IFS-based models exhibit significantly smaller deviations than ICON, largely due to structural similarities between the IFS models and the reanalysis.
Key Findings
- IFS-NEMO and IFS-FESOM demonstrate relatively low global errors (RMSE ~6.8-7.7 W/m2), significantly outperforming ICON (RMSE ~11.0 W/m2).
- ICON displays widespread, severe negative biases (excessive upward heat flux) over most vegetated land areas, particularly the Amazon, North America, and Eurasia.
- All three models share a pronounced positive bias (insufficient upward heat flux) over major arid regions like the Sahara and Arabian deserts.
Spatial Patterns
Over land, the IFS models exhibit positive biases over deserts and central Africa, with strong negative biases over high topography (Himalayas, Andes). ICON contrasts sharply with massive negative biases across temperate and tropical biomes. Over the oceans, ICON shows distinct positive biases localized over western boundary currents (Gulf Stream, Kuroshio), whereas IFS models display broader, weaker negative biases, particularly across the Southern Ocean.
Model Agreement
IFS-NEMO and IFS-FESOM agree closely with each other and with ERA5, reflecting their shared IFS atmospheric component. ICON diverges fundamentally from the IFS family in its spatial bias patterns, especially concerning land-atmosphere interactions.
Physical Interpretation
ICON's widespread negative bias over vegetated land indicates its land surface scheme partitions too much available energy into sensible heat rather than latent heat flux (evapotranspiration) relative to ERA5. The shared positive biases over deserts suggest common challenges in modeling bare soil aerodynamics, thermal roughness lengths, or boundary layer mixing under extreme insolation. Oceanic biases in ICON over western boundary currents point to underestimations of air-sea temperature gradients or turbulent exchange coefficients.
Caveats
- Because ERA5 is produced using the IFS atmospheric model, the lower biases in IFS-FESOM and IFS-NEMO partially reflect their shared model lineage (e.g., HTESSEL land scheme) rather than strictly superior physical realism compared to ICON.
- Surface sensible heat flux is an unassimilated, model-derived variable in ERA5, meaning the observational reference carries inherent model uncertainties.
Surface Sensible Heat Flux DJF Bias
| Variables | avg_ishf |
|---|---|
| Models | ifs-fesom, ifs-nemo, icon |
| Reference Dataset | ERA5 |
| Units | W/m2 |
| Period | 1990–2014 |
Summary high
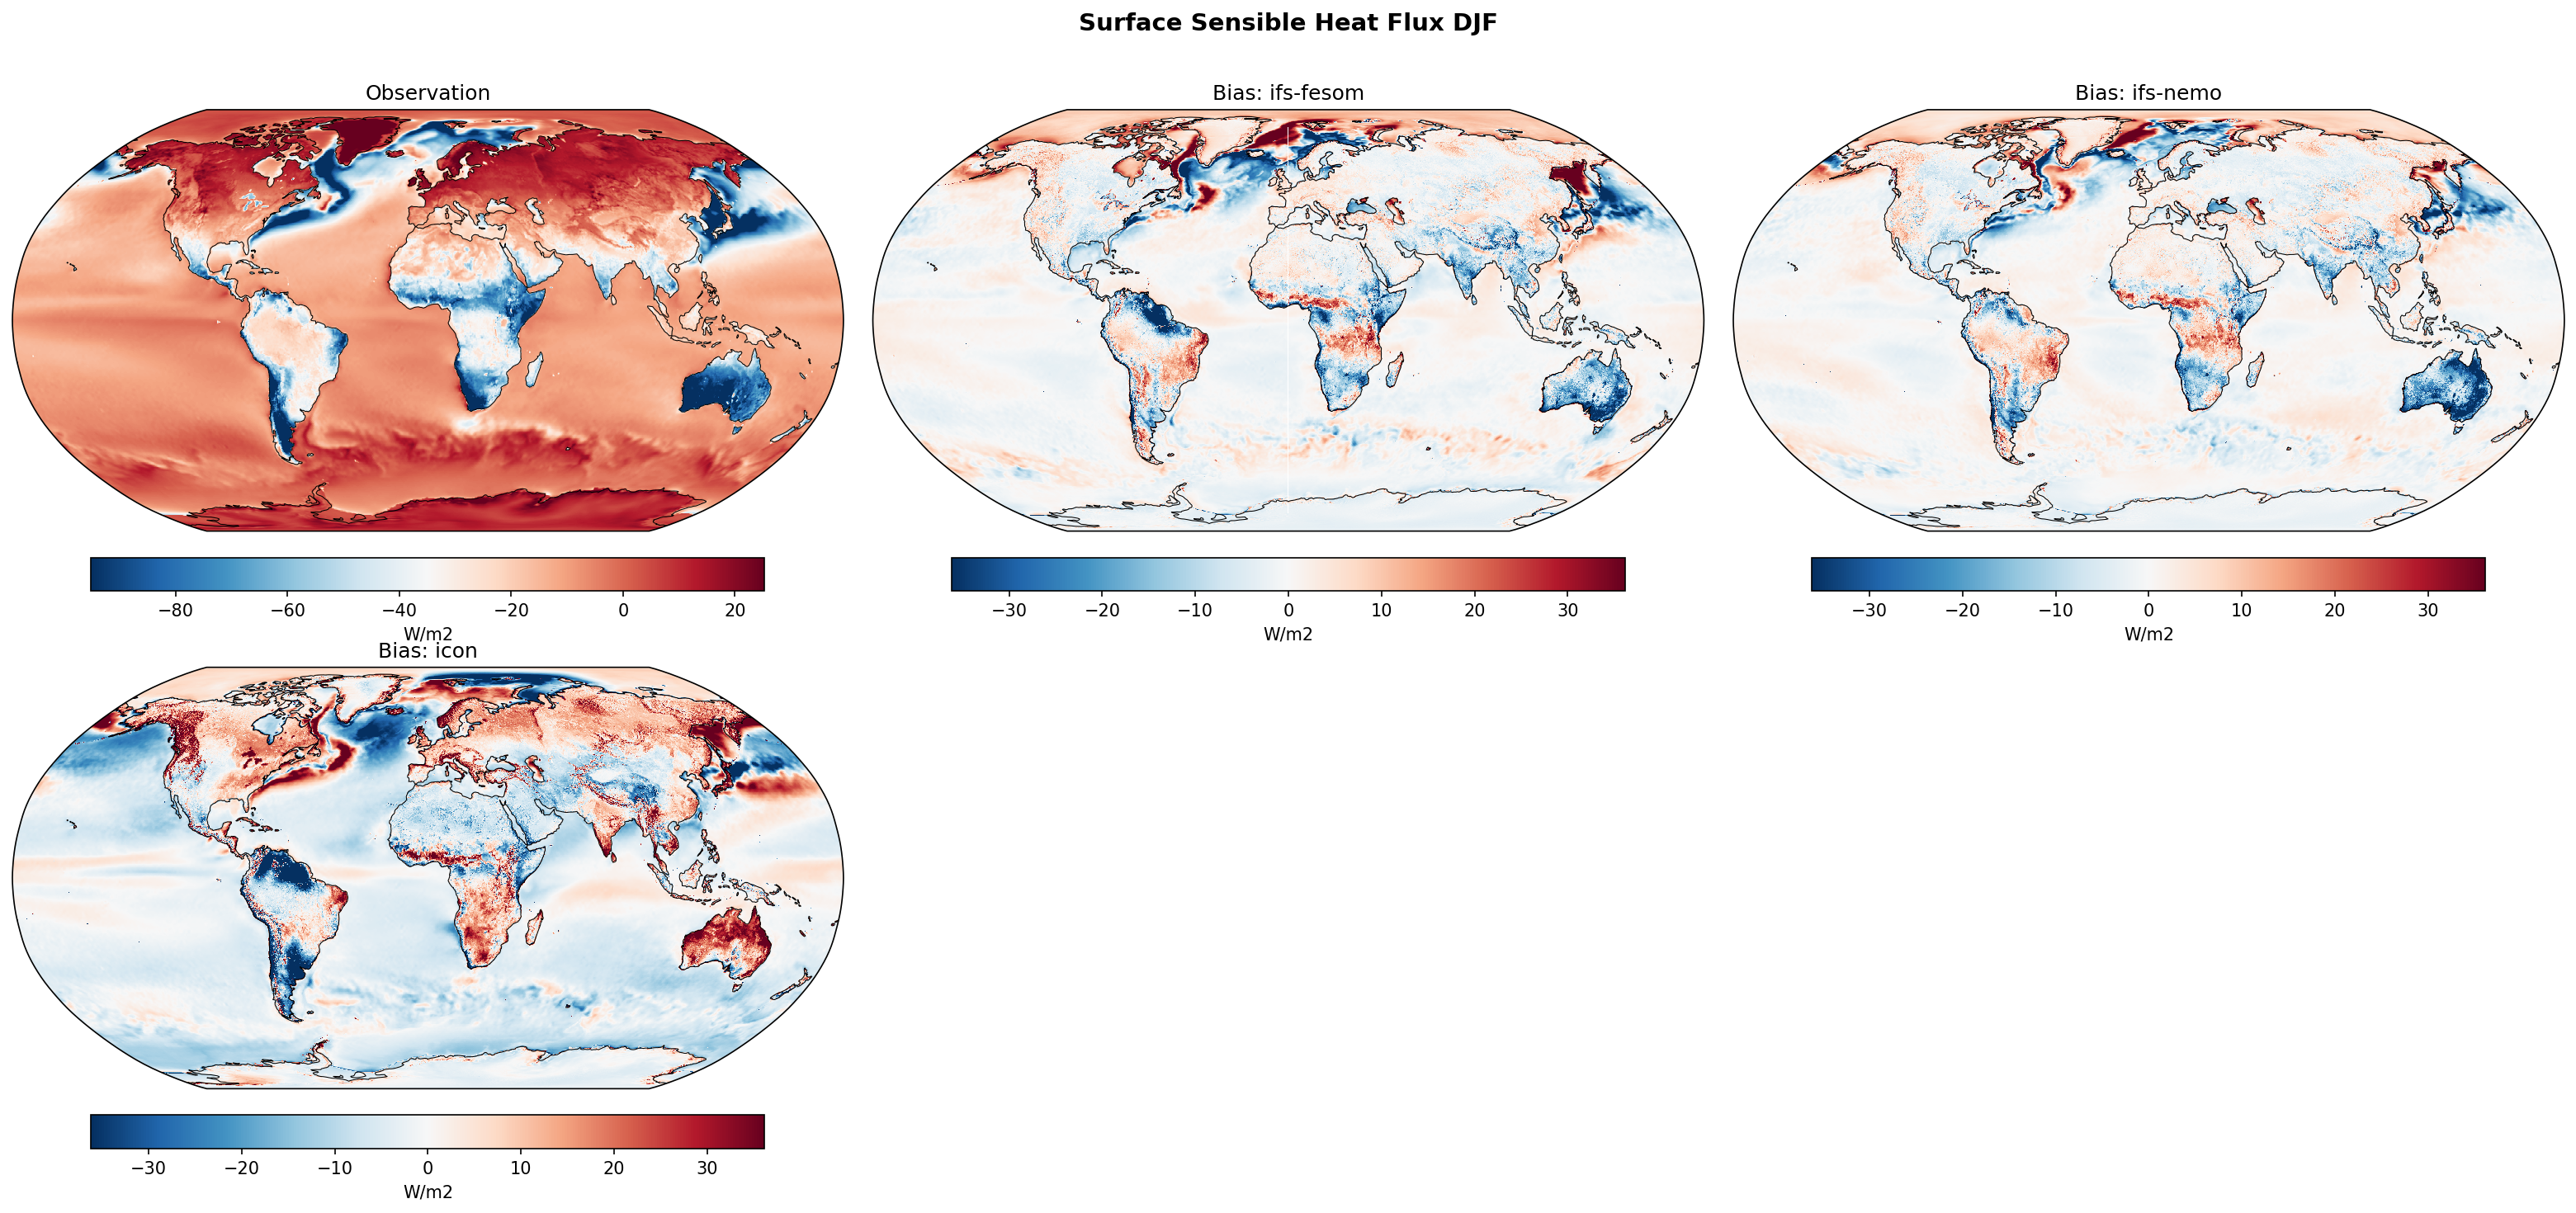
The figure displays DJF climatology and bias maps for surface sensible heat flux, comparing the high-resolution IFS-FESOM, IFS-NEMO, and ICON models against ERA5 reanalysis.
Key Findings
- IFS-FESOM and IFS-NEMO exhibit strong negative biases (excessive upward heat flux) over Northern Hemisphere western boundary currents, particularly the Gulf Stream and Kuroshio.
- ICON displays a distinct spatial bias pattern, featuring pronounced positive biases over Northern Hemisphere high-latitude landmasses and the Kuroshio Extension.
- All models show significant biases in regions characterized by sharp sea surface temperature gradients and sea ice edges, underscoring challenges in high-resolution air-sea coupling.
Spatial Patterns
Observations show intense upward (negative) sensible heat fluxes over the Gulf Stream, Kuroshio, and Nordic/Labrador Seas during NH winter. IFS-FESOM and IFS-NEMO amplify these features, showing strong negative biases in these western boundary current regions, alongside positive biases over tropical/subtropical land (Africa, South America, Australia). In contrast, ICON exhibits strong positive biases over wintertime NH landmasses (Eurasia, North America) and the Kuroshio, paired with distinct negative biases along the Antarctic coastline and Southern Ocean sea ice edge.
Model Agreement
There is high agreement between IFS-FESOM and IFS-NEMO, likely due to their shared IFS atmospheric component, resulting in similar bias structures over both land and ocean. ICON diverges significantly from the IFS models, demonstrating a completely different error climatology, particularly over high-latitude land and the Southern Ocean.
Physical Interpretation
Oceanic biases in western boundary currents at high resolution often result from slight spatial misplacements of sharp SST fronts relative to the paths of cold air outbreaks, driving large localized flux errors. For ICON, the widespread positive biases over wintertime NH land point to potential issues with stable boundary layer parameterizations or snow-atmosphere coupling, which may suppress upward sensible heat transfer. The negative biases near Antarctica in ICON may be driven by insufficient sea ice insulation or overly strong simulated katabatic winds.
Caveats
- ERA5 is used as the 'observational' truth, but reanalysis surface fluxes contain substantial uncertainties, especially over the Southern Ocean, sea ice, and western boundary currents.
- At ~5 km resolution, minor spatial displacements in ocean currents or fronts can generate large dipole biases ('double penalties'), which may exaggerate apparent model errors in Eulerian metrics.
Surface Sensible Heat Flux JJA Bias
| Variables | avg_ishf |
|---|---|
| Models | ifs-fesom, ifs-nemo, icon |
| Reference Dataset | ERA5 |
| Units | W/m2 |
| Period | 1990–2014 |
Summary high
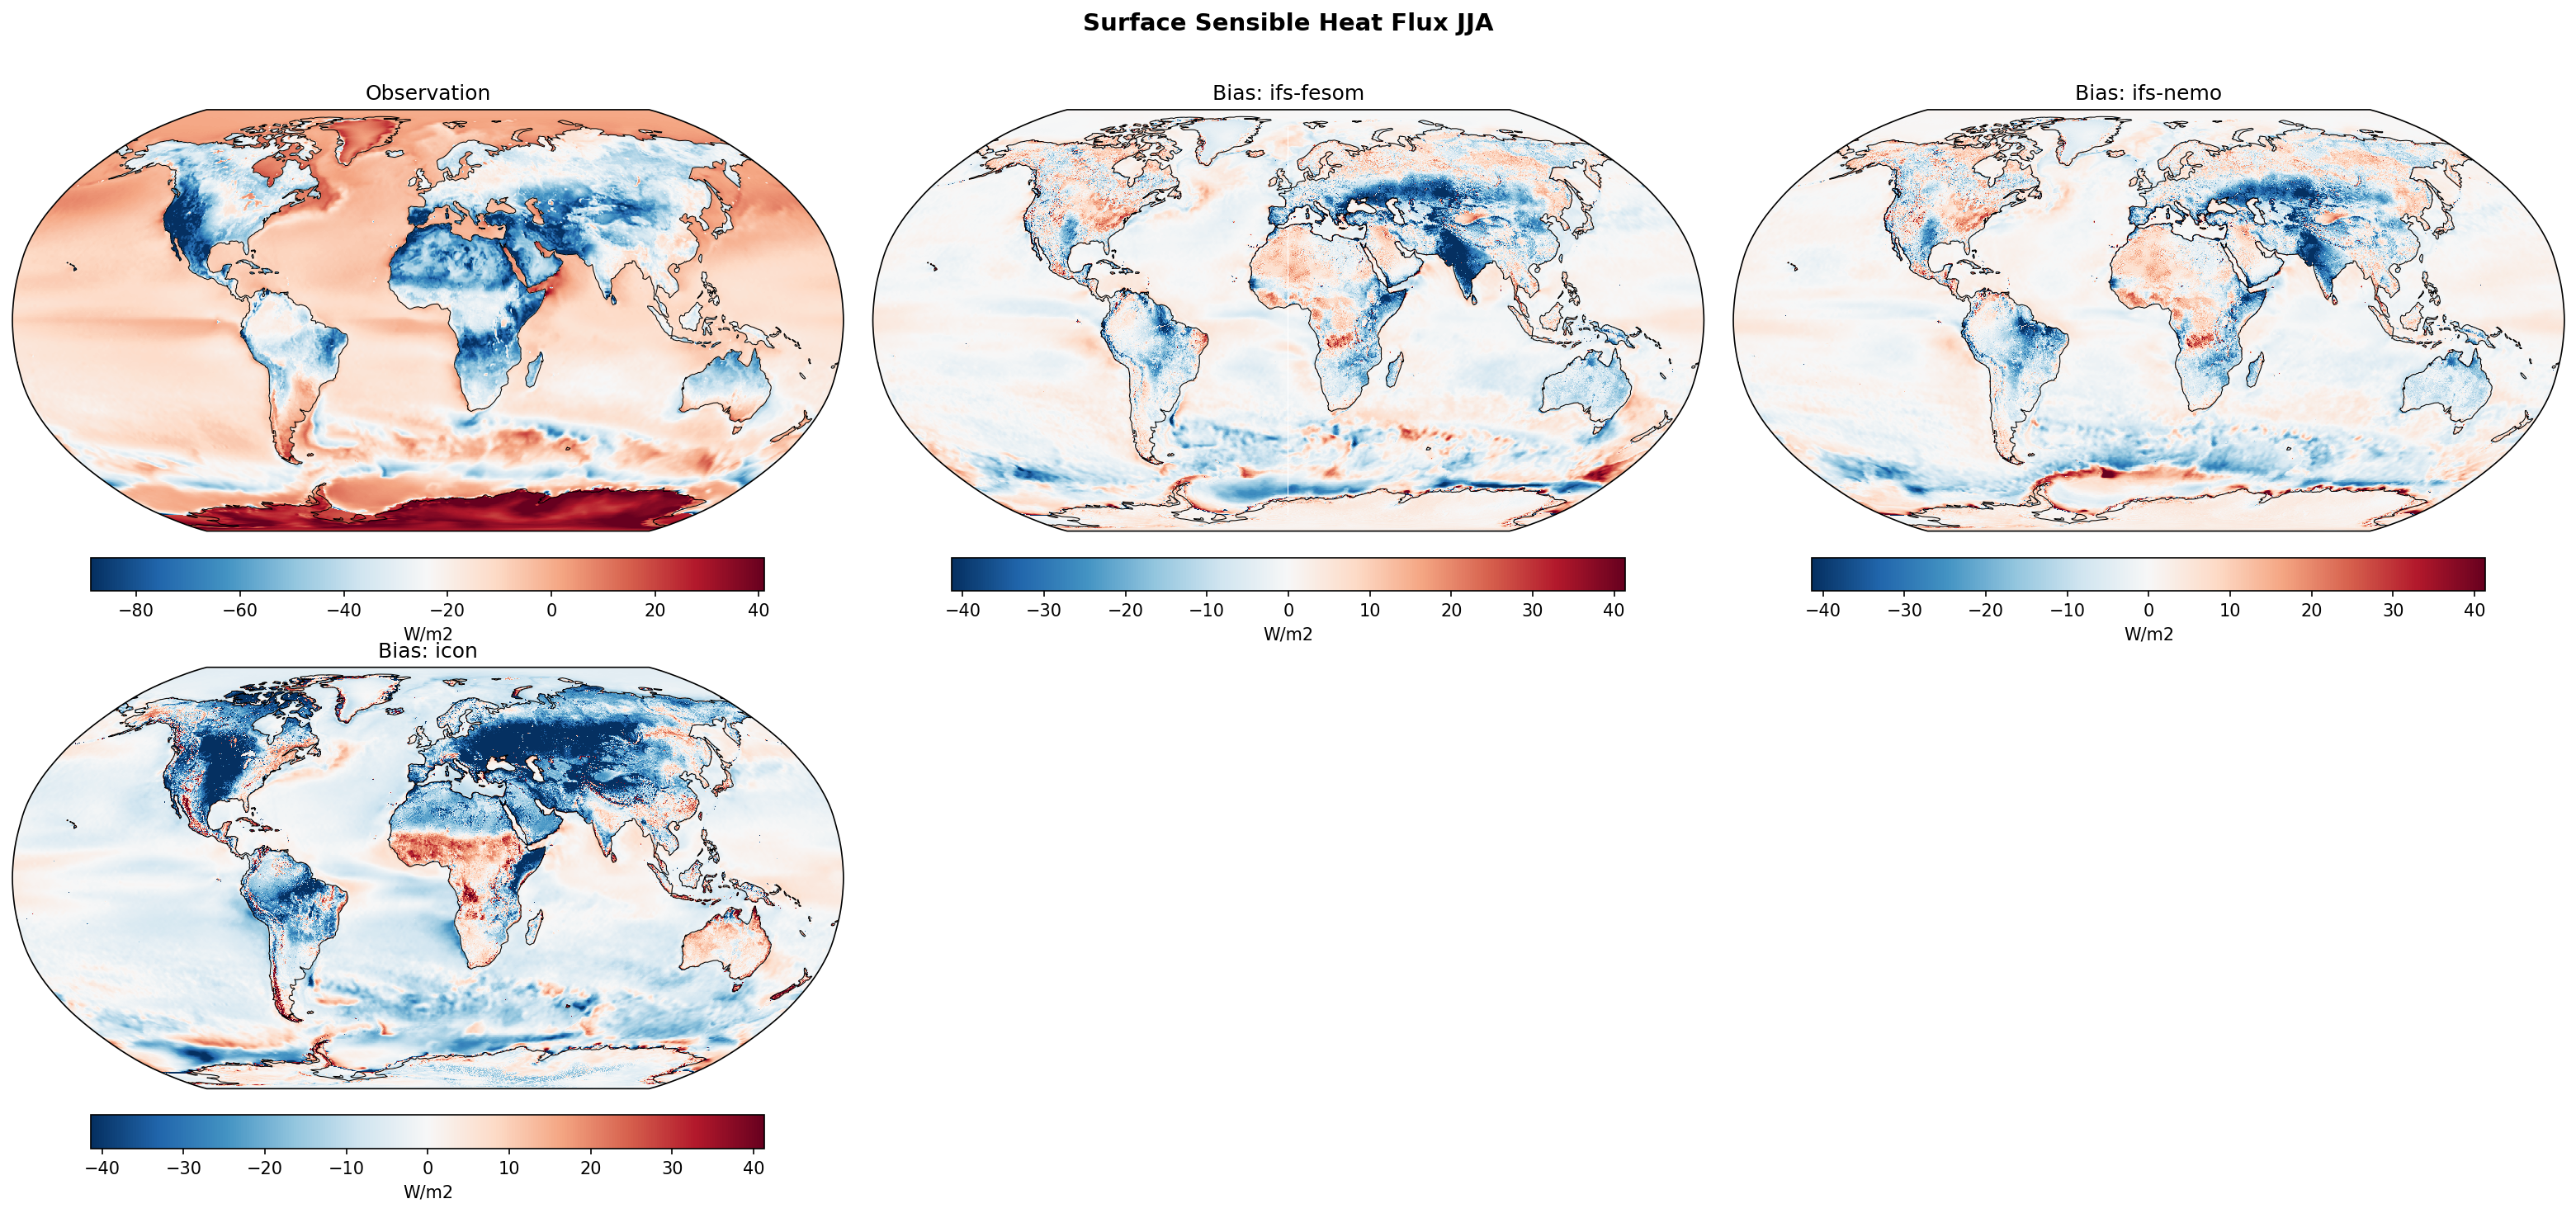
Evaluation of JJA surface sensible heat flux reveals systemic model biases over landmasses, with all models overestimating upward sensible heating over Northern Hemisphere vegetated regions and underestimating it over arid zones.
Key Findings
- Models consistently overestimate upward sensible heat flux (negative bias) over Northern Hemisphere summer landmasses such as Eurasia and North America, with ICON displaying the largest bias magnitudes.
- Conversely, over the Sahara and parts of the Middle East, models show positive biases, indicating an underestimation of the strong upward sensible heat flux characteristic of these arid regions.
- IFS-FESOM and IFS-NEMO share highly similar bias patterns and magnitudes, whereas ICON exhibits substantially larger land-surface biases, highlighting differences in land-atmosphere coupling.
Spatial Patterns
The ERA5 reference climatology shows strong upward (negative) sensible heat fluxes over summer continents and downward (positive) fluxes over the winter Antarctic. The bias maps feature a distinct spatial dipole over land: strong negative biases (overestimated upward flux) dominate temperate and boreal Northern Hemisphere regions, while positive biases (underestimated upward flux) are localized over arid regions like the Sahara. Oceanic biases are broadly small, though ICON shows regional negative biases over the Southern Ocean.
Model Agreement
IFS-FESOM and IFS-NEMO are in very strong agreement, reflecting their shared IFS atmospheric component. ICON diverges notably, with significantly amplified bias amplitudes over global landmasses (both positive and negative), underscoring fundamental differences in land surface modeling and boundary layer parameterizations.
Physical Interpretation
The excessive sensible heating over vegetated continents (negative biases) suggests an error in surface energy balance partitioning, potentially driven by a dry soil moisture bias or underestimated evapotranspiration (latent heat flux), leading to an anomalously high Bowen ratio. The opposing positive bias in arid regions may point to overestimations in surface albedo or incorrect parameterization of aerodynamic roughness lengths, which limit efficient heat transfer.
Caveats
- Surface fluxes in ERA5 are heavily dependent on the reanalysis model's own land surface scheme (HTESSEL) rather than being directly assimilated observations, adding uncertainty to the baseline.
- Sign conventions for surface fluxes (where negative denotes upward flux) can complicate interpretation, though the physical patterns of the biases remain robust.
Mean Sea Level Pressure Annual Mean Bias
| Variables | avg_msl |
|---|---|
| Models | ifs-fesom, ifs-nemo, icon, CMIP6 MMM, MPI-ESM1-2-LR/r1i1p1f1, GISS-E2-1-G/r1i1p1f2, IPSL-CM6A-LR/r1i1p1f1, ACCESS-ESM1-5/r1i1p1f1, EC-Earth3/r1i1p1f1, CNRM-CM6-1/r1i1p1f2, AWI-CM-1-1-MR/r1i1p1f1, CNRM-ESM2-1/r1i1p1f2, FGOALS-g3/r1i1p1f1, INM-CM5-0/r1i1p1f1, MRI-ESM2-0/r1i1p1f1 |
| Reference Dataset | ERA5 |
| Units | Pa |
| Period | 1990–2014 |
| ifs-fesom | Global Mean Bias: -1.59 · Rmse: 100.98 |
| ifs-nemo | Global Mean Bias: 0.08 · Rmse: 88.91 |
| icon | Global Mean Bias: -38.34 · Rmse: 483.36 |
| CMIP6 MMM | Global Mean Bias: -3.57 · Rmse: 87.30 |
| MPI-ESM1-2-LR/r1i1p1f1 | Global Mean Bias: -10.44 · Rmse: 159.99 |
| GISS-E2-1-G/r1i1p1f2 | Global Mean Bias: -143.72 · Rmse: 225.92 |
| IPSL-CM6A-LR/r1i1p1f1 | Global Mean Bias: 34.67 · Rmse: 218.61 |
| ACCESS-ESM1-5/r1i1p1f1 | Global Mean Bias: 38.31 · Rmse: 210.30 |
| EC-Earth3/r1i1p1f1 | Global Mean Bias: -13.97 · Rmse: 102.87 |
| CNRM-CM6-1/r1i1p1f2 | Global Mean Bias: 17.41 · Rmse: 168.49 |
| AWI-CM-1-1-MR/r1i1p1f1 | Global Mean Bias: -24.87 · Rmse: 176.49 |
| CNRM-ESM2-1/r1i1p1f2 | Global Mean Bias: 12.61 · Rmse: 171.45 |
| FGOALS-g3/r1i1p1f1 | Global Mean Bias: 51.61 · Rmse: 303.73 |
| INM-CM5-0/r1i1p1f1 | Global Mean Bias: -76.65 · Rmse: 182.48 |
| MRI-ESM2-0/r1i1p1f1 | Global Mean Bias: 8.74 · Rmse: 187.25 |
Summary high
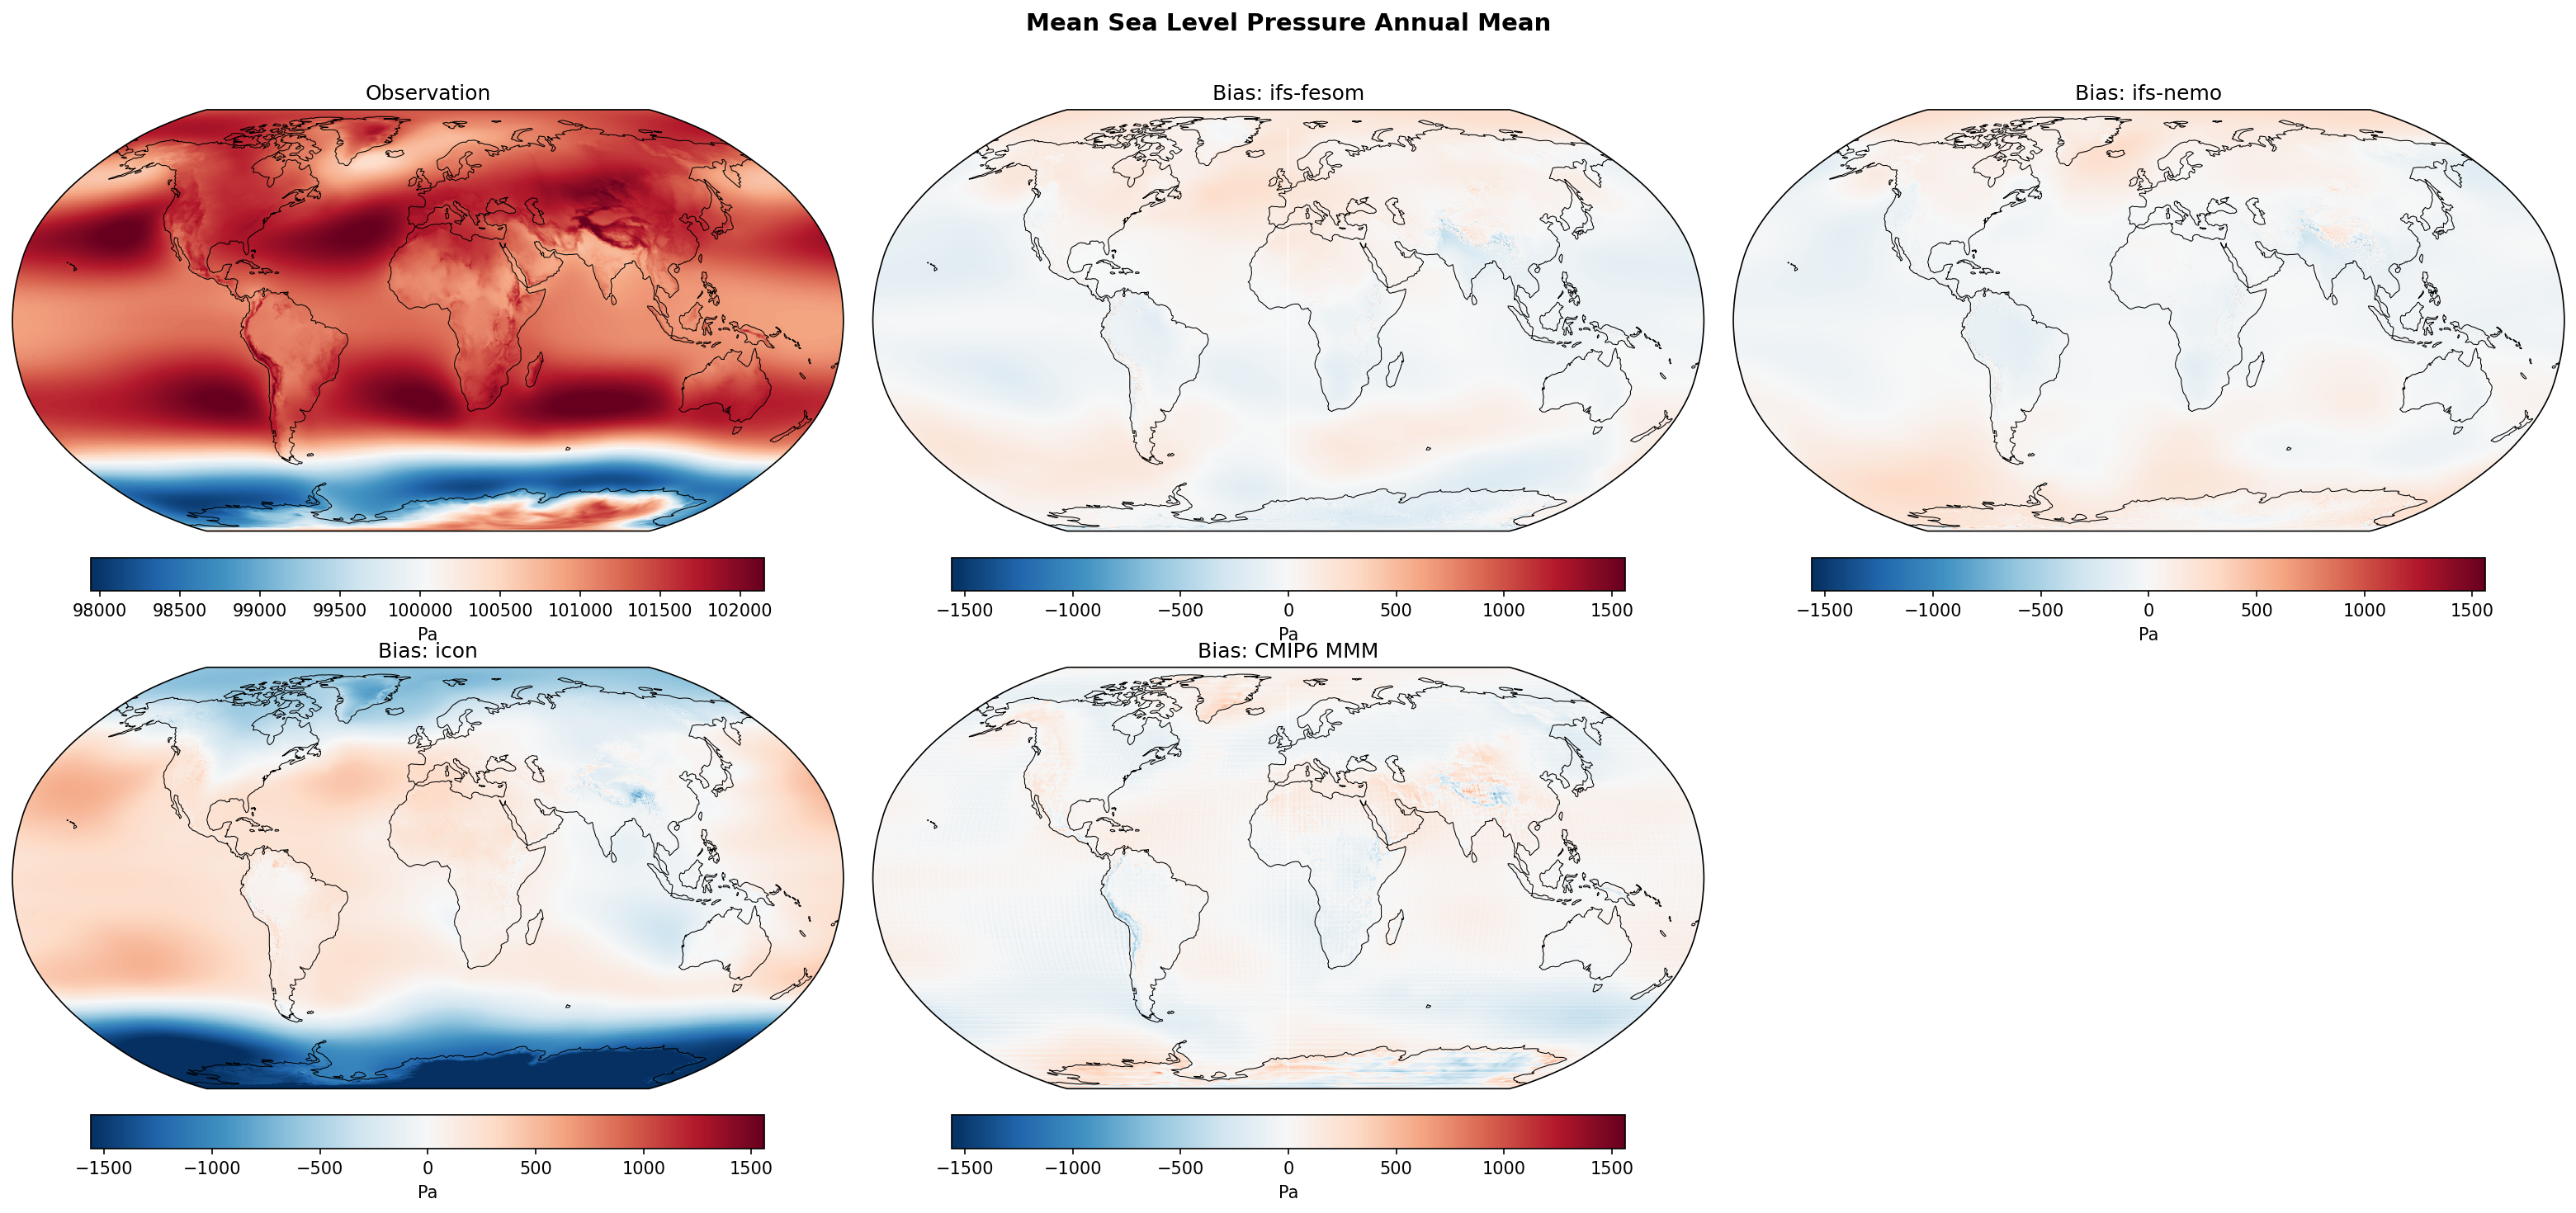
Annual mean Mean Sea Level Pressure (MSLP) biases reveal excellent performance by the IFS-based high-resolution models, but highlight severe, large-scale circulation biases in the ICON model compared to ERA5.
Key Findings
- The ICON model exhibits severe MSLP biases (RMSE ~483 Pa), characterized by an excessively deep Antarctic circumpolar trough and overly intense subtropical highs.
- IFS-NEMO and IFS-FESOM perform exceptionally well, with global RMSEs (~86 Pa and ~97 Pa, respectively) that are comparable to or slightly better than the CMIP6 multi-model mean (~89 Pa).
- Both IFS models and the CMIP6 MMM share a slight positive bias over the Southern Ocean, suggesting a minor underestimation of the depth of the subpolar lows in these models.
Spatial Patterns
The observation map shows the classic global MSLP distribution, including the subtropical high-pressure belts and deep subpolar lows. The ICON bias map is dominated by a massive negative bias (exceeding -1500 Pa or -15 hPa) over the Southern Ocean and Arctic, flanked by widespread positive biases (+500 to +1000 Pa) in the mid-latitudes and subtropics of both hemispheres. In contrast, the IFS-NEMO, IFS-FESOM, and CMIP6 MMM bias maps are predominantly neutral, with only weak positive anomalies over the Southern Ocean and localized topographic artifacts.
Model Agreement
IFS-NEMO and IFS-FESOM show strong agreement with each other and with ERA5, demonstrating that the IFS atmospheric component captures the global mass distribution effectively. The ICON model strongly diverges from the other models and observations, indicating a fundamental issue in its mean-state atmospheric circulation.
Physical Interpretation
The severe bias pattern in ICON—anomalously low pressure in subpolar regions and high pressure in the subtropics—implies an exaggerated meridional pressure gradient. This is likely associated with an overly intense and possibly poleward-shifted eddy-driven jet, excessive mid-latitude storm track activity, or overly strong Hadley cell subsidence. The slight positive biases in the IFS models' Southern Ocean indicate that their simulated storm tracks might be slightly too weak or positioned equatorward relative to ERA5.
Caveats
- MSLP requires extrapolation over high topography (e.g., Himalayas, Antarctica), which can introduce artificial biases; however, the largest biases observed here are over the oceans.
- The global mean biases are relatively small even for ICON, but this masks massive regional compensating errors; spatial RMSE is the more relevant metric for circulation fidelity.
Mean Sea Level Pressure DJF Bias
| Variables | avg_msl |
|---|---|
| Models | ifs-fesom, ifs-nemo, icon, CMIP6 MMM, MPI-ESM1-2-LR/r1i1p1f1, GISS-E2-1-G/r1i1p1f2, IPSL-CM6A-LR/r1i1p1f1, ACCESS-ESM1-5/r1i1p1f1, EC-Earth3/r1i1p1f1, CNRM-CM6-1/r1i1p1f2, AWI-CM-1-1-MR/r1i1p1f1, CNRM-ESM2-1/r1i1p1f2, FGOALS-g3/r1i1p1f1, INM-CM5-0/r1i1p1f1, MRI-ESM2-0/r1i1p1f1 |
| Reference Dataset | ERA5 |
| Units | Pa |
| Period | 1990–2014 |
| CMIP6 MMM | Global Mean Bias: 6.41 · Rmse: None |
| MPI-ESM1-2-LR/r1i1p1f1 | Global Mean Bias: 11.94 · Rmse: None |
| GISS-E2-1-G/r1i1p1f2 | Global Mean Bias: -136.19 · Rmse: None |
| IPSL-CM6A-LR/r1i1p1f1 | Global Mean Bias: 43.05 · Rmse: None |
| ACCESS-ESM1-5/r1i1p1f1 | Global Mean Bias: 46.58 · Rmse: None |
| EC-Earth3/r1i1p1f1 | Global Mean Bias: -9.81 · Rmse: None |
| CNRM-CM6-1/r1i1p1f2 | Global Mean Bias: 20.13 · Rmse: None |
| AWI-CM-1-1-MR/r1i1p1f1 | Global Mean Bias: -3.58 · Rmse: None |
| CNRM-ESM2-1/r1i1p1f2 | Global Mean Bias: 14.70 · Rmse: None |
| FGOALS-g3/r1i1p1f1 | Global Mean Bias: 72.55 · Rmse: None |
| INM-CM5-0/r1i1p1f1 | Global Mean Bias: -62.66 · Rmse: None |
| MRI-ESM2-0/r1i1p1f1 | Global Mean Bias: 20.93 · Rmse: None |
Summary high
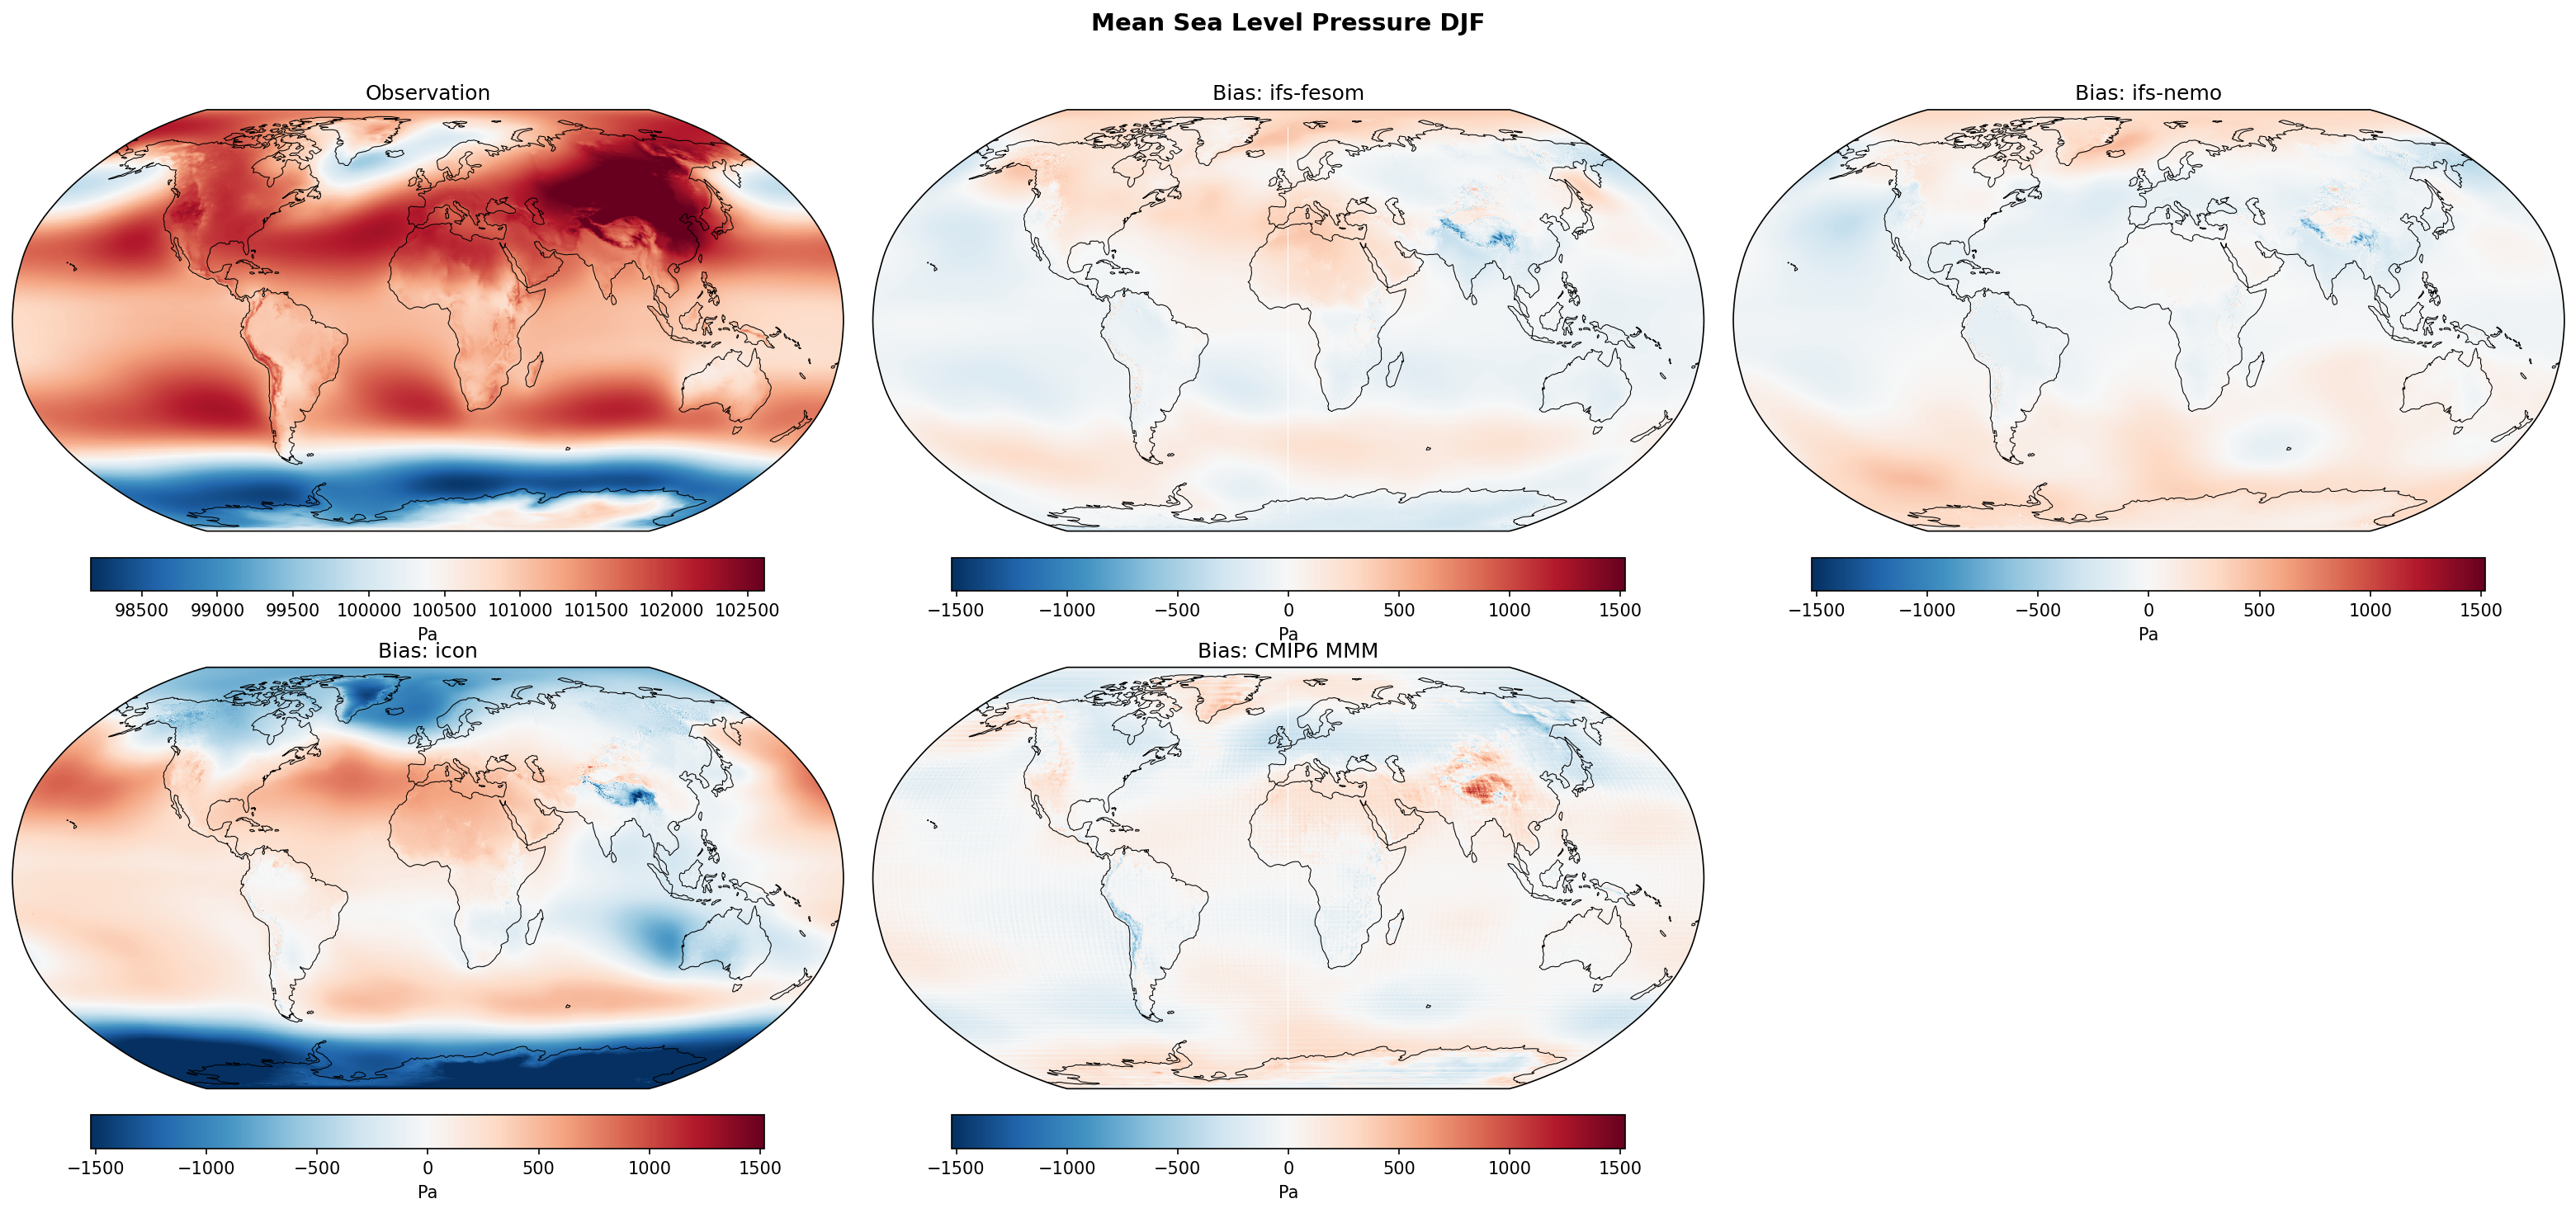
This figure displays the mean sea level pressure (MSLP) bias during the DJF season for three high-resolution models and the CMIP6 multi-model mean compared to ERA5. The IFS-based models show excellent agreement with observations, while ICON exhibits severe large-scale circulation biases.
Key Findings
- IFS-FESOM and IFS-NEMO simulate global DJF MSLP with remarkably high fidelity, showing only minimal biases globally.
- ICON displays a massive systematic bias, with MSLP up to 15 hPa too low over the Southern Ocean and Arctic, and too high over the mid-latitudes.
- The CMIP6 MMM exhibits strong positive MSLP biases over major topographic features (e.g., Tibetan Plateau, Rocky Mountains), a pervasive issue in lower-resolution models that is largely resolved in the high-resolution IFS models.
Spatial Patterns
The observation panel highlights typical DJF features: the strong Siberian and North American Highs, deep Aleutian and Icelandic Lows, and the circumpolar trough in the Southern Ocean. IFS-FESOM and IFS-NEMO show mostly uniform, near-zero biases with only slight deviations near high orography. ICON exhibits a striking, globally coherent bias pattern characterized by extreme negative anomalies over the polar regions (Antarctica/Southern Ocean and the Arctic) and strong positive anomalies over the mid-latitudes of both hemispheres, as well as an anomalous high over the North Pacific.
Model Agreement
There is excellent agreement between the two IFS configurations (FESOM and NEMO) and the ERA5 reanalysis. ICON strongly diverges from both the observations and the other high-resolution models. The DestinE IFS models demonstrate superior performance compared to the CMIP6 MMM, particularly in reducing biases over complex terrain.
Physical Interpretation
The extreme bias pattern in ICON (low polar pressure, high mid-latitude pressure) indicates an overly strong meridional pressure gradient. This implies that the model's large-scale atmospheric circulation is trapped in an overly strong positive annular mode state (SAM in the south, NAM in the north), leading to exaggerated mid-latitude westerly winds. The pronounced positive biases over high topography in the CMIP6 MMM reflect the limitations of coarse resolution in resolving terrain and the associated artifacts introduced when extrapolating surface pressure to sea level; the ~5km resolution of the IFS models effectively mitigates this issue.
Caveats
- Mean sea level pressure is an extrapolated variable over land, and biases over high topography (like the Himalayas and Andes) are highly sensitive to the extrapolation method and model sub-grid orography.
- These biases represent the DJF season only; the severe circulation biases seen in ICON may exhibit strong seasonality.
Mean Sea Level Pressure JJA Bias
| Variables | avg_msl |
|---|---|
| Models | ifs-fesom, ifs-nemo, icon, CMIP6 MMM, MPI-ESM1-2-LR/r1i1p1f1, GISS-E2-1-G/r1i1p1f2, IPSL-CM6A-LR/r1i1p1f1, ACCESS-ESM1-5/r1i1p1f1, EC-Earth3/r1i1p1f1, CNRM-CM6-1/r1i1p1f2, AWI-CM-1-1-MR/r1i1p1f1, CNRM-ESM2-1/r1i1p1f2, FGOALS-g3/r1i1p1f1, INM-CM5-0/r1i1p1f1, MRI-ESM2-0/r1i1p1f1 |
| Reference Dataset | ERA5 |
| Units | Pa |
| Period | 1990–2014 |
| CMIP6 MMM | Global Mean Bias: -14.96 · Rmse: None |
| MPI-ESM1-2-LR/r1i1p1f1 | Global Mean Bias: -32.13 · Rmse: None |
| GISS-E2-1-G/r1i1p1f2 | Global Mean Bias: -157.69 · Rmse: None |
| IPSL-CM6A-LR/r1i1p1f1 | Global Mean Bias: 22.31 · Rmse: None |
| ACCESS-ESM1-5/r1i1p1f1 | Global Mean Bias: 30.32 · Rmse: None |
| EC-Earth3/r1i1p1f1 | Global Mean Bias: -15.56 · Rmse: None |
| CNRM-CM6-1/r1i1p1f2 | Global Mean Bias: 16.04 · Rmse: None |
| AWI-CM-1-1-MR/r1i1p1f1 | Global Mean Bias: -46.42 · Rmse: None |
| CNRM-ESM2-1/r1i1p1f2 | Global Mean Bias: 13.20 · Rmse: None |
| FGOALS-g3/r1i1p1f1 | Global Mean Bias: 27.40 · Rmse: None |
| INM-CM5-0/r1i1p1f1 | Global Mean Bias: -97.45 · Rmse: None |
| MRI-ESM2-0/r1i1p1f1 | Global Mean Bias: -7.52 · Rmse: None |
Summary high
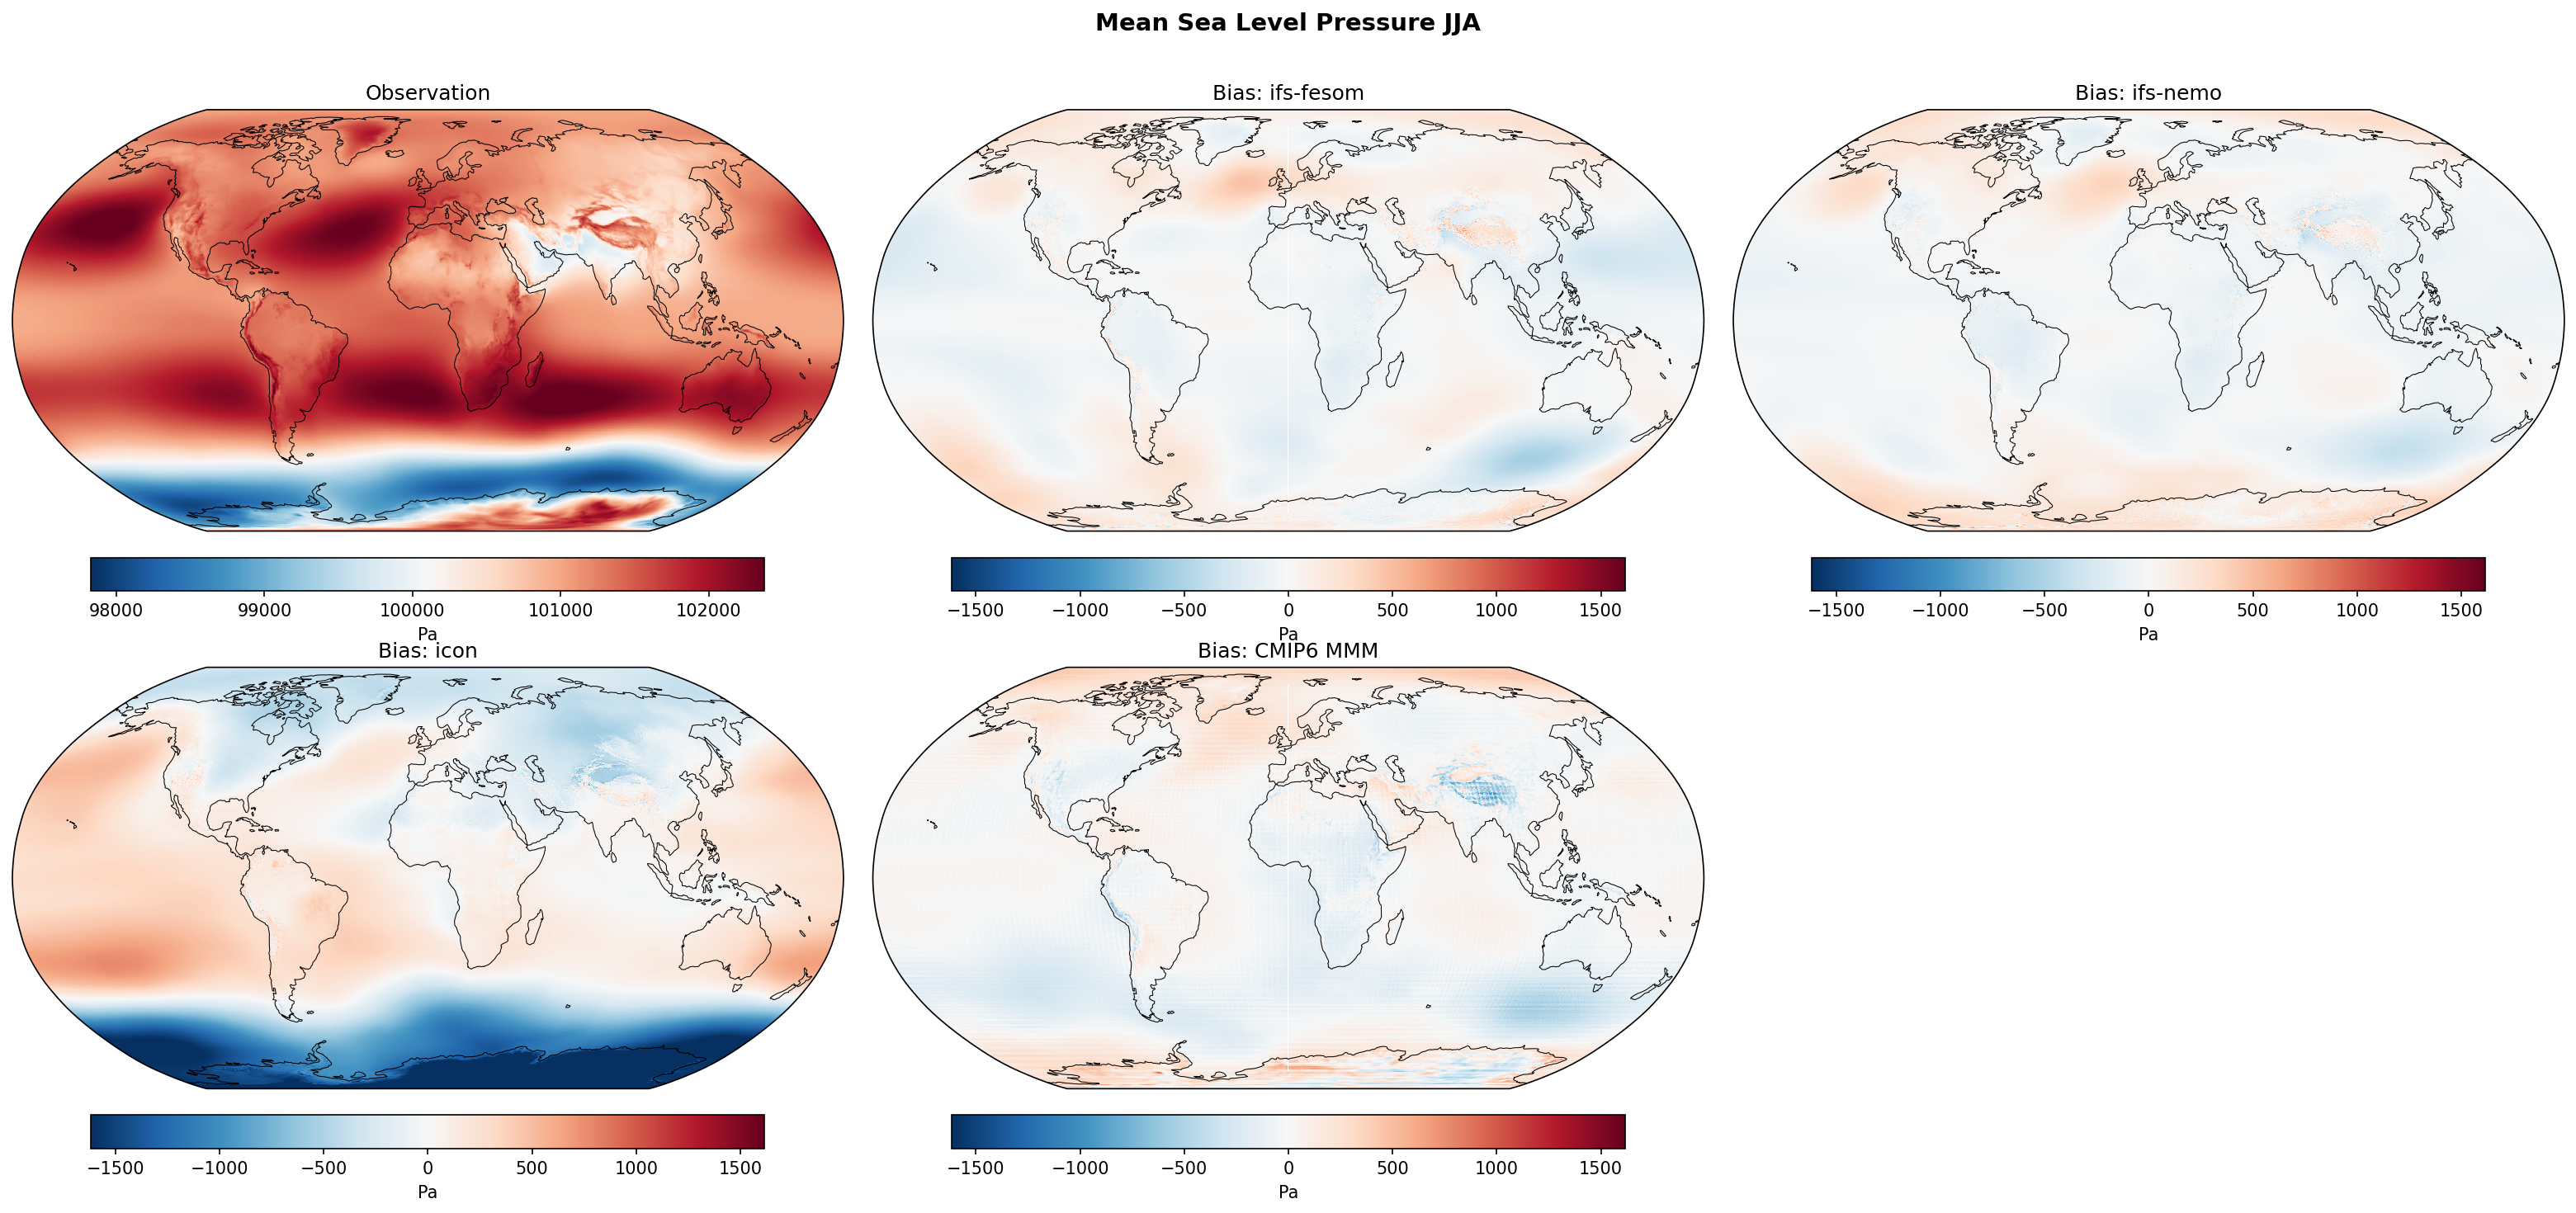
The figure presents the June-July-August (JJA) Mean Sea Level Pressure (MSLP) climatology from ERA5 and corresponding bias maps for three high-resolution DestinE models (ifs-fesom, ifs-nemo, icon) and the CMIP6 multi-model mean.
Key Findings
- ICON exhibits a severe negative MSLP bias (exceeding -15 hPa) over the Southern Ocean, coupled with positive biases in the subtropics, indicating a drastically exaggerated meridional pressure gradient.
- ifs-nemo demonstrates the highest fidelity to observations among the high-resolution models, with very weak biases globally, performing on par with or better than the CMIP6 MMM.
- ifs-fesom shares a similar spatial bias structure to ICON (positive in subtropical highs, negative in the Southern Ocean) but with much smaller magnitudes.
Spatial Patterns
Observations show characteristic JJA features: strong subtropical highs in the Northern Hemisphere (Azores, North Pacific) and Southern Hemisphere, alongside the deep Southern Ocean circumpolar trough. ICON's bias map is dominated by an anomalously deep circumpolar trough (dark blue) and anomalously strong subtropical highs (red). ifs-fesom shows a muted version of this pattern, while ifs-nemo is mostly white (near-zero bias) aside from minor positive anomalies in the North Pacific and South Pacific.
Model Agreement
There is significant divergence among the high-resolution models. While ifs-nemo aligns closely with ERA5, ICON deviates substantially, producing errors far larger than the CMIP6 MMM. ifs-fesom sits between the two, sharing structural errors with ICON but at manageable amplitudes. The CMIP6 MMM shows characteristic low bias due to inter-model error cancellation.
Physical Interpretation
The extreme negative Southern Ocean MSLP bias in ICON implies a vastly overestimated circumpolar trough, which is directly tied to an overly intense or excessively poleward-shifted Southern Hemisphere westerly jet. The concurrent positive biases in subtropical ocean basins in ICON and ifs-fesom suggest that the subtropical anticyclones (associated with the descending branch of the Hadley circulation) are systematically too strong in these models during JJA.
Caveats
- The CMIP6 MMM benefits from error cancellation, making it a mathematically smoother baseline than any single high-resolution realization.
- Sea level pressure over high topography (e.g., Antarctica, Himalayas) involves extrapolation techniques, making biases in these specific regions less physically meaningful.
Surface Downwelling Longwave Annual Mean Bias
| Variables | avg_sdlwrf |
|---|---|
| Models | ifs-fesom, ifs-nemo, icon, CMIP6 MMM, MPI-ESM1-2-LR/r1i1p1f1, GISS-E2-1-G/r1i1p1f2, IPSL-CM6A-LR/r1i1p1f1, ACCESS-ESM1-5/r1i1p1f1, EC-Earth3/r1i1p1f1, CNRM-CM6-1/r1i1p1f2, AWI-CM-1-1-MR/r1i1p1f1, CNRM-ESM2-1/r1i1p1f2, FGOALS-g3/r1i1p1f1, INM-CM5-0/r1i1p1f1, MRI-ESM2-0/r1i1p1f1 |
| Reference Dataset | ERA5 |
| Units | W/m2 |
| Period | 1990–2014 |
| ifs-fesom | Global Mean Bias: 2.40 · Rmse: 6.50 |
| ifs-nemo | Global Mean Bias: 0.46 · Rmse: 5.00 |
| icon | Global Mean Bias: 0.84 · Rmse: 11.04 |
| CMIP6 MMM | Global Mean Bias: 1.42 · Rmse: 6.45 |
| MPI-ESM1-2-LR/r1i1p1f1 | Global Mean Bias: 4.18 · Rmse: 12.00 |
| GISS-E2-1-G/r1i1p1f2 | Global Mean Bias: 9.74 · Rmse: 16.26 |
| IPSL-CM6A-LR/r1i1p1f1 | Global Mean Bias: 4.42 · Rmse: 12.11 |
| ACCESS-ESM1-5/r1i1p1f1 | Global Mean Bias: 6.35 · Rmse: 10.75 |
| EC-Earth3/r1i1p1f1 | Global Mean Bias: 0.20 · Rmse: 9.23 |
| CNRM-CM6-1/r1i1p1f2 | Global Mean Bias: -3.20 · Rmse: 8.35 |
| AWI-CM-1-1-MR/r1i1p1f1 | Global Mean Bias: 4.30 · Rmse: 9.95 |
| CNRM-ESM2-1/r1i1p1f2 | Global Mean Bias: 0.23 · Rmse: 7.90 |
| FGOALS-g3/r1i1p1f1 | Global Mean Bias: -6.08 · Rmse: 13.11 |
| INM-CM5-0/r1i1p1f1 | Global Mean Bias: -5.23 · Rmse: 11.25 |
| MRI-ESM2-0/r1i1p1f1 | Global Mean Bias: 2.75 · Rmse: 8.47 |
Summary high
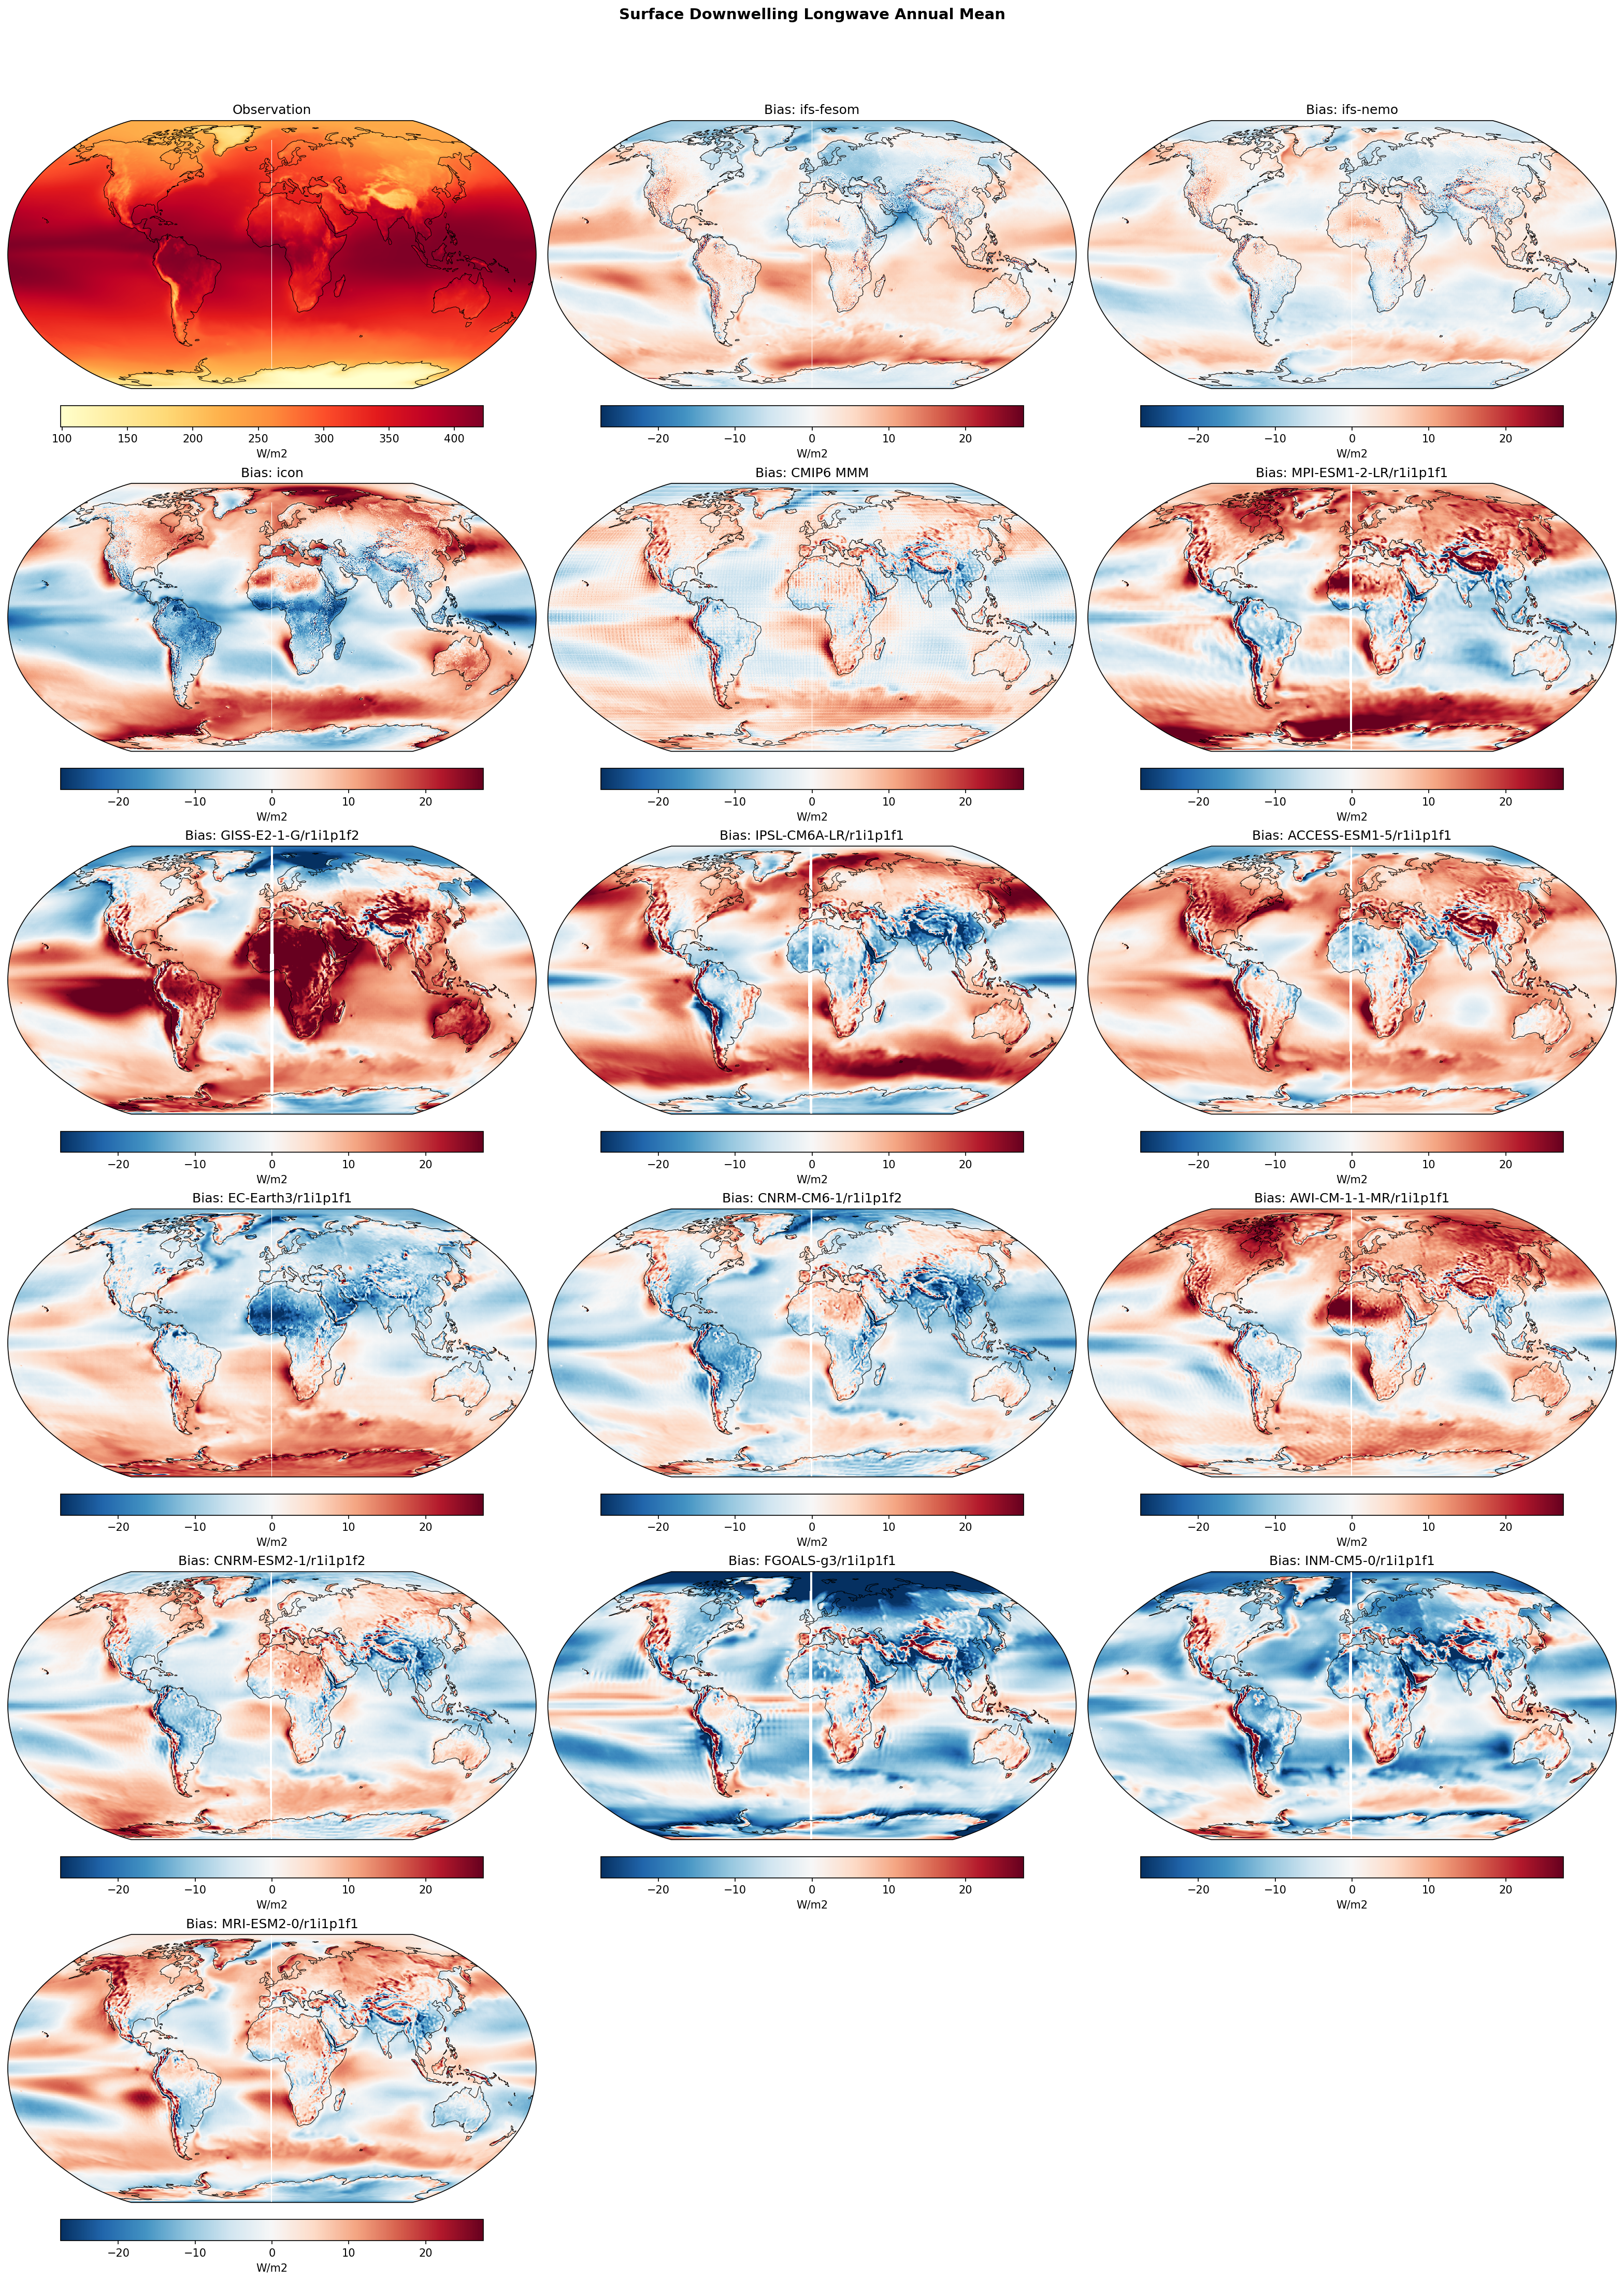
Annual mean surface downwelling longwave radiation bias maps evaluate the performance of high-resolution DestinE models (IFS-FESOM, IFS-NEMO, ICON) against the CMIP6 ensemble, individual CMIP6 models, and ERA5 reanalysis.
Key Findings
- IFS-NEMO is the highest-performing model, exhibiting the lowest RMSE (4.80 W/m2) and a near-zero global mean bias (0.15 W/m2) with exceptionally clean spatial error distribution.
- High-resolution DestinE models (particularly the IFS suite) successfully eliminate severe topography-related biases over mountain ranges (e.g., Himalayas, Andes) that are prominent in the CMIP6 multi-model mean.
- ICON shows a low global mean bias (0.53 W/m2) but high RMSE (10.85 W/m2), driven by strong compensating regional errors, such as negative biases over tropical landmasses and positive biases over subtropical oceans.
Spatial Patterns
CMIP6 MMM and several individual CMIP6 models feature strong negative biases localized over complex topography (Himalayas, Andes, Rockies) and positive biases across stratocumulus-dominated ocean basins and the Southern Ocean. ICON displays intense negative biases over the Amazon, Congo, and Arctic, offset by broad positive biases over the Southern Ocean and eastern boundary upwelling systems. IFS-NEMO and IFS-FESOM largely lack these distinct structural biases, showing only mild positive anomalies over the Southern Ocean.
Model Agreement
There is massive inter-model disagreement among individual CMIP6 models, with global mean biases ranging from +9.38 W/m2 (GISS-E2-1-G) to -6.45 W/m2 (FGOALS-g3). The IFS-based DestinE models demonstrate much closer agreement with ERA5 observations. ICON's spatial error variance is comparable to individual CMIP6 models, whereas the CMIP6 MMM achieves a moderate RMSE (6.29 W/m2) primarily through error cancellation rather than physical fidelity.
Physical Interpretation
Surface downwelling longwave radiation is primarily governed by lower-tropospheric temperature, specific humidity, and the fraction/base height of low clouds. The dramatic reduction of topographic biases in DestinE models is a direct physical consequence of the ~5 km resolution realistically resolving terrain and local boundary-layer thermodynamics. Persistent positive biases in the Southern Ocean across many models (including ICON and CMIP6 MMM) point to ubiquitous GCM struggles with supercooled liquid water and mixed-phase cloud radiative effects.
Caveats
- The 'observational' reference (ERA5) is a reanalysis product wherein surface radiative fluxes are derived from parameterized cloud microphysics and radiation schemes, introducing inherent baseline uncertainty.
- Despite the ~5 km grid spacing, shallow convection and boundary-layer clouds remain parameterized or in the 'gray zone,' meaning resolution alone cannot completely resolve low-cloud radiative biases.
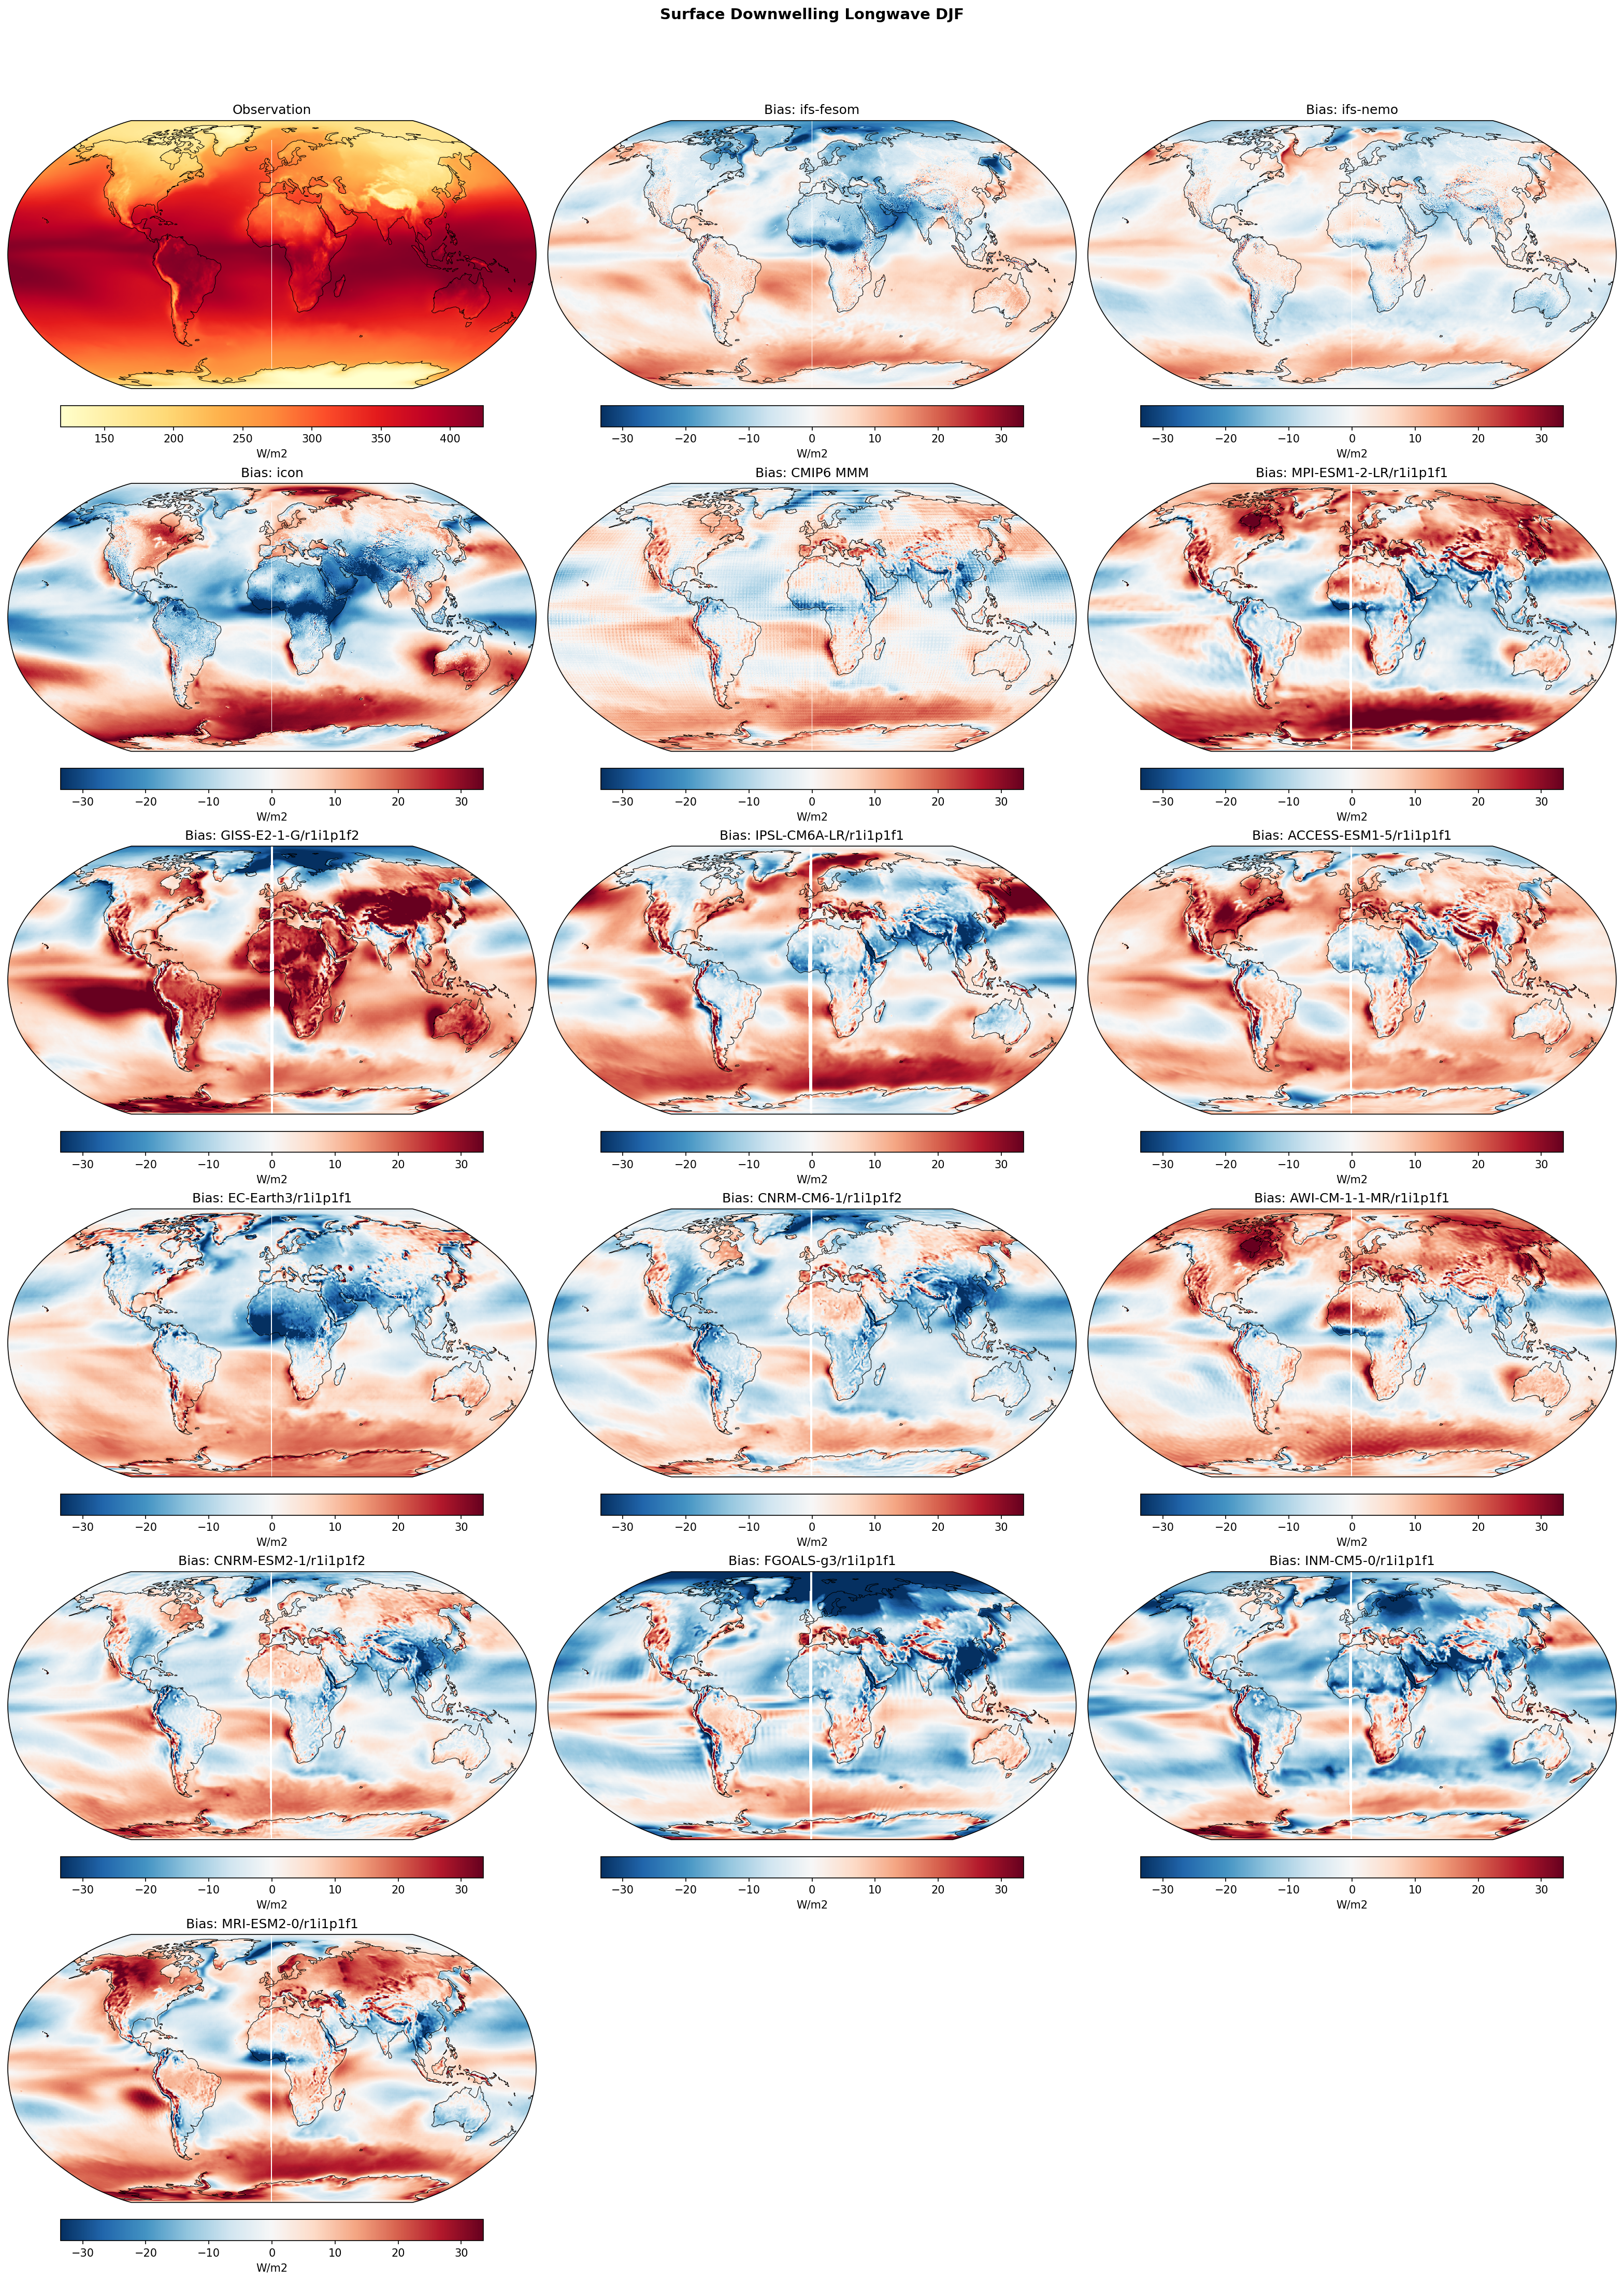
Surface Downwelling Longwave DJF Bias
| Variables | avg_sdlwrf |
|---|---|
| Models | ifs-fesom, ifs-nemo, icon, CMIP6 MMM, MPI-ESM1-2-LR/r1i1p1f1, GISS-E2-1-G/r1i1p1f2, IPSL-CM6A-LR/r1i1p1f1, ACCESS-ESM1-5/r1i1p1f1, EC-Earth3/r1i1p1f1, CNRM-CM6-1/r1i1p1f2, AWI-CM-1-1-MR/r1i1p1f1, CNRM-ESM2-1/r1i1p1f2, FGOALS-g3/r1i1p1f1, INM-CM5-0/r1i1p1f1, MRI-ESM2-0/r1i1p1f1 |
| Reference Dataset | ERA5 |
| Units | W/m2 |
| Period | 1990–2014 |
| CMIP6 MMM | Global Mean Bias: 1.91 · Rmse: None |
| MPI-ESM1-2-LR/r1i1p1f1 | Global Mean Bias: 4.33 · Rmse: None |
| GISS-E2-1-G/r1i1p1f2 | Global Mean Bias: 11.46 · Rmse: None |
| IPSL-CM6A-LR/r1i1p1f1 | Global Mean Bias: 4.06 · Rmse: None |
| ACCESS-ESM1-5/r1i1p1f1 | Global Mean Bias: 6.58 · Rmse: None |
| EC-Earth3/r1i1p1f1 | Global Mean Bias: 0.92 · Rmse: None |
| CNRM-CM6-1/r1i1p1f2 | Global Mean Bias: -2.92 · Rmse: None |
| AWI-CM-1-1-MR/r1i1p1f1 | Global Mean Bias: 4.44 · Rmse: None |
| CNRM-ESM2-1/r1i1p1f2 | Global Mean Bias: 0.38 · Rmse: None |
| FGOALS-g3/r1i1p1f1 | Global Mean Bias: -5.21 · Rmse: None |
| INM-CM5-0/r1i1p1f1 | Global Mean Bias: -5.17 · Rmse: None |
| MRI-ESM2-0/r1i1p1f1 | Global Mean Bias: 4.55 · Rmse: None |
Summary high
This figure evaluates spatial biases in DJF surface downwelling longwave radiation (SDLWRF) climatology for high-resolution DestinE models (IFS-FESOM, IFS-NEMO, ICON) and various CMIP6 models against ERA5 reanalysis.
Key Findings
- All three DestinE models exhibit widespread positive biases over the Southern Ocean and Northern Hemisphere ocean storm tracks, a prevalent feature also seen in the CMIP6 multi-model mean.
- IFS-FESOM and IFS-NEMO show highly consistent spatial bias patterns, dominated by negative biases over Northern Hemisphere landmasses and positive biases over oceans.
- ICON displays distinctly stronger negative biases over major arid and semi-arid land regions (e.g., Sahara, Middle East, India) compared to the IFS-based models.
- Individual CMIP6 models demonstrate a much wider spread in bias magnitude and sign globally, whereas the high-resolution DestinE models are more constrained but still share structural errors over key regions.
Spatial Patterns
Prominent positive biases (10-30 W/m2) occur over the Southern Ocean (40°S-70°S), the North Pacific, and North Atlantic in almost all models. Negative biases dominate over Northern Hemisphere continents (Eurasia, North America) during the DJF winter season. A striking negative bias pattern (-20 to -30 W/m2) is localized over North Africa, the Arabian Peninsula, and South Asia in the ICON model, which is much less pronounced in the IFS models or the CMIP6 MMM.
Model Agreement
There is robust inter-model agreement across both DestinE and CMIP6 ensembles regarding the positive SDLWRF bias over the Southern Ocean, indicating a persistent structural challenge. The IFS-FESOM and IFS-NEMO models agree strongly with each other globally. However, agreement is poor over land areas across the broader CMIP6 ensemble, with models like GISS and ACCESS showing massive positive biases, while FGOALS and INM show extensive negative biases.
Physical Interpretation
Surface downwelling longwave radiation is primarily governed by lower tropospheric temperature, water vapor, and cloud base properties. The ubiquitous positive biases over the Southern Ocean are frequently linked to model struggles with marine boundary layer clouds—specifically, an overestimation of cloud fraction or excessive supercooled liquid water, which is more optically thick in the longwave spectrum than ice. Negative biases over wintertime Northern Hemisphere landmasses suggest a cold/dry lower troposphere bias or an underestimation of cloud cover (too frequent clear-sky conditions). ICON's severe negative bias over arid regions may stem from lower tropospheric dry biases or underrepresented longwave emission from dust aerosols compared to the ERA5 reanalysis system.
Caveats
- Surface radiative fluxes in ERA5 are parameterized model outputs rather than direct assimilations, meaning the 'observation' itself contains reanalysis model biases, particularly over the Southern Ocean where ground truth data is sparse.
- The CMIP6 Multi-Model Mean (MMM) masks substantial compensating errors from individual models, making it appear smoother and potentially artificially superior to individual high-resolution runs.
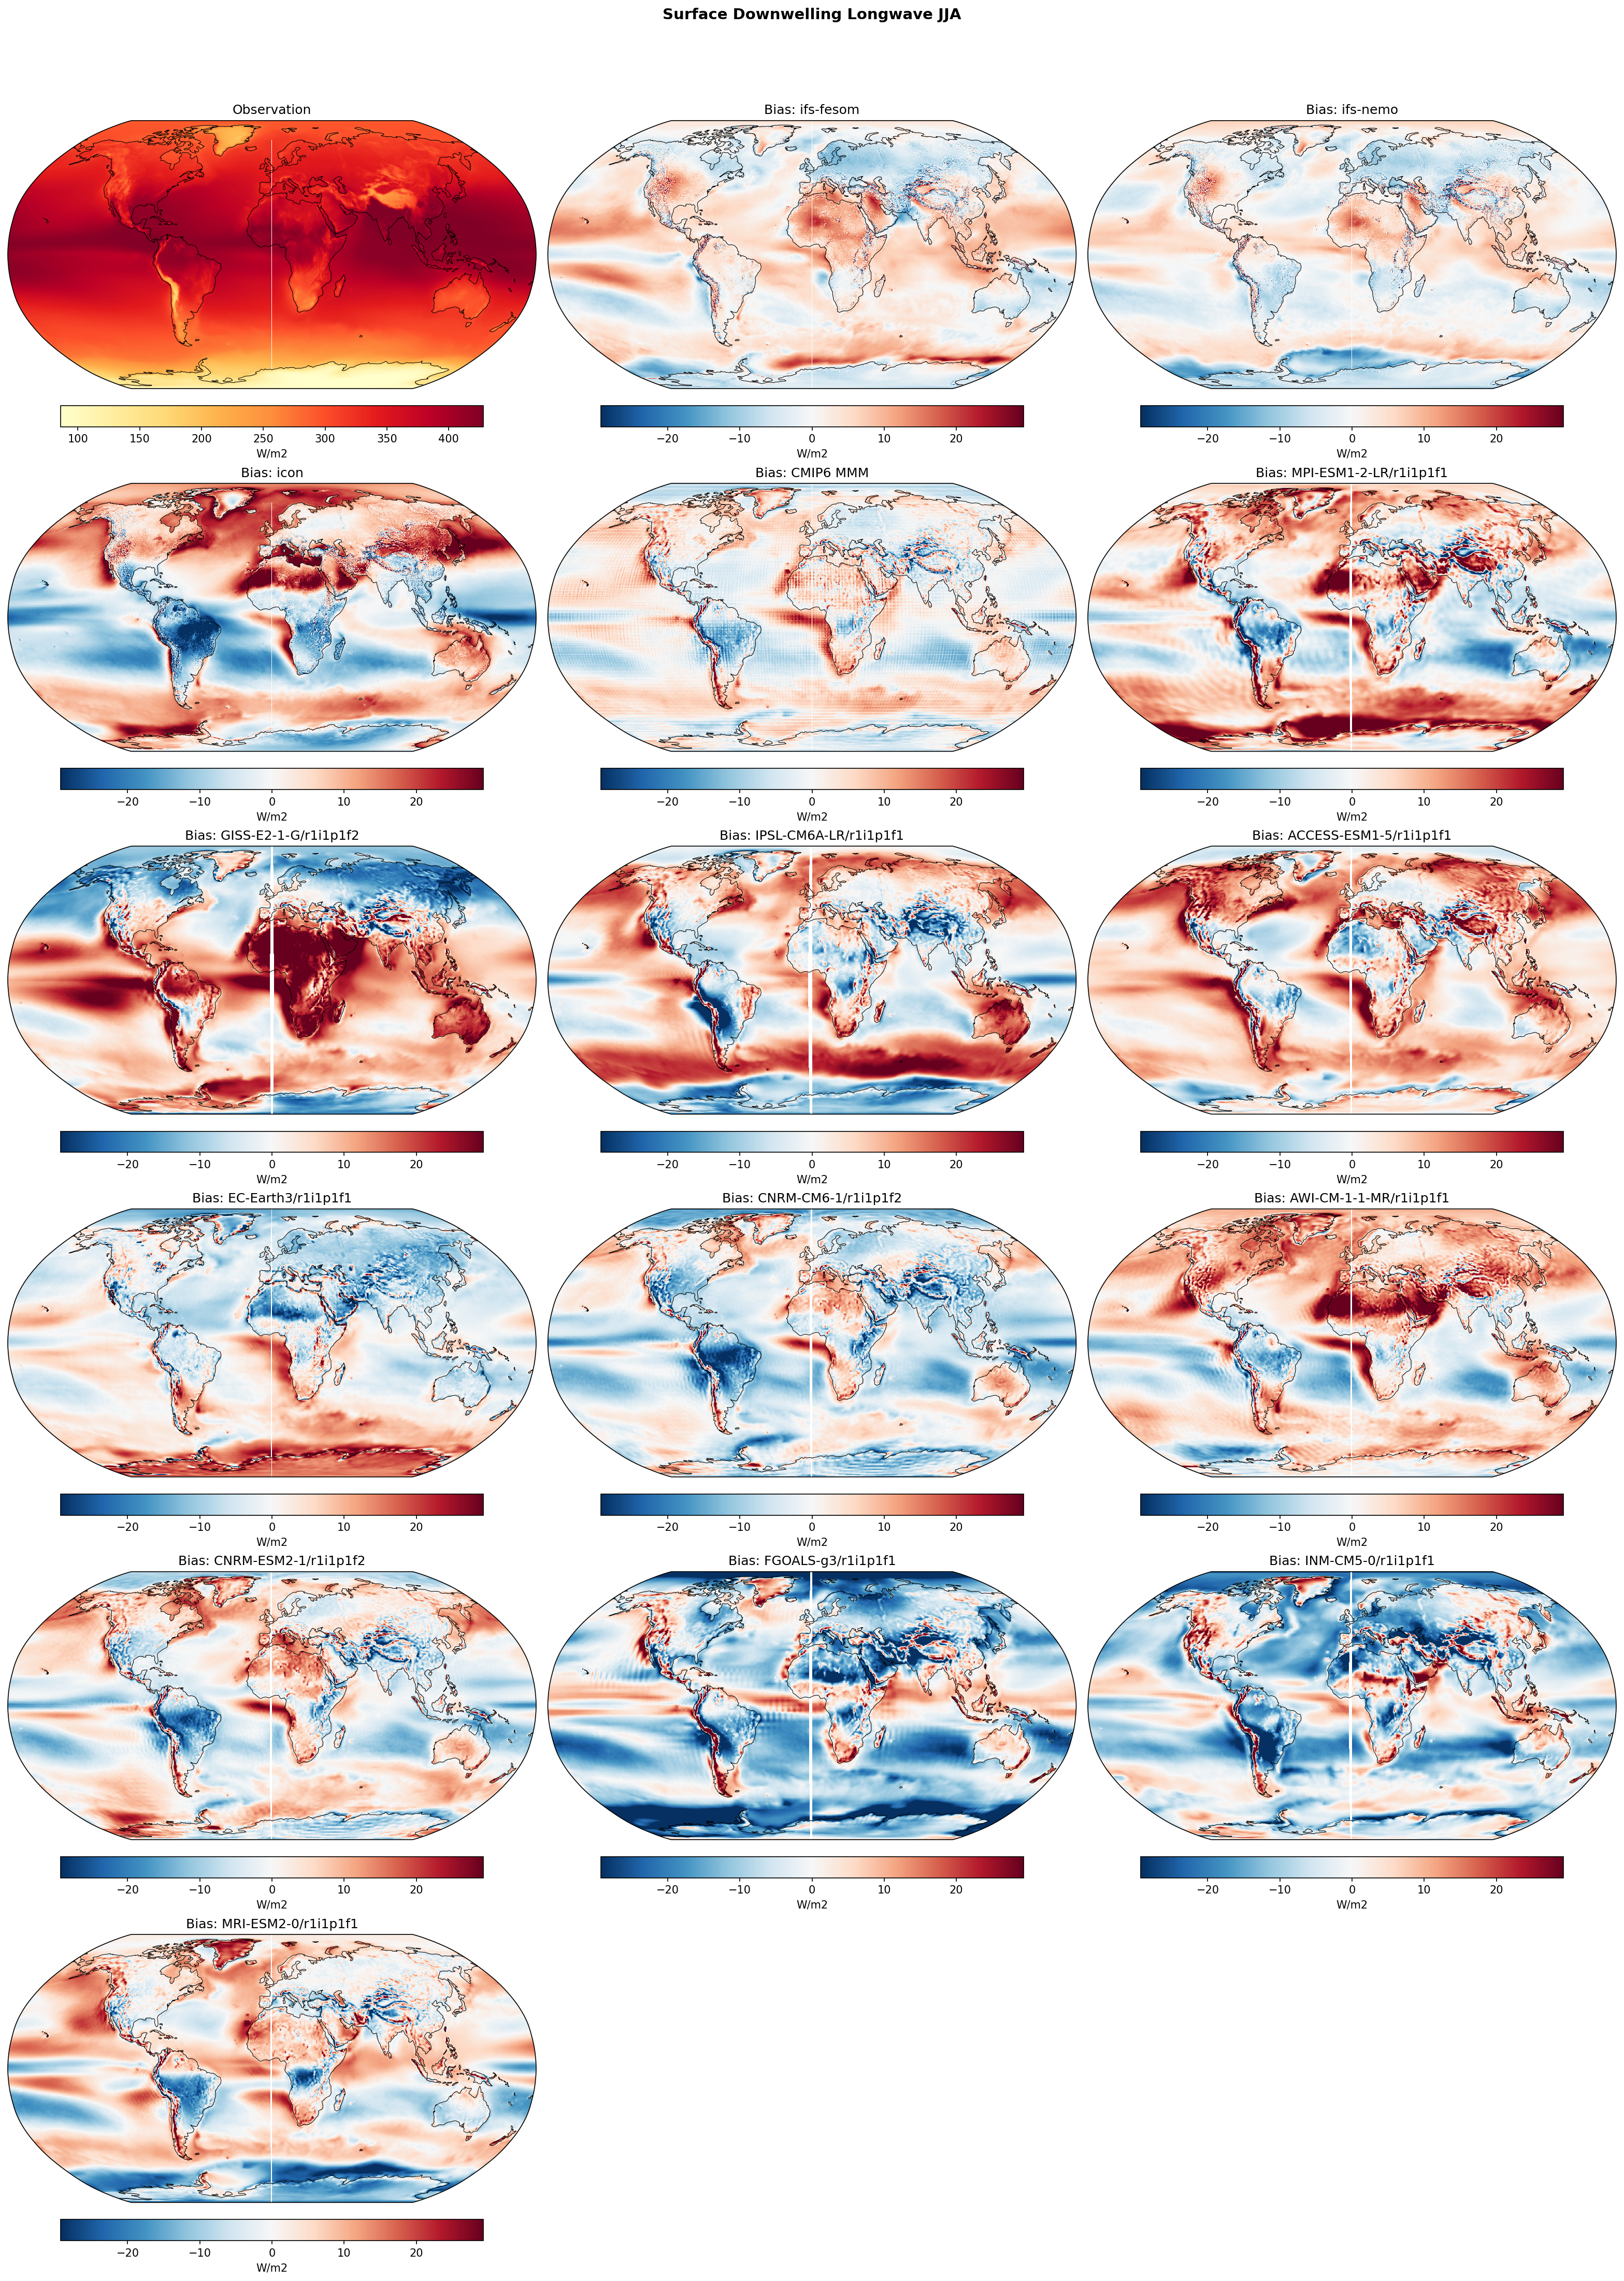
Surface Downwelling Longwave JJA Bias
| Variables | avg_sdlwrf |
|---|---|
| Models | ifs-fesom, ifs-nemo, icon, CMIP6 MMM, MPI-ESM1-2-LR/r1i1p1f1, GISS-E2-1-G/r1i1p1f2, IPSL-CM6A-LR/r1i1p1f1, ACCESS-ESM1-5/r1i1p1f1, EC-Earth3/r1i1p1f1, CNRM-CM6-1/r1i1p1f2, AWI-CM-1-1-MR/r1i1p1f1, CNRM-ESM2-1/r1i1p1f2, FGOALS-g3/r1i1p1f1, INM-CM5-0/r1i1p1f1, MRI-ESM2-0/r1i1p1f1 |
| Reference Dataset | ERA5 |
| Units | W/m2 |
| Period | 1990–2014 |
| CMIP6 MMM | Global Mean Bias: 0.97 · Rmse: None |
| MPI-ESM1-2-LR/r1i1p1f1 | Global Mean Bias: 3.97 · Rmse: None |
| GISS-E2-1-G/r1i1p1f2 | Global Mean Bias: 7.52 · Rmse: None |
| IPSL-CM6A-LR/r1i1p1f1 | Global Mean Bias: 3.52 · Rmse: None |
| ACCESS-ESM1-5/r1i1p1f1 | Global Mean Bias: 6.14 · Rmse: None |
| EC-Earth3/r1i1p1f1 | Global Mean Bias: -0.12 · Rmse: None |
| CNRM-CM6-1/r1i1p1f2 | Global Mean Bias: -3.38 · Rmse: None |
| AWI-CM-1-1-MR/r1i1p1f1 | Global Mean Bias: 4.11 · Rmse: None |
| CNRM-ESM2-1/r1i1p1f2 | Global Mean Bias: 0.26 · Rmse: None |
| FGOALS-g3/r1i1p1f1 | Global Mean Bias: -6.68 · Rmse: None |
| INM-CM5-0/r1i1p1f1 | Global Mean Bias: -5.15 · Rmse: None |
| MRI-ESM2-0/r1i1p1f1 | Global Mean Bias: 1.63 · Rmse: None |
Summary high
This figure evaluates the JJA climatological biases of surface downwelling longwave radiation for high-resolution DestinE models (IFS-FESOM, IFS-NEMO, ICON), the CMIP6 multi-model mean, and individual CMIP6 models compared to ERA5 reanalysis.
Key Findings
- IFS-FESOM and IFS-NEMO demonstrate excellent performance, exhibiting substantially smaller regional biases globally compared to both ICON and the traditional CMIP6 models.
- ICON displays pronounced regional biases, including large overestimations over Northern Hemisphere landmasses and the Arctic, and strong underestimations over tropical oceans.
- Many standard-resolution CMIP6 models show large, compensating regional biases, particularly struggling in the Southern Ocean and Arctic regions where low-level cloud representations are traditionally problematic.
Spatial Patterns
IFS models show remarkably flat bias fields, with only slight negative biases (~-10 to -20 W/m2) over the Southern Ocean and slight positive biases in the Arctic. In contrast, ICON exhibits strong positive biases (>20 W/m2) over North America, Eurasia, and the Arctic Ocean during the NH summer, accompanied by strong negative biases over the tropical Atlantic, Indian Ocean, and Maritime Continent. The CMIP6 MMM and individual models show high variance, with many models (e.g., GISS, ACCESS, AWI) showing strong positive biases across the Southern Ocean and others (e.g., FGOALS, INM) showing widespread negative oceanic biases.
Model Agreement
IFS-FESOM and IFS-NEMO are in strong agreement with each other and with the ERA5 baseline, highlighting the potential benefits of their ~5 km resolution and tuned physical parameterizations. ICON diverges significantly from the IFS models, instead sharing some spatial bias patterns (like NH land positive biases) with the CMIP6 MMM, though often with greater magnitude. The individual CMIP6 models show poor inter-model agreement, reflecting diverse structural errors in cloud and boundary-layer schemes.
Physical Interpretation
Surface downwelling longwave radiation is primarily modulated by boundary layer temperature, water vapor content, and the macroscopic/microscopic properties of low-level clouds. The moderate negative biases in the Southern Ocean for the IFS models likely indicate a slight underrepresentation of low cloud fraction or supercooled liquid water content, a persistent challenge in global modeling. Conversely, the strong positive biases over NH land in ICON and several CMIP6 models during summer (JJA) likely stem from excessive low-level cloud cover, overestimation of cloud optical depth, or an overly warm/moist lower troposphere.
Caveats
- ERA5 is used as the observational baseline; however, surface radiative fluxes in reanalyses are heavily dependent on the assimilating model's cloud parameterizations, introducing uncertainty in regions with sparse ground observations (e.g., the Southern Ocean and Arctic).
- Global mean summary statistics for the DestinE models were not provided, requiring reliance on visual interpretation of the spatial compensation of biases.
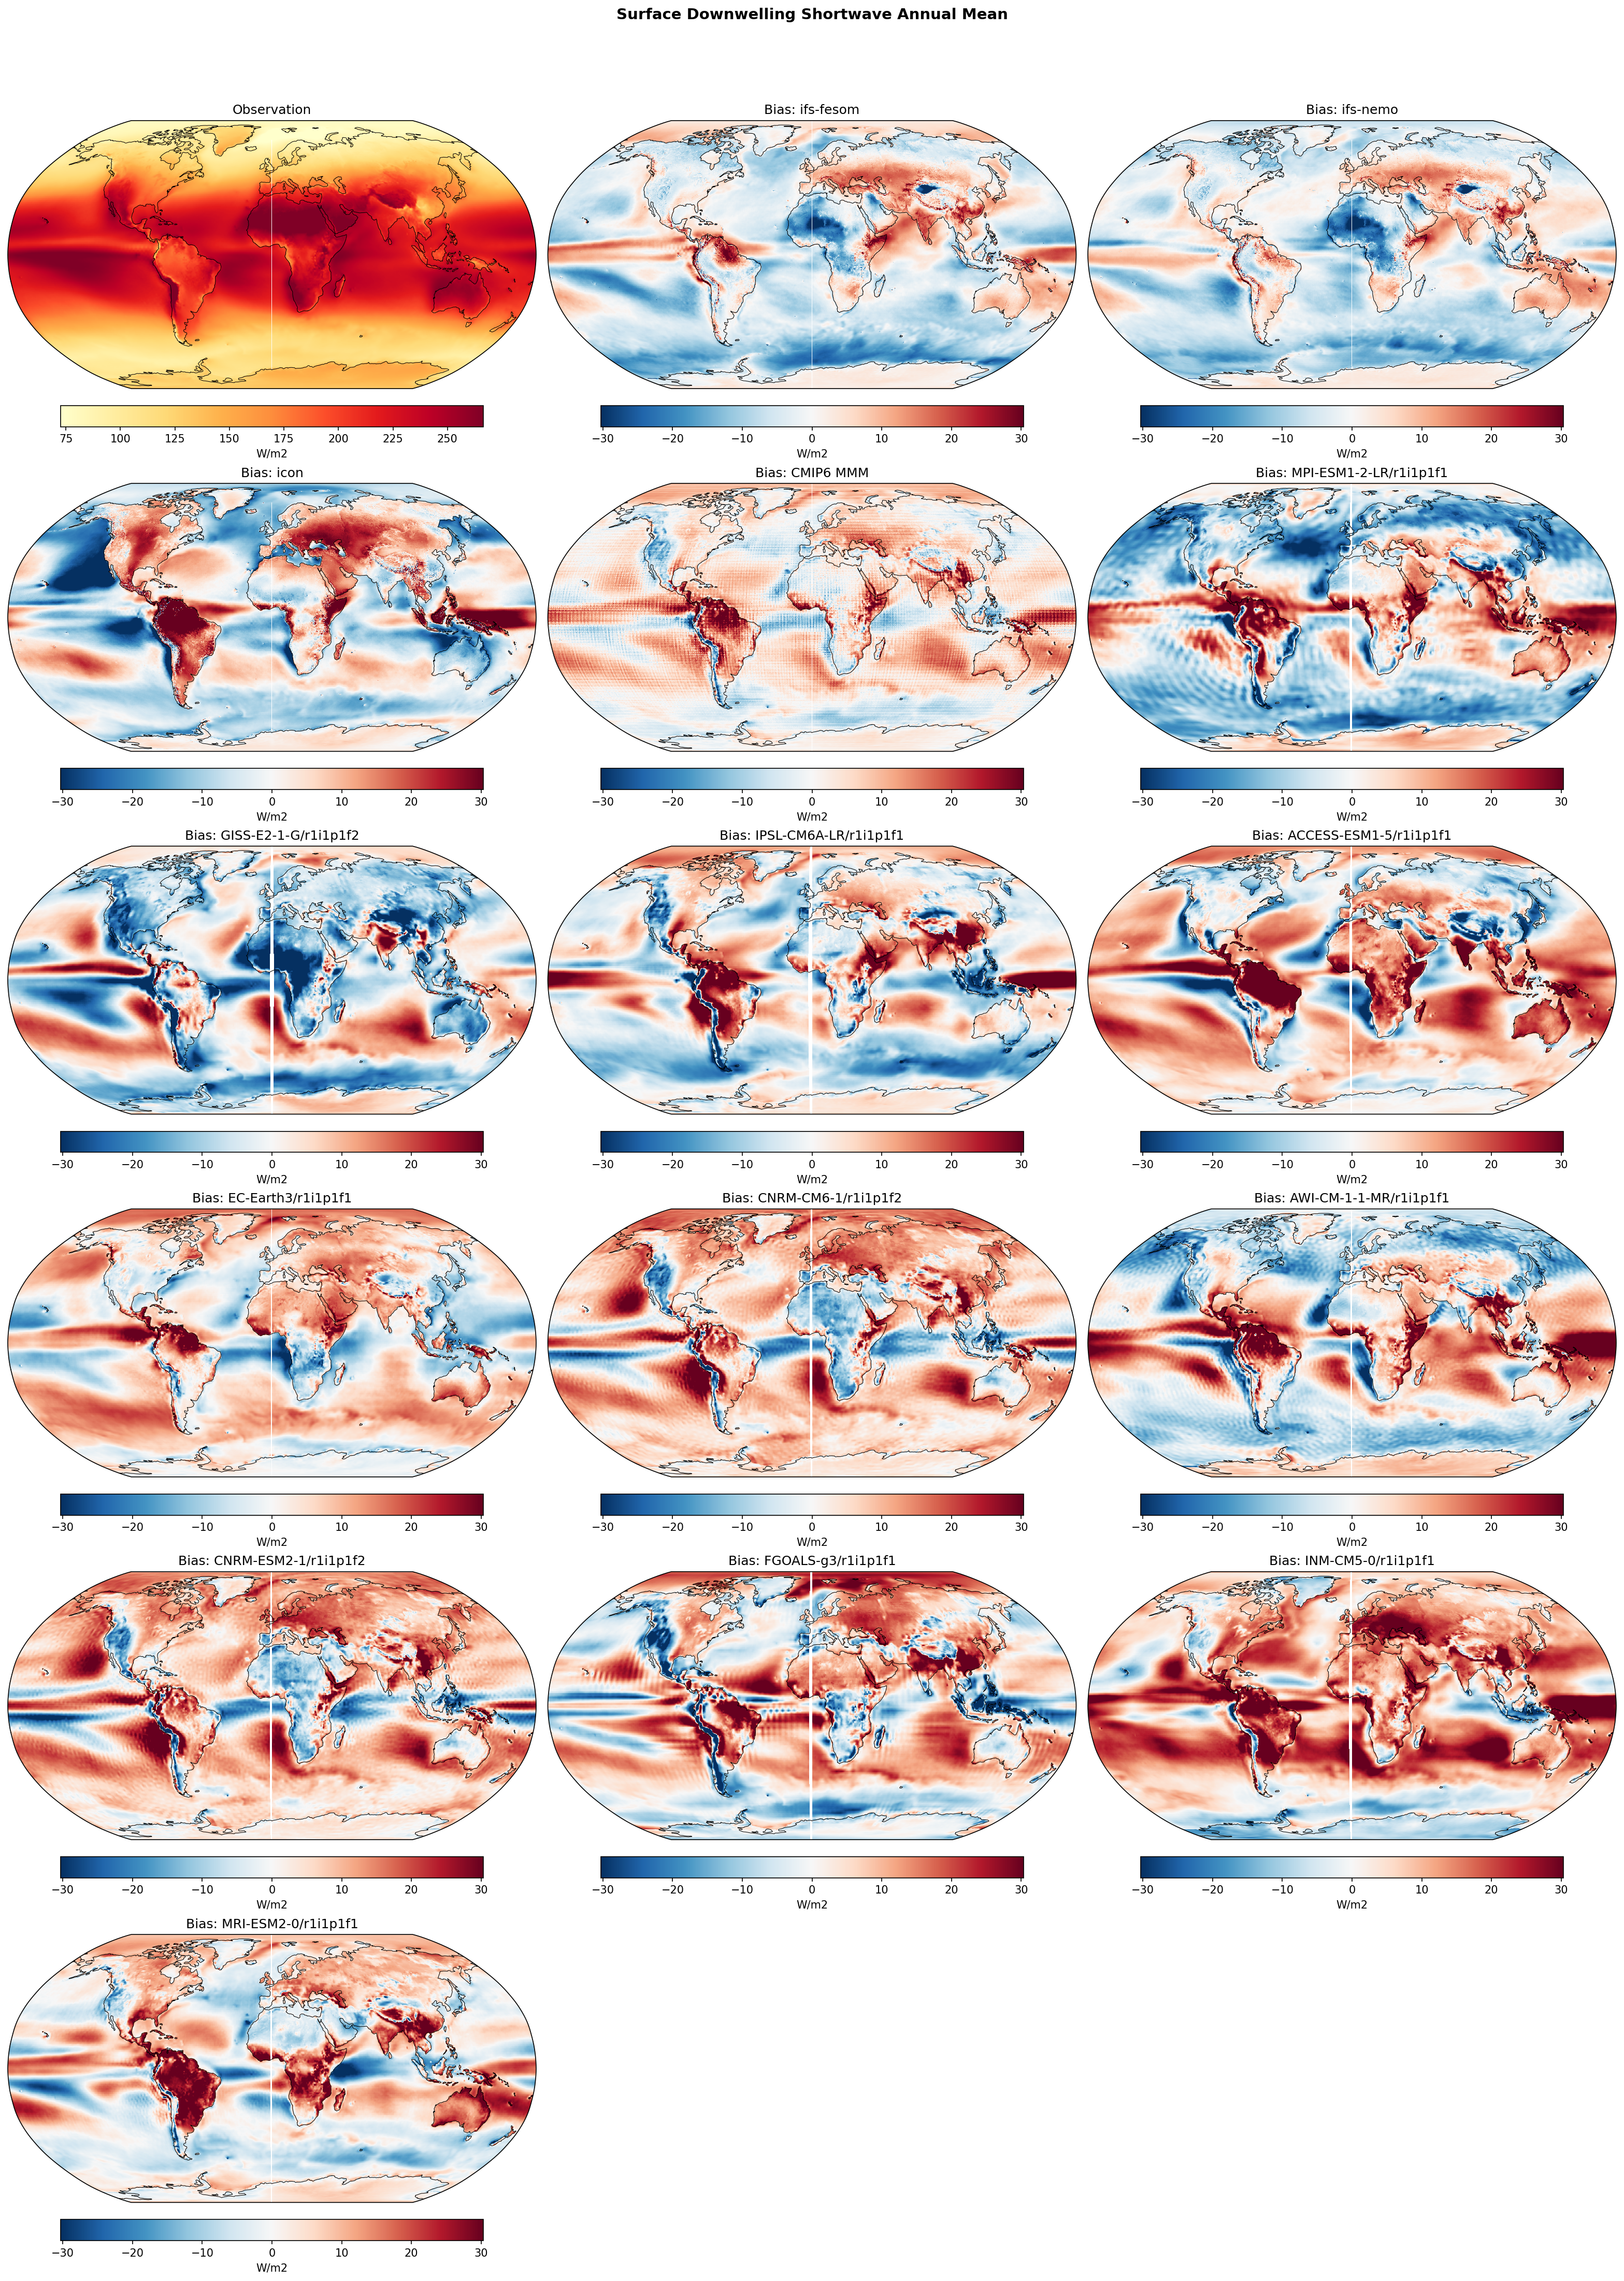
Surface Downwelling Shortwave Annual Mean Bias
| Variables | avg_sdswrf |
|---|---|
| Models | ifs-fesom, ifs-nemo, icon, CMIP6 MMM, MPI-ESM1-2-LR/r1i1p1f1, GISS-E2-1-G/r1i1p1f2, IPSL-CM6A-LR/r1i1p1f1, ACCESS-ESM1-5/r1i1p1f1, EC-Earth3/r1i1p1f1, CNRM-CM6-1/r1i1p1f2, AWI-CM-1-1-MR/r1i1p1f1, CNRM-ESM2-1/r1i1p1f2, FGOALS-g3/r1i1p1f1, INM-CM5-0/r1i1p1f1, MRI-ESM2-0/r1i1p1f1 |
| Reference Dataset | ERA5 |
| Units | W/m2 |
| Period | 1990–2014 |
| ifs-fesom | Global Mean Bias: -1.76 · Rmse: 9.69 |
| ifs-nemo | Global Mean Bias: -2.14 · Rmse: 8.94 |
| icon | Global Mean Bias: -0.11 · Rmse: 14.84 |
| CMIP6 MMM | Global Mean Bias: 3.98 · Rmse: 9.33 |
| MPI-ESM1-2-LR/r1i1p1f1 | Global Mean Bias: -1.46 · Rmse: 14.84 |
| GISS-E2-1-G/r1i1p1f2 | Global Mean Bias: -3.61 · Rmse: 15.34 |
| IPSL-CM6A-LR/r1i1p1f1 | Global Mean Bias: 0.90 · Rmse: 14.53 |
| ACCESS-ESM1-5/r1i1p1f1 | Global Mean Bias: 6.46 · Rmse: 15.84 |
| EC-Earth3/r1i1p1f1 | Global Mean Bias: 3.62 · Rmse: 11.05 |
| CNRM-CM6-1/r1i1p1f2 | Global Mean Bias: 6.14 · Rmse: 13.50 |
| AWI-CM-1-1-MR/r1i1p1f1 | Global Mean Bias: 2.38 · Rmse: 14.34 |
| CNRM-ESM2-1/r1i1p1f2 | Global Mean Bias: 6.74 · Rmse: 14.04 |
| FGOALS-g3/r1i1p1f1 | Global Mean Bias: 4.06 · Rmse: 15.49 |
| INM-CM5-0/r1i1p1f1 | Global Mean Bias: 11.13 · Rmse: 17.14 |
| MRI-ESM2-0/r1i1p1f1 | Global Mean Bias: 3.64 · Rmse: 12.40 |
Summary high
The figure presents annual mean biases in surface downwelling shortwave radiation relative to ERA5 reanalysis, comparing high-resolution DestinE models (IFS-FESOM, IFS-NEMO, ICON) with the CMIP6 multi-model mean and individual CMIP6 models.
Key Findings
- DestinE IFS models achieve the lowest RMSEs (~8.9-9.6 W/m²), outperforming individual CMIP6 models and matching the performance of the CMIP6 multi-model mean.
- ICON has the smallest global mean bias (-0.32 W/m²) but a high RMSE (14.76 W/m²), resulting from massive compensating errors: strong positive biases over land and negative biases over oceans.
- The high-resolution DestinE models largely eliminate the pervasive CMIP6 positive shortwave bias over the Southern Ocean, indicating improved cloud representation in this historically problematic region.
Spatial Patterns
CMIP6 models (and the MMM) exhibit widespread positive biases (excess radiation) over the Southern Ocean and eastern boundary stratocumulus regions. In contrast, IFS models display negative biases over the oceanic ITCZ and trade wind regimes, with localized positive biases over tropical forests (Amazon, Congo). ICON's spatial pattern is highly polarized, characterized by severe positive biases across almost all global landmasses and pronounced negative biases over marine stratocumulus decks and the Southern Ocean.
Model Agreement
IFS-FESOM and IFS-NEMO exhibit nearly identical spatial bias patterns, demonstrating that the atmospheric component dictates these radiative errors rather than the ocean coupling. There is stark divergence between the IFS models and ICON, particularly regarding land-sea contrast. DestinE models unanimously diverge from the CMIP6 ensemble by mitigating the Southern Ocean positive bias.
Physical Interpretation
Surface downwelling shortwave biases are predominantly governed by errors in cloud macrophysics (fraction) and microphysics (optical depth). The ubiquitous positive biases in CMIP6 over the Southern Ocean stem from well-documented underestimations of supercooled liquid clouds; the absence of this bias in DestinE models suggests high resolution or updated physics improves boundary layer cloud representation. ICON's strong positive biases over land imply a severe underestimation of convective cloud cover or optical thickness. Conversely, negative biases in ICON over stratocumulus regions indicate an overproduction of boundary layer clouds, an inverse of the typical CMIP6 error.
Caveats
- The reference dataset, ERA5, is a reanalysis model and not direct satellite observation; true observational constraints like CERES-EBAF would provide a more robust baseline for surface radiation.
- Annual mean maps may conceal significant seasonal compensating errors in cloud cover and radiation.
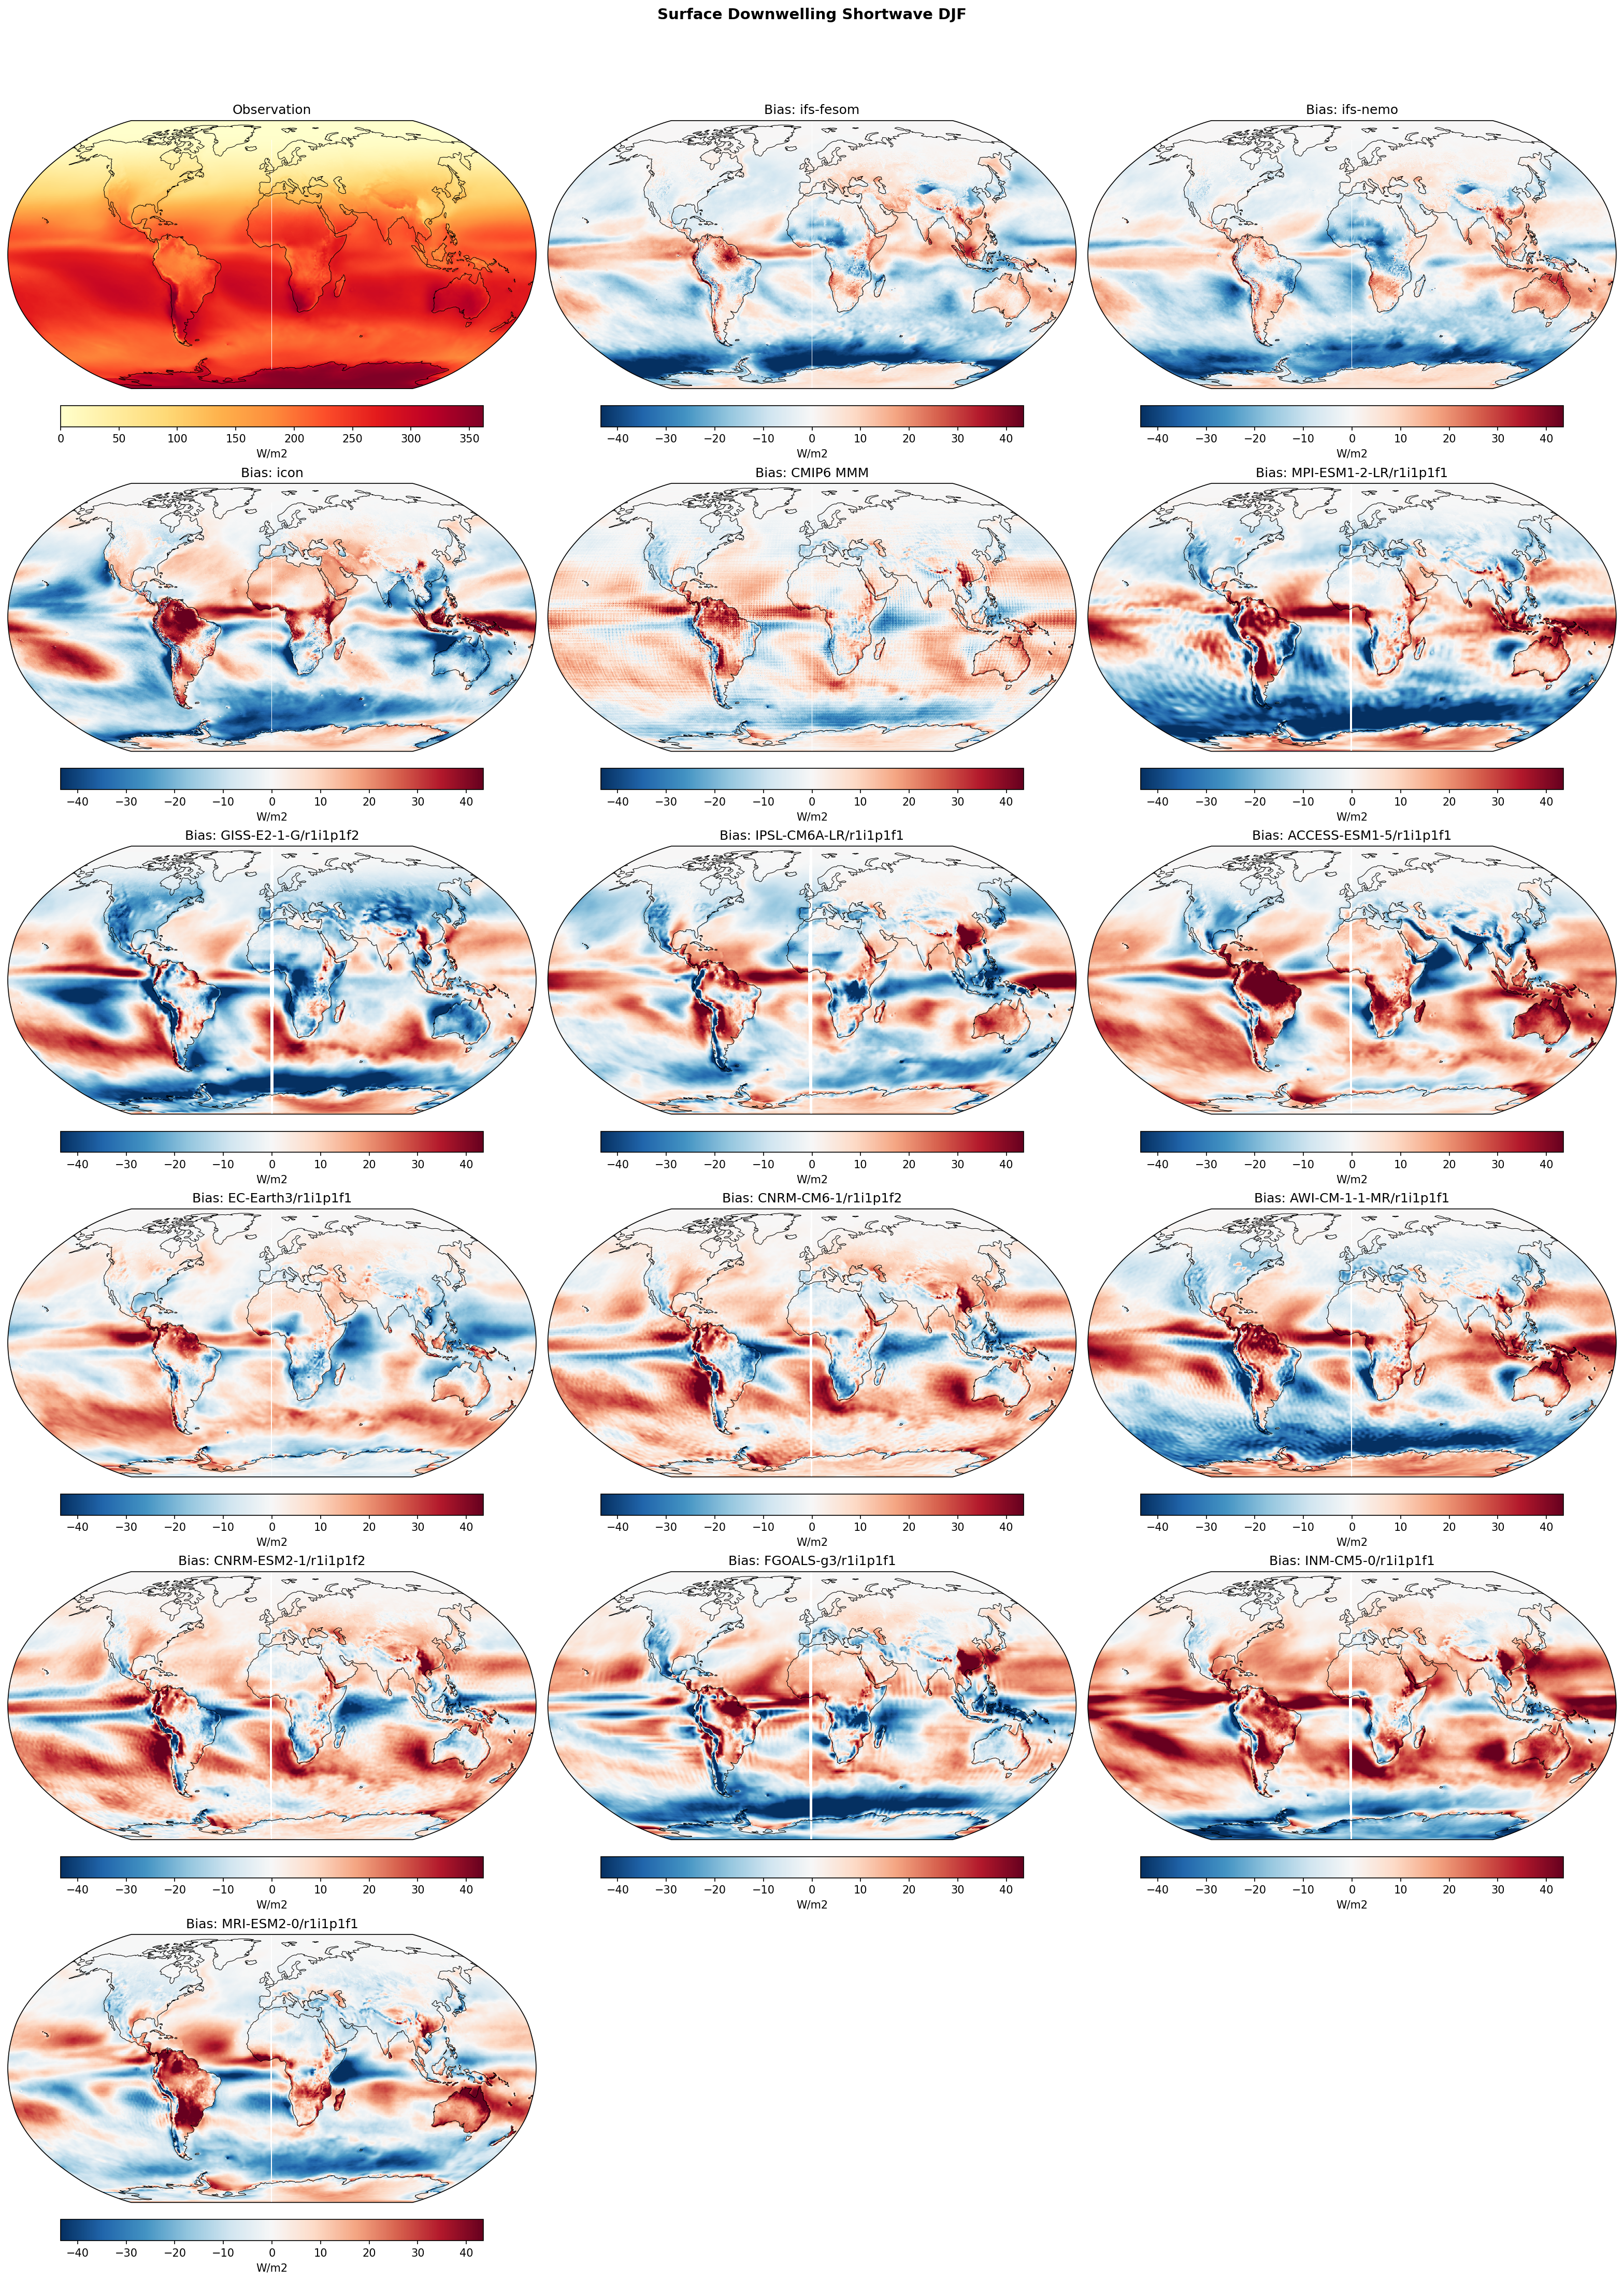
Surface Downwelling Shortwave DJF Bias
| Variables | avg_sdswrf |
|---|---|
| Models | ifs-fesom, ifs-nemo, icon, CMIP6 MMM, MPI-ESM1-2-LR/r1i1p1f1, GISS-E2-1-G/r1i1p1f2, IPSL-CM6A-LR/r1i1p1f1, ACCESS-ESM1-5/r1i1p1f1, EC-Earth3/r1i1p1f1, CNRM-CM6-1/r1i1p1f2, AWI-CM-1-1-MR/r1i1p1f1, CNRM-ESM2-1/r1i1p1f2, FGOALS-g3/r1i1p1f1, INM-CM5-0/r1i1p1f1, MRI-ESM2-0/r1i1p1f1 |
| Reference Dataset | ERA5 |
| Units | W/m2 |
| Period | 1990–2014 |
| CMIP6 MMM | Global Mean Bias: 2.56 · Rmse: None |
| MPI-ESM1-2-LR/r1i1p1f1 | Global Mean Bias: -2.57 · Rmse: None |
| GISS-E2-1-G/r1i1p1f2 | Global Mean Bias: -4.35 · Rmse: None |
| IPSL-CM6A-LR/r1i1p1f1 | Global Mean Bias: -0.33 · Rmse: None |
| ACCESS-ESM1-5/r1i1p1f1 | Global Mean Bias: 6.26 · Rmse: None |
| EC-Earth3/r1i1p1f1 | Global Mean Bias: 1.78 · Rmse: None |
| CNRM-CM6-1/r1i1p1f2 | Global Mean Bias: 5.58 · Rmse: None |
| AWI-CM-1-1-MR/r1i1p1f1 | Global Mean Bias: 0.98 · Rmse: None |
| CNRM-ESM2-1/r1i1p1f2 | Global Mean Bias: 5.96 · Rmse: None |
| FGOALS-g3/r1i1p1f1 | Global Mean Bias: 0.24 · Rmse: None |
| INM-CM5-0/r1i1p1f1 | Global Mean Bias: 10.43 · Rmse: None |
| MRI-ESM2-0/r1i1p1f1 | Global Mean Bias: 0.57 · Rmse: None |
Summary high
The figure displays the spatial biases of surface downwelling shortwave radiation for DJF climatology across high-resolution DestinE models and CMIP6 models compared to ERA5. It highlights significant cloud-radiative effect biases, particularly in the Southern Ocean, tropical landmasses, and marine stratocumulus regions, with notable divergence between the IFS-based models and ICON.
Key Findings
- IFS-FESOM and IFS-NEMO display a pronounced negative shortwave bias over the Southern Ocean, contrasting sharply with the widespread positive bias seen in the CMIP6 multi-model mean and ICON.
- ICON exhibits strong negative shortwave biases over tropical landmasses and the ITCZ, directly opposing the positive biases found in the IFS models in these same regions.
- Widespread positive shortwave biases persist across both high-resolution and conventional models in eastern boundary upwelling regions, indicating persistent challenges in simulating marine stratocumulus clouds regardless of horizontal resolution.
Spatial Patterns
During DJF, maximum insolation occurs in the Southern Hemisphere. The IFS models show a distinct zonally symmetric band of negative bias (-20 to -40 W/m2) over the Southern Ocean, whereas ICON and the CMIP6 MMM show strong positive biases in this region. Over tropical land (Amazon, Congo basin, Maritime Continent), IFS models exhibit positive biases, while ICON shows intense negative biases. Almost all models exhibit positive biases off the western coasts of South America, southern Africa, and North America.
Model Agreement
Inter-model agreement among the high-resolution DestinE models is poor. While IFS-FESOM and IFS-NEMO share nearly identical bias patterns, they are almost spatially anti-correlated with ICON, particularly in the Southern Ocean and tropical convergence zones. The high-resolution models do not uniformly improve upon the CMIP6 MMM, demonstrating instead distinct regional biases of similar or sometimes greater magnitude.
Physical Interpretation
Biases in surface downwelling shortwave are predominantly driven by errors in cloud fraction and optical depth. Positive biases over the Southern Ocean (ICON, CMIP6 MMM) suggest an underestimation of cloud cover or supercooled liquid water in storm tracks, whereas negative biases (IFS models) imply overly thick or extensive clouds. Persistent positive biases in marine stratocumulus regions indicate a systematic failure in boundary layer parameterizations to maintain shallow cloud decks under subsidence. Diverging biases over tropical landmasses reflect contrasting structural errors in deep convective parameterizations and anvil cloud lifecycles.
Caveats
- ERA5 is a reanalysis, meaning its radiation and cloud fields are model-derived rather than purely observational; validation against satellite-based datasets like CERES-EBAF would be more robust for surface fluxes.
- The DJF seasonal focus naturally emphasizes Southern Hemisphere biases due to peak summer insolation; an evaluation of JJA is required to comprehensively assess Northern Hemisphere storm track and stratocumulus biases.
Surface Downwelling Shortwave JJA Bias
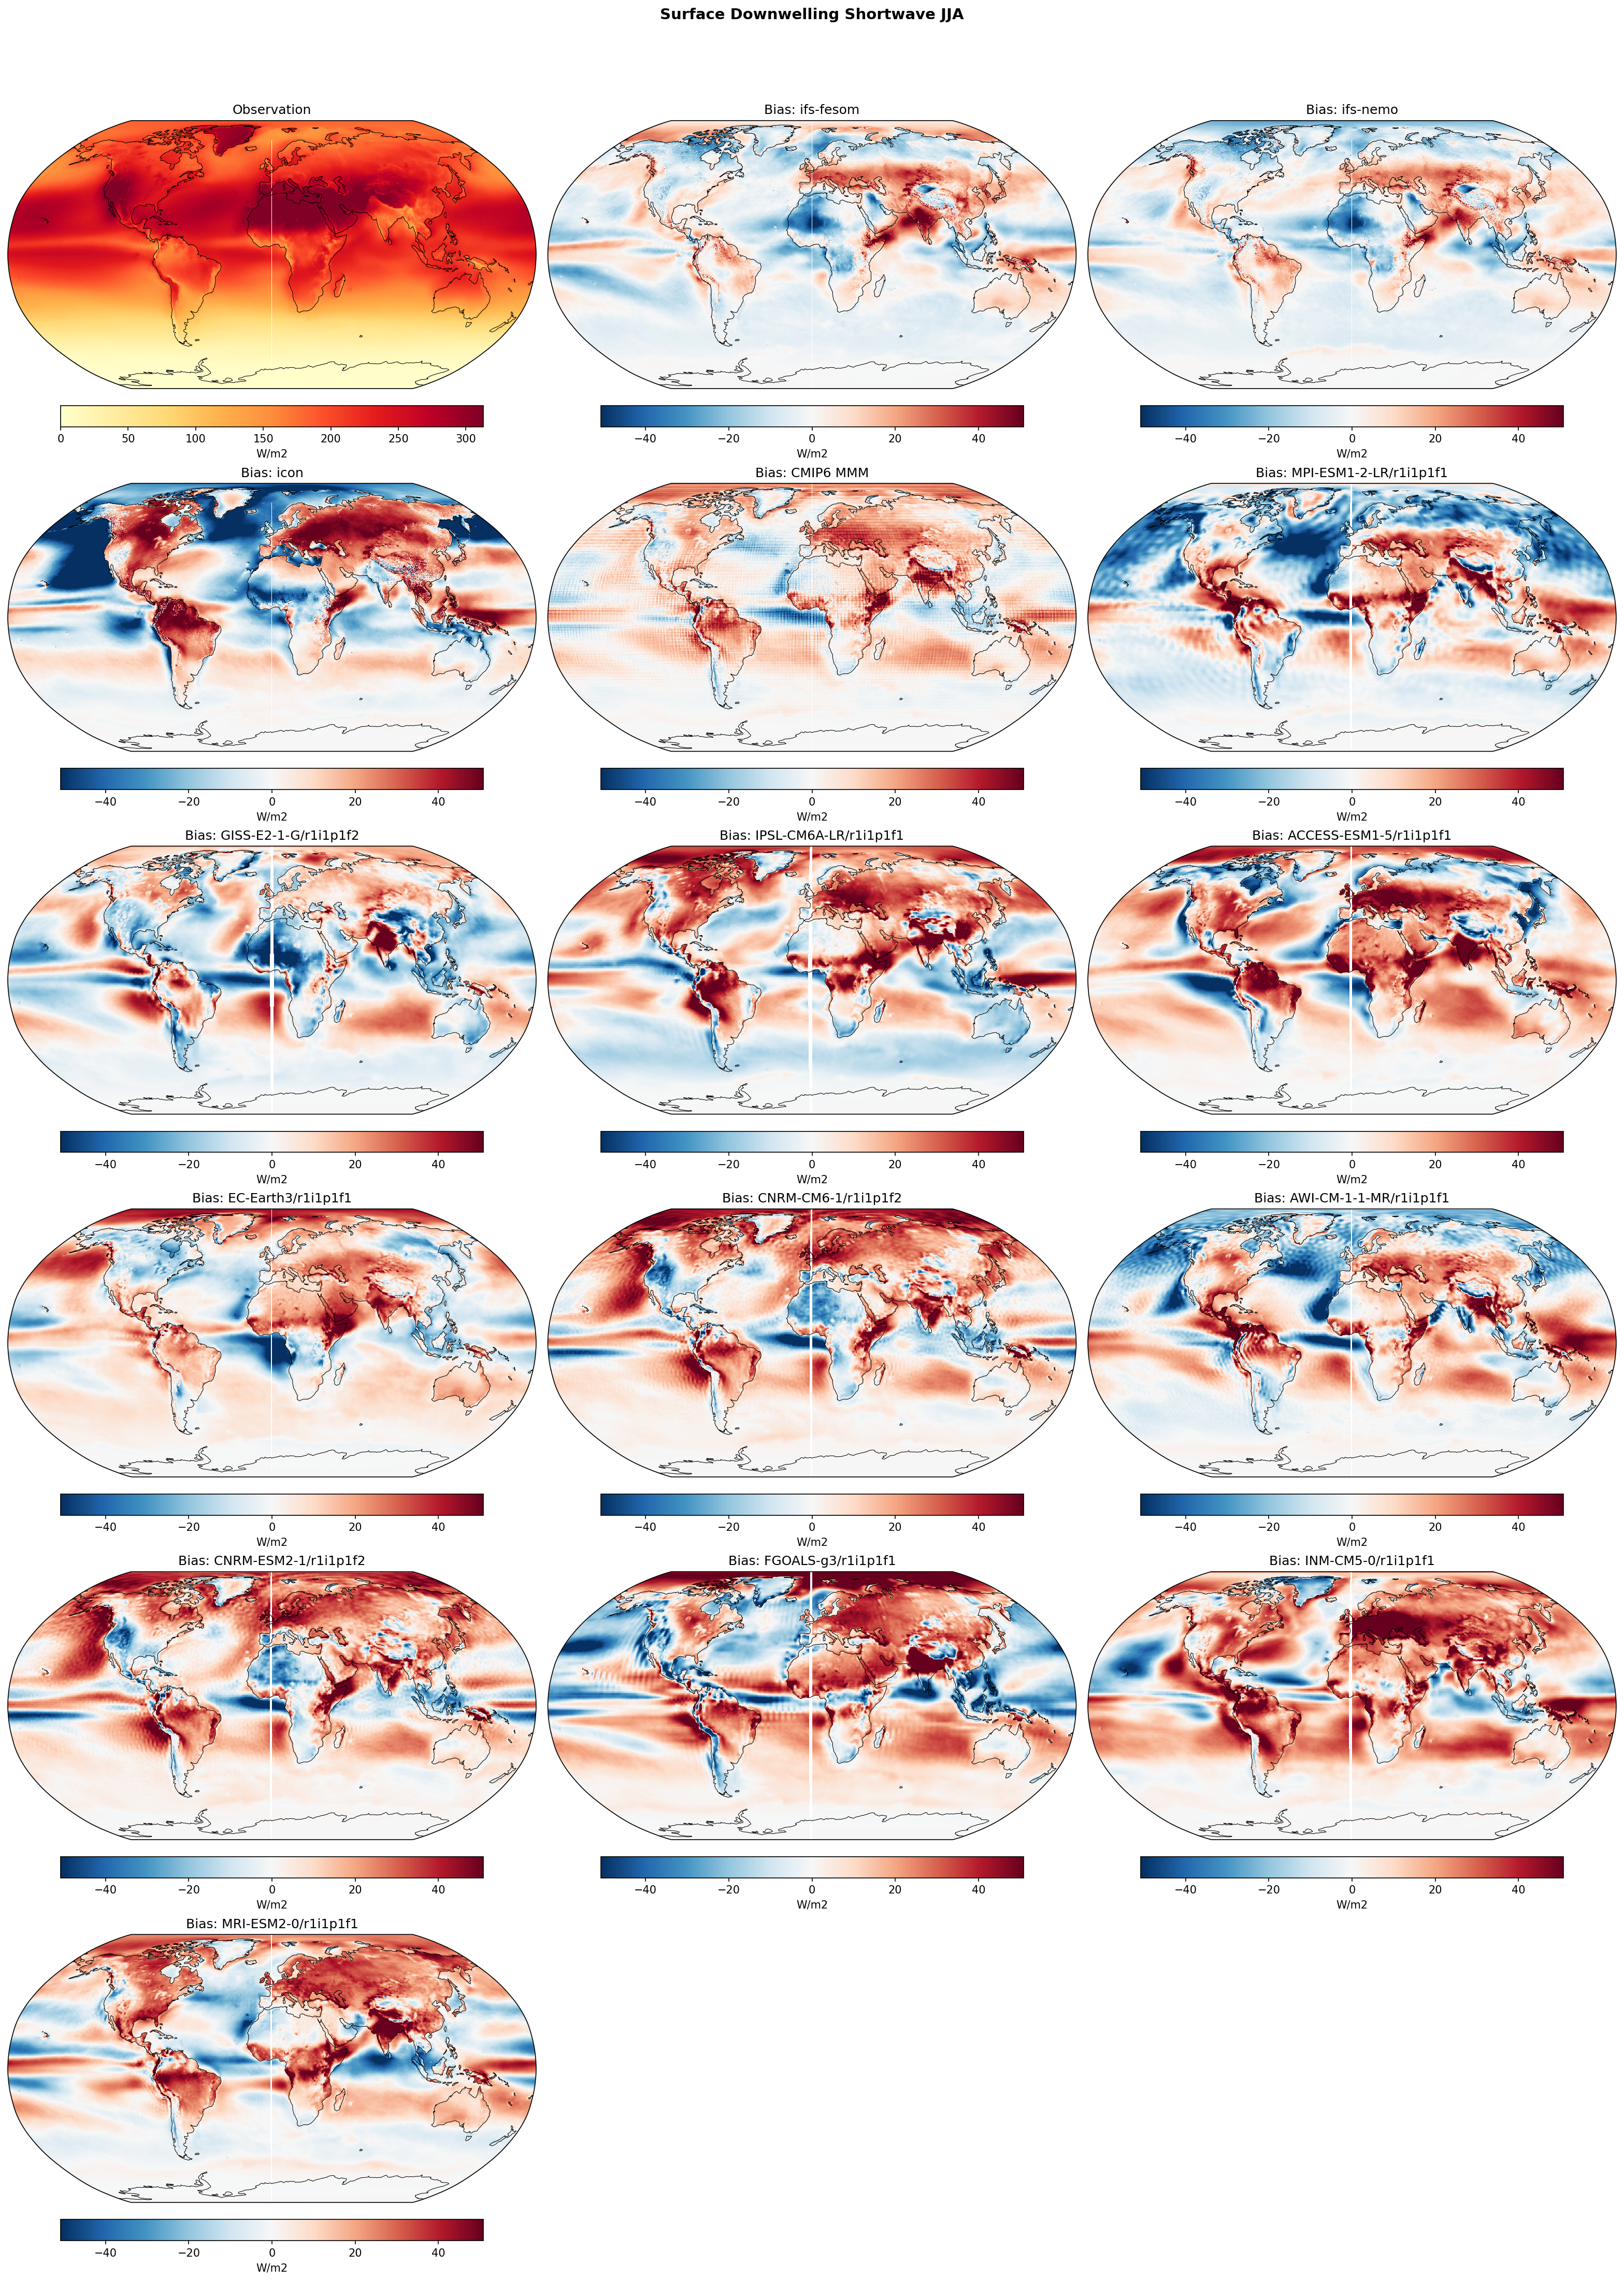
| Variables | avg_sdswrf |
|---|---|
| Models | ifs-fesom, ifs-nemo, icon, CMIP6 MMM, MPI-ESM1-2-LR/r1i1p1f1, GISS-E2-1-G/r1i1p1f2, IPSL-CM6A-LR/r1i1p1f1, ACCESS-ESM1-5/r1i1p1f1, EC-Earth3/r1i1p1f1, CNRM-CM6-1/r1i1p1f2, AWI-CM-1-1-MR/r1i1p1f1, CNRM-ESM2-1/r1i1p1f2, FGOALS-g3/r1i1p1f1, INM-CM5-0/r1i1p1f1, MRI-ESM2-0/r1i1p1f1 |
| Reference Dataset | ERA5 |
| Units | W/m2 |
| Period | 1990–2014 |
| CMIP6 MMM | Global Mean Bias: 5.72 · Rmse: None |
| MPI-ESM1-2-LR/r1i1p1f1 | Global Mean Bias: -1.48 · Rmse: None |
| GISS-E2-1-G/r1i1p1f2 | Global Mean Bias: -0.96 · Rmse: None |
| IPSL-CM6A-LR/r1i1p1f1 | Global Mean Bias: 5.50 · Rmse: None |
| ACCESS-ESM1-5/r1i1p1f1 | Global Mean Bias: 8.05 · Rmse: None |
| EC-Earth3/r1i1p1f1 | Global Mean Bias: 4.54 · Rmse: None |
| CNRM-CM6-1/r1i1p1f2 | Global Mean Bias: 7.56 · Rmse: None |
| AWI-CM-1-1-MR/r1i1p1f1 | Global Mean Bias: 3.03 · Rmse: None |
| CNRM-ESM2-1/r1i1p1f2 | Global Mean Bias: 8.57 · Rmse: None |
| FGOALS-g3/r1i1p1f1 | Global Mean Bias: 5.92 · Rmse: None |
| INM-CM5-0/r1i1p1f1 | Global Mean Bias: 12.44 · Rmse: None |
| MRI-ESM2-0/r1i1p1f1 | Global Mean Bias: 6.21 · Rmse: None |
Summary high
Comparison of surface downwelling shortwave radiation JJA climatology biases reveals significant improvements in DestinE IFS models over traditional CMIP6 models, particularly in the Southern Ocean, while the ICON model displays a pronounced land-ocean bias contrast.
Key Findings
- IFS-FESOM and IFS-NEMO substantially reduce the ubiquitous CMIP6 positive shortwave bias over the Southern Ocean and tropical stratocumulus regions.
- The ICON model shows a strong systematic bias pattern, with excessive shortwave radiation over landmasses and insufficient shortwave over oceans.
- IFS models exhibit a distinct positive shortwave bias over the Arabian Sea and Indian Ocean during the JJA monsoon season.
Spatial Patterns
CMIP6 models broadly overestimate shortwave over the Southern Ocean and eastern ocean basins. ICON features negative biases across the North Pacific, North Atlantic, and Arctic Oceans, contrasting with strong positive biases over Eurasia, Africa, and the Americas. IFS models share localized positive biases in the Arabian Sea, equatorial Atlantic, and high northern latitudes.
Model Agreement
There is high agreement between IFS-FESOM and IFS-NEMO, highlighting the dominant role of the IFS atmospheric component in determining shortwave biases. ICON disagrees fundamentally with the other models, exhibiting an opposing sign of bias over the global oceans compared to most CMIP6 models.
Physical Interpretation
Biases in surface shortwave are predominantly driven by errors in cloud cover and optical thickness; positive biases indicate an underestimation of clouds, allowing too much radiation to reach the surface. The mitigation of the Southern Ocean bias in IFS models points to better representation of marine boundary layer clouds and supercooled liquid water, possibly aided by higher resolution. ICON's stark land-ocean contrast suggests systematic issues in its parameterization of convection and low clouds depending on the underlying surface type.
Caveats
- ERA5 is used as the observational reference; while generally reliable, reanalysis cloud properties and resulting surface fluxes carry some uncertainties compared to direct satellite products like CERES.
- Differences in aerosol climatologies and aerosol-radiation interaction schemes between models can strongly influence shortwave biases, especially over the Sahara, Arabian Sea, and industrial regions.
Surface Latent Heat Flux Annual Mean Bias
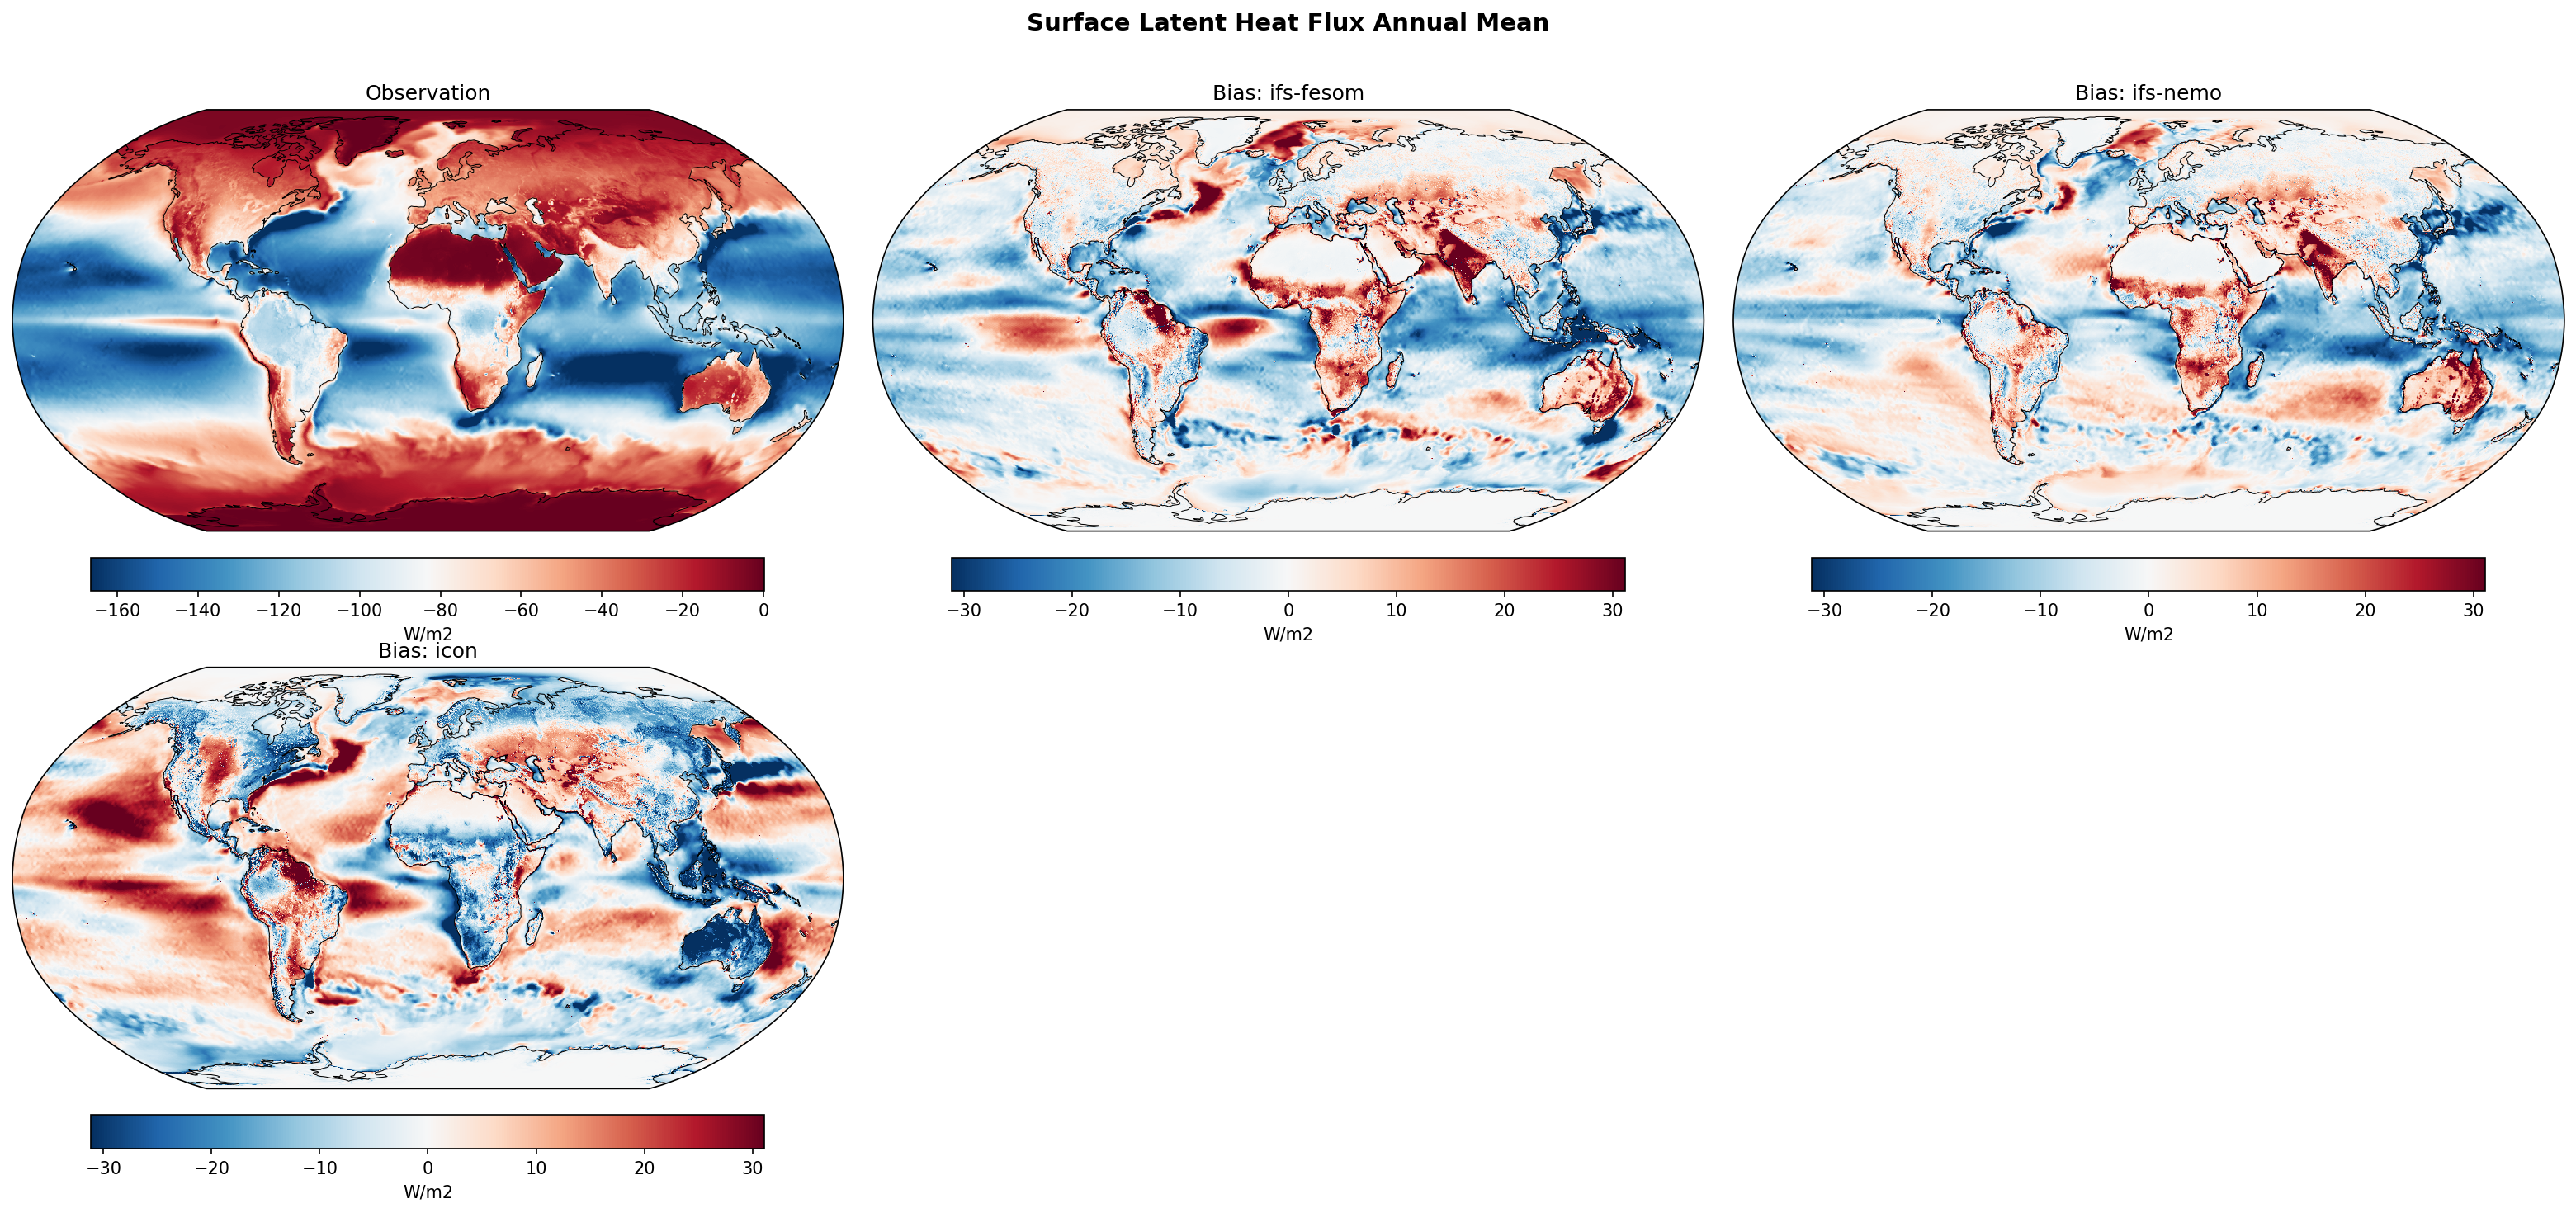
| Variables | avg_slhtf |
|---|---|
| Models | ifs-fesom, ifs-nemo, icon |
| Reference Dataset | ERA5 |
| Units | W/m2 |
| Period | 1990–2014 |
| ifs-fesom | Global Mean Bias: -2.68 · Rmse: 12.85 |
| ifs-nemo | Global Mean Bias: -2.19 · Rmse: 10.92 |
| icon | Global Mean Bias: -0.22 · Rmse: 14.86 |
Summary high
The figure evaluates the annual mean surface latent heat flux biases of three high-resolution coupled climate models against ERA5, highlighting regional evaporation discrepancies across oceans and landmasses.
Key Findings
- IFS-FESOM and IFS-NEMO exhibit nearly identical bias patterns, demonstrating that the shared atmospheric component (IFS) dominates the surface turbulent flux climatology.
- The IFS models generally underestimate evaporation (positive bias) over subtropical oceans and tropical landmasses, while overestimating it (negative bias) over equatorial oceans.
- ICON displays a distinctly different spatial pattern with the highest RMSE (14.49 W/m2) due to large compensating regional errors, including excessive evaporation in the Southern Ocean and underestimated evaporation in Northern Hemisphere mid-latitudes.
Spatial Patterns
Observations (ERA5) show strong evaporation (highly negative values) over subtropical oceans and western boundary currents. The IFS models show widespread positive biases (weaker evaporation) over subtropical oceans, the Amazon, and Central Africa, but negative biases (stronger evaporation) along the ITCZ and equatorial Pacific. ICON contrasts this with intense negative biases (stronger evaporation) across the Southern Ocean and tropical Indo-Pacific, and strong positive biases in the North Pacific and North Atlantic.
Model Agreement
There is excellent agreement between IFS-FESOM and IFS-NEMO, as both use the same atmospheric physics. ICON diverges significantly from the IFS models in both spatial structure and regional magnitude. Despite having the lowest global mean bias (-0.11 W/m2) due to spatial cancellation, ICON has the highest RMSE (14.49 W/m2), whereas IFS-NEMO has the lowest RMSE (10.62 W/m2).
Physical Interpretation
Oceanic latent heat flux biases are primarily driven by errors in near-surface wind speed, sea surface temperature, and near-surface humidity. For example, excessive evaporation in the Southern Ocean in ICON may be linked to overly strong westerlies or warm SST biases. Over land, underestimated evaporation in the IFS models over tropical rainforests (Amazon, Congo) likely reflects dry biases in precipitation, depleted soil moisture, or differences in vegetation canopy formulations relative to ERA5.
Caveats
- Latent heat flux in ERA5 is a derived model quantity based on bulk parameterizations rather than a direct observation, introducing uncertainty, particularly over oceans and in extreme wind regimes.
- The convention uses negative values for upward fluxes, meaning positive biases represent an underestimation of evaporation, which requires careful interpretation.
Surface Latent Heat Flux DJF Bias
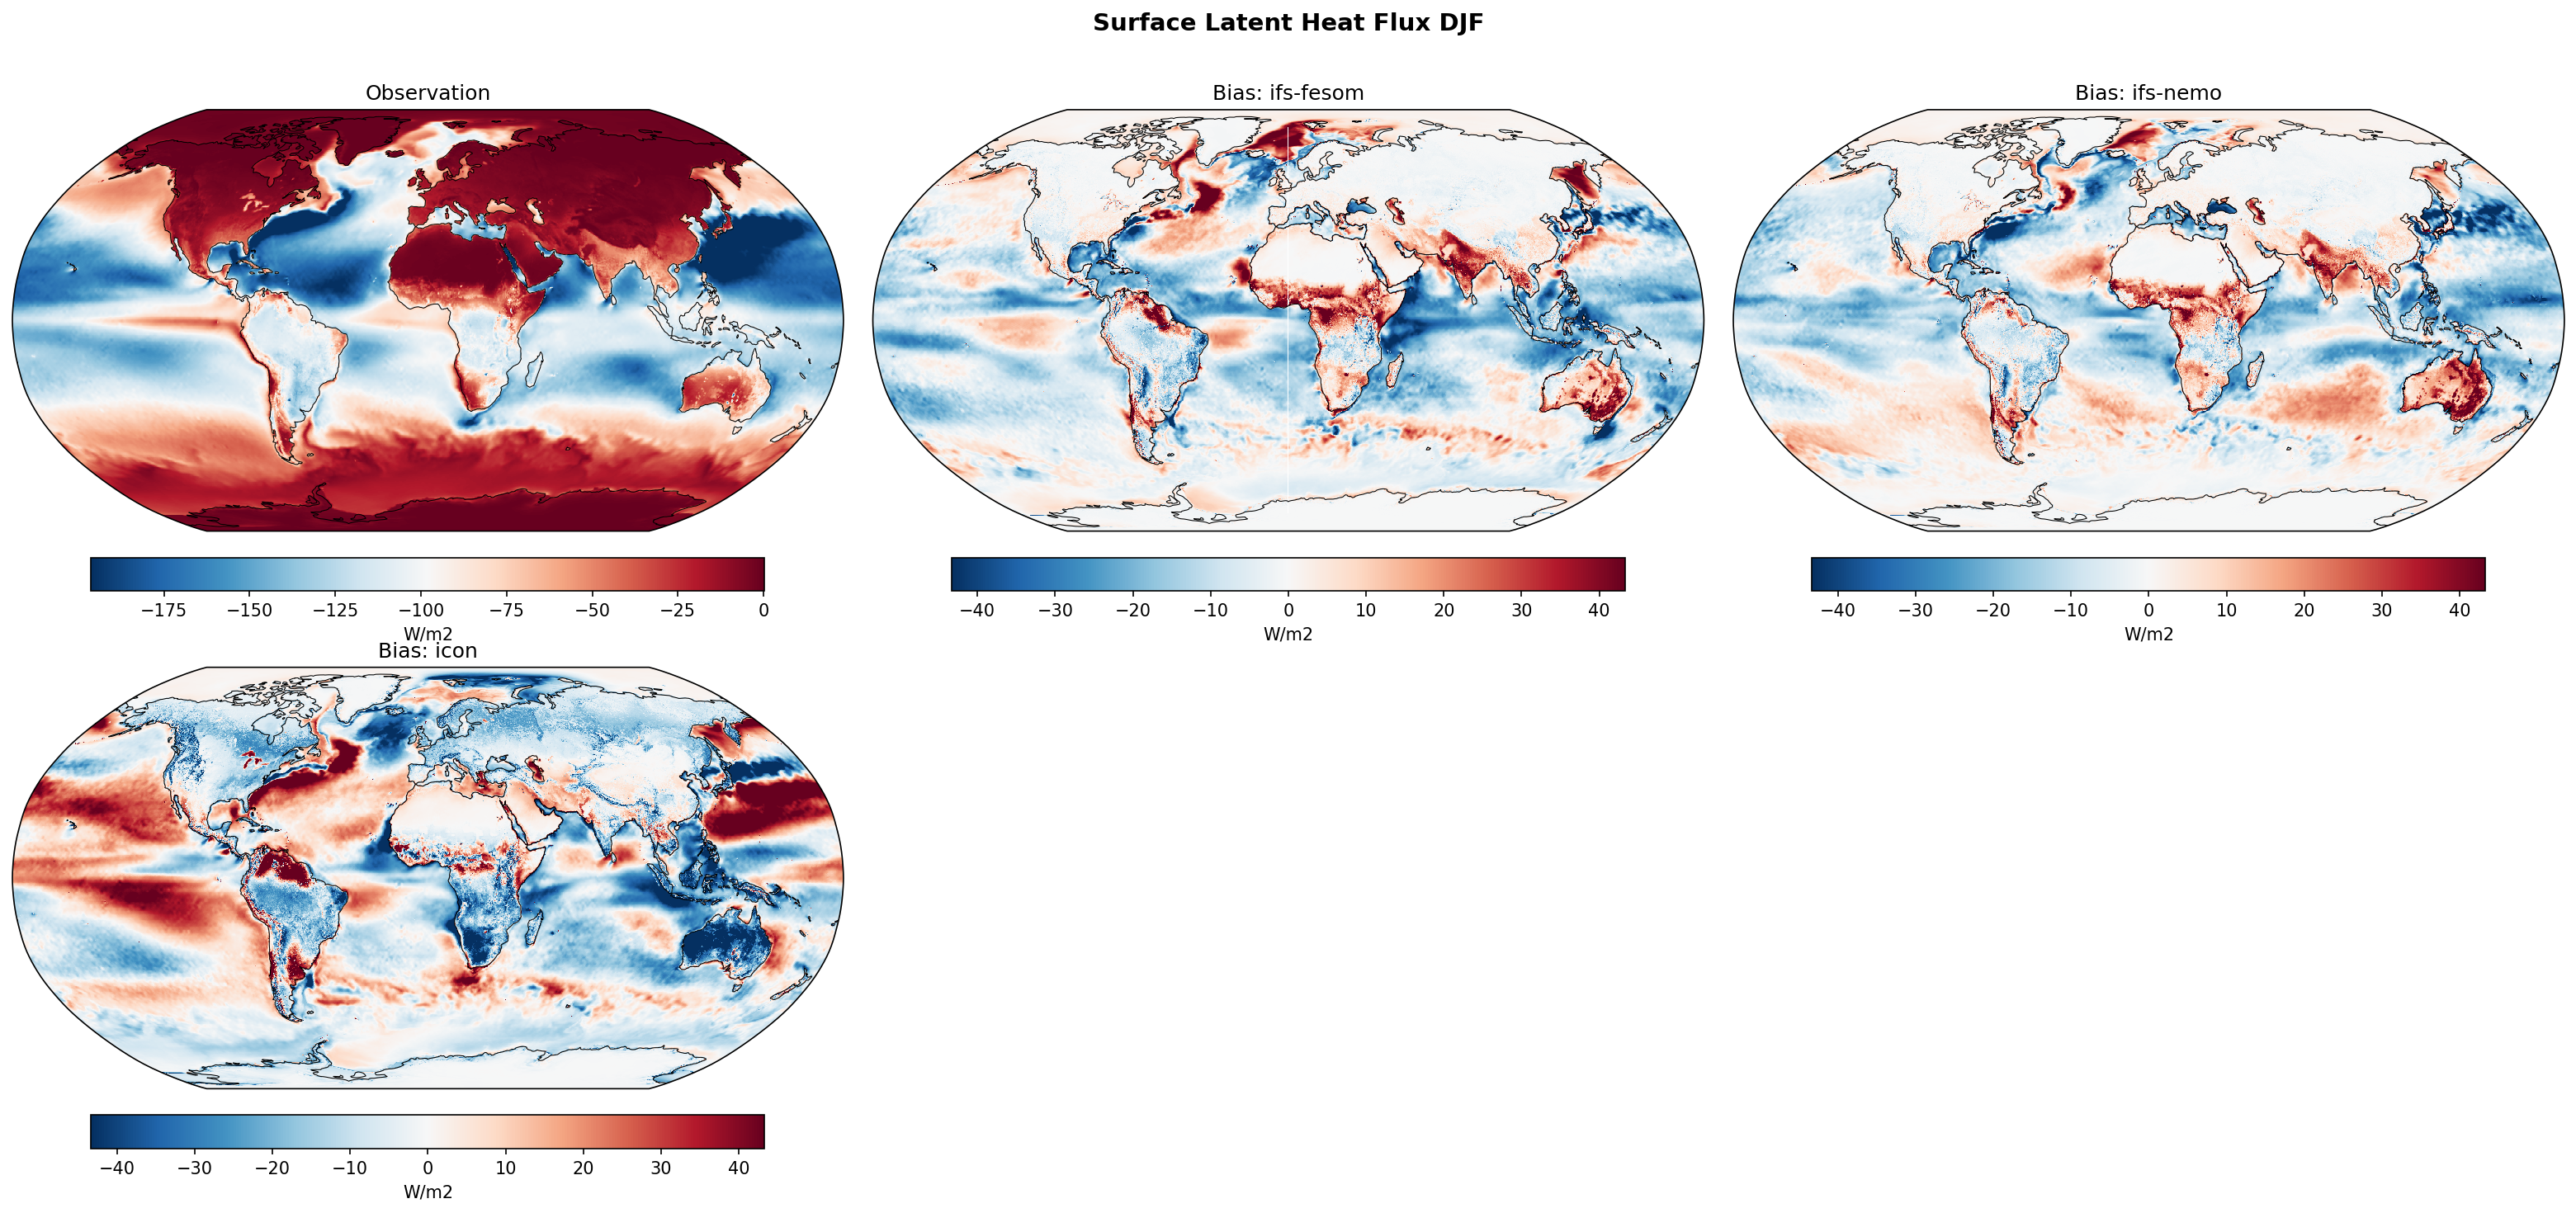
| Variables | avg_slhtf |
|---|---|
| Models | ifs-fesom, ifs-nemo, icon |
| Reference Dataset | ERA5 |
| Units | W/m2 |
| Period | 1990–2014 |
Summary high
The figure displays DJF climatological bias maps for Surface Latent Heat Flux from three high-resolution coupled models compared to ERA5, highlighting systematic challenges in simulating evaporation over tropical landmasses and strong ocean currents.
Key Findings
- All models exhibit prominent positive biases (indicating an underestimation of upward latent heat flux, or too little evaporation) over Southern Hemisphere tropical landmasses (Amazon, Central Africa, Australia) during their summer season.
- IFS-FESOM and IFS-NEMO display highly similar bias patterns, characterized by underestimated evaporation over Northern Hemisphere western boundary currents (Gulf Stream, Kuroshio) and overestimated evaporation in the equatorial Pacific.
- ICON shows significantly larger and structurally distinct biases compared to the IFS models, with massive underestimations of evaporation in eastern ocean basin upwelling/stratocumulus regions and severe overestimations in the North Atlantic and North Pacific.
Spatial Patterns
The ERA5 reference shows strong upward latent heat fluxes (large negative values) over subtropical oceans and western boundary currents. Bias maps reveal that IFS-FESOM and IFS-NEMO underestimate this flux (red/positive biases) over the Gulf Stream, Kuroshio, and tropical landmasses, while overestimating it (blue/negative biases) across the broad trade-wind regions and equatorial Pacific. ICON's bias pattern is distinctly different, dominating with severe positive biases (too little evaporation) along the eastern boundaries of the Pacific and Atlantic, and deep negative biases over much of the mid-to-high latitude oceans.
Model Agreement
There is strong agreement between IFS-FESOM and IFS-NEMO, reflecting the dominant role of their shared atmospheric component (IFS) in driving surface fluxes. ICON diverges sharply from the IFS models, exhibiting much higher bias magnitudes globally. However, all three models agree on the positive bias over tropical land, indicating a shared difficulty in modeling terrestrial evaporation during the austral summer.
Physical Interpretation
The widespread underestimation of evaporation over tropical land in DJF is likely linked to dry precipitation biases and subsequent soil moisture deficits, restricting the water available for latent heating. Over the oceans, biases are heavily modulated by SST errors and wind speed biases. For instance, negative biases (too much evaporation) in the equatorial Pacific in the IFS models likely correspond to common coupled-model warm SST biases in the cold tongue region. The underestimation of evaporation over western boundary currents suggests that despite ~5 km resolution, the models struggle with the intense air-sea gradients when cold continental air advects over warm ocean currents.
Caveats
- ERA5 surface fluxes are model-derived products based on bulk parameterizations rather than direct observations, introducing inherent reference dataset uncertainty.
- The analysis assumes a sign convention where upward fluxes are negative; thus, a positive bias means the model's flux is less negative (weaker evaporation) than ERA5.
Surface Latent Heat Flux JJA Bias
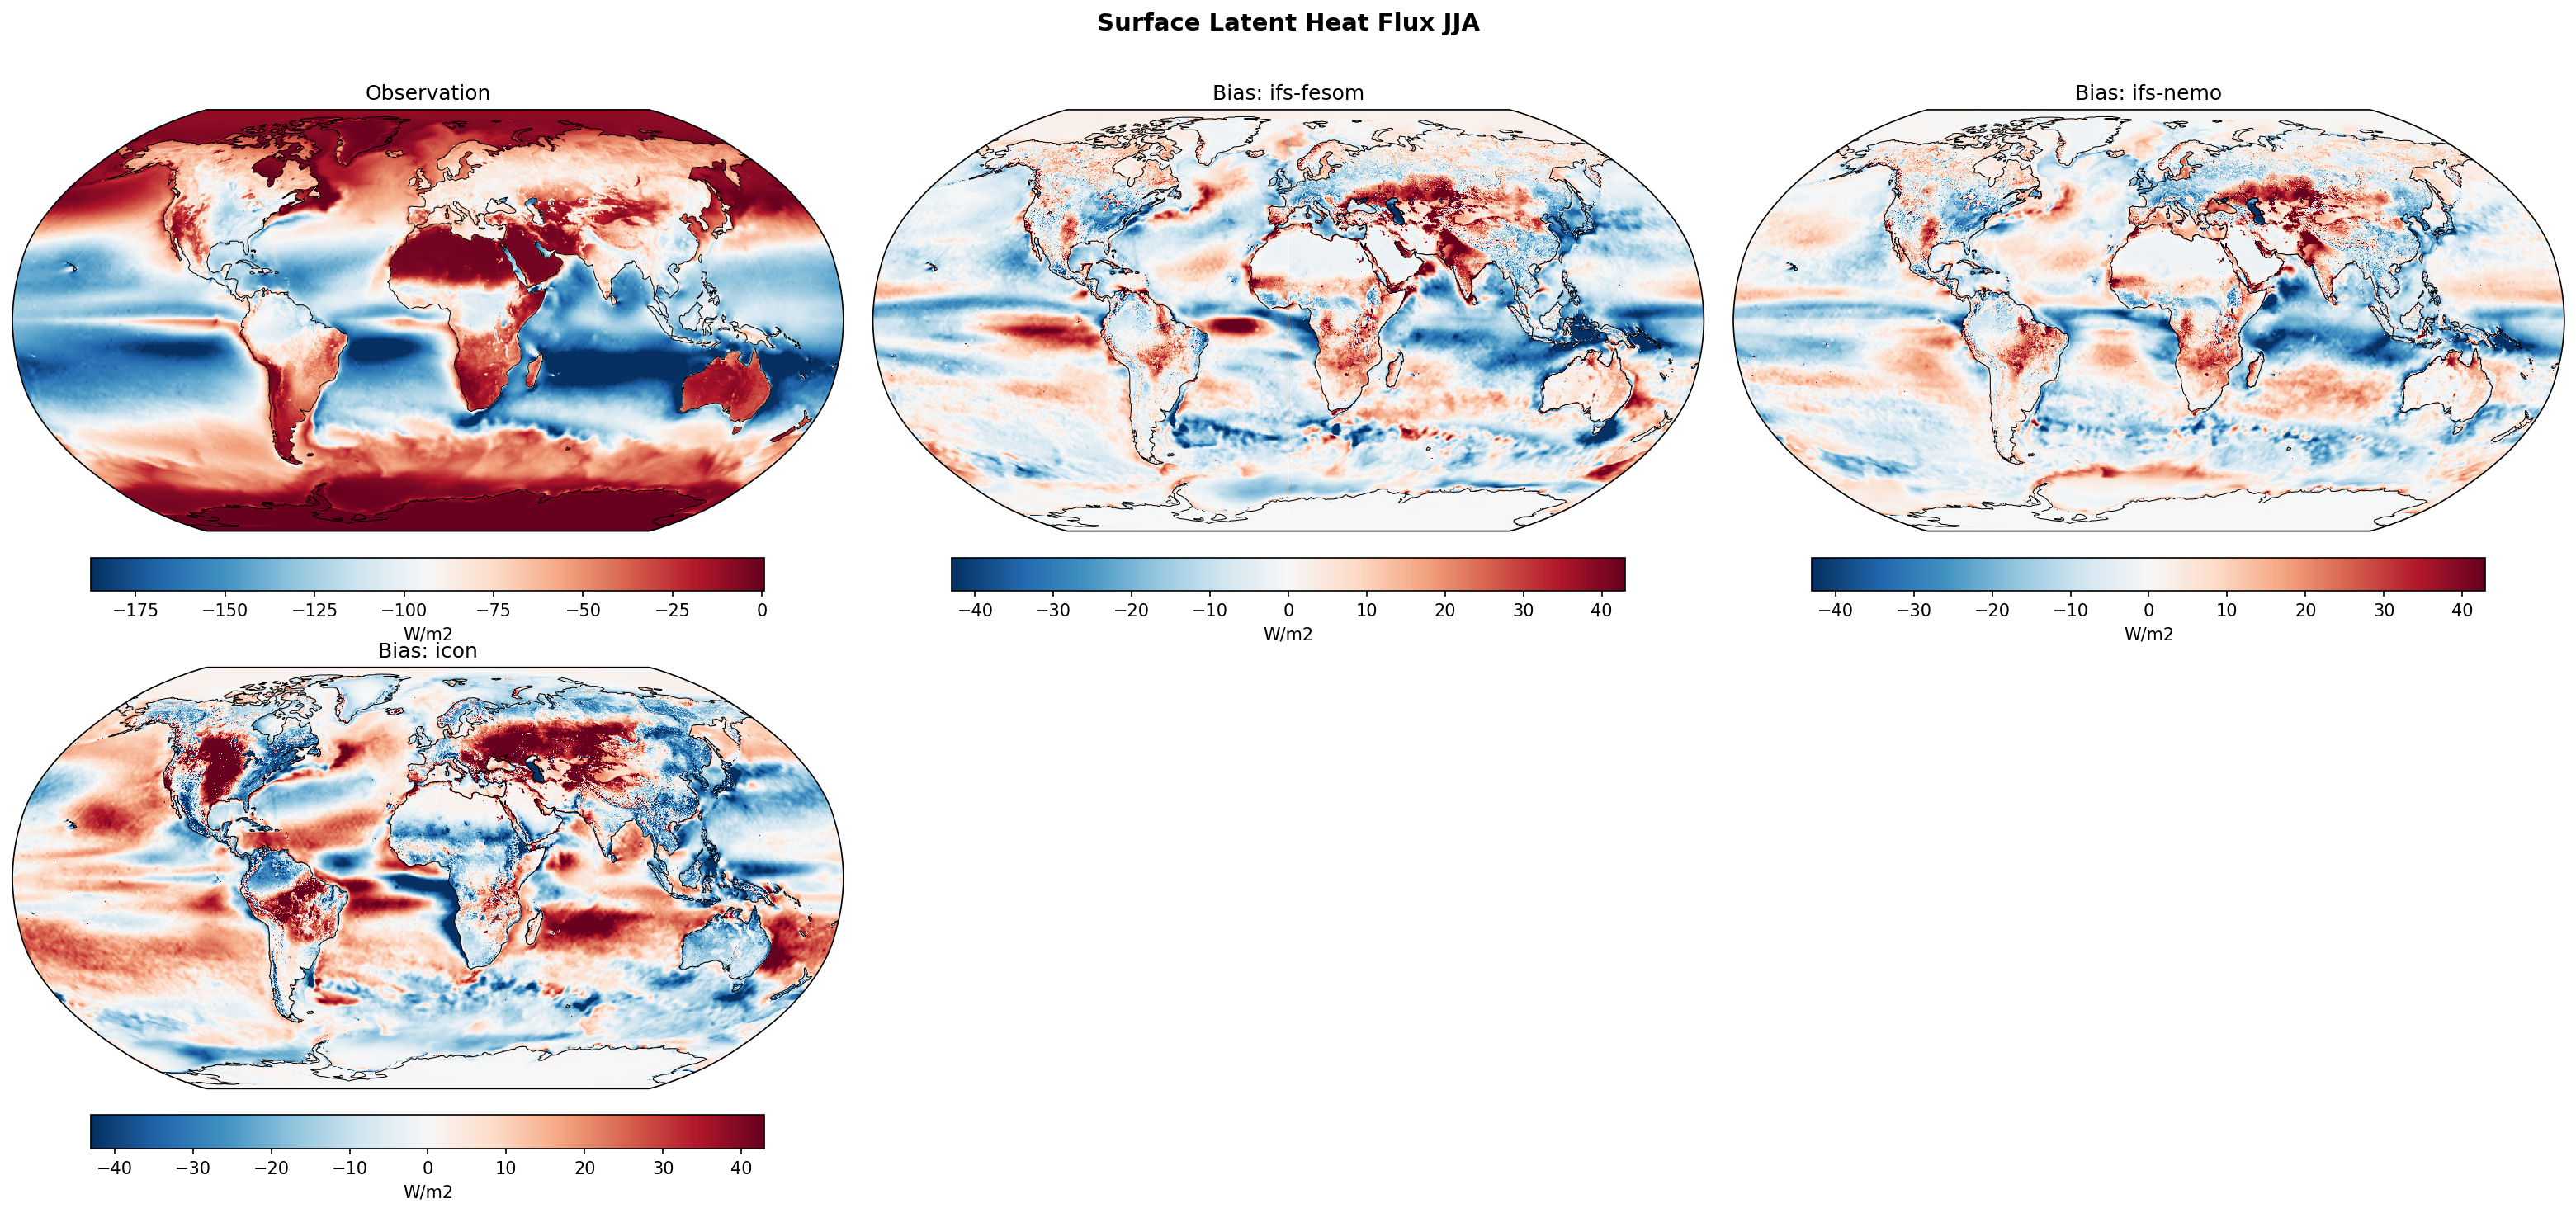
| Variables | avg_slhtf |
|---|---|
| Models | ifs-fesom, ifs-nemo, icon |
| Reference Dataset | ERA5 |
| Units | W/m2 |
| Period | 1990–2014 |
Summary high
The figure evaluates the JJA surface latent heat flux (SLHF) climatology of three high-resolution coupled models against ERA5, revealing systemic biases in evaporation rates over both major landmasses and specific oceanic regimes.
Key Findings
- All three models consistently underestimate upward latent heat flux (evaporation) over Northern Hemisphere landmasses and the Amazon basin during the JJA season.
- Over the equatorial Pacific and Atlantic, IFS-FESOM and ICON show substantial underestimation of evaporation, whereas IFS-NEMO exhibits a much weaker bias in these regions.
- Conversely, models tend to overestimate evaporation over the Arabian Sea and the Bay of Bengal, with the strongest overestimations seen in ICON.
Spatial Patterns
The ERA5 climatology shows strong upward fluxes (negative values) over the subtropical oceans and tropical land. Bias maps reveal positive biases (red, indicating underestimated upward flux/evaporation) widespread over Eurasia, North America, the Amazon, and equatorial ocean cold tongues. Negative biases (blue, indicating overestimated evaporation) dominate the Arabian Sea, the Southern Ocean (particularly in ICON), and scattered subtropical marine regions.
Model Agreement
The models show strong qualitative agreement over land, universally underestimating summer evaporation. Oceanic agreement is mixed: while all models overestimate evaporation in the Arabian Sea, they diverge in the equatorial Pacific and Southern Ocean, where IFS-NEMO performs best and ICON shows the largest magnitude biases.
Physical Interpretation
The widespread underestimation of evaporation over Northern Hemisphere land in summer likely points to overly rapid soil moisture depletion or deficiencies in the land surface models' representation of evapotranspiration. Over the equatorial Pacific and Atlantic, the deficit in evaporation is a classic signature of the 'cold tongue bias' in coupled models, where too-cold SSTs suppress latent heat release. The overestimated evaporation in the Arabian Sea is likely linked to an overly intense representation of the Findlater jet and the South Asian summer monsoon low-level circulation, which enhances surface wind speeds and thereby bulk turbulent fluxes.
Caveats
- Latent heat flux is not directly assimilated in ERA5 but is a derived quantity from bulk aerodynamic formulas, making it sensitive to uncertainties in boundary layer winds, SST, and humidity.
- The sign convention (upward flux is negative in ERA5) means that a positive bias corresponds to a smaller magnitude of upward flux (less evaporation).
Surface Net Longwave Radiation Annual Mean Bias
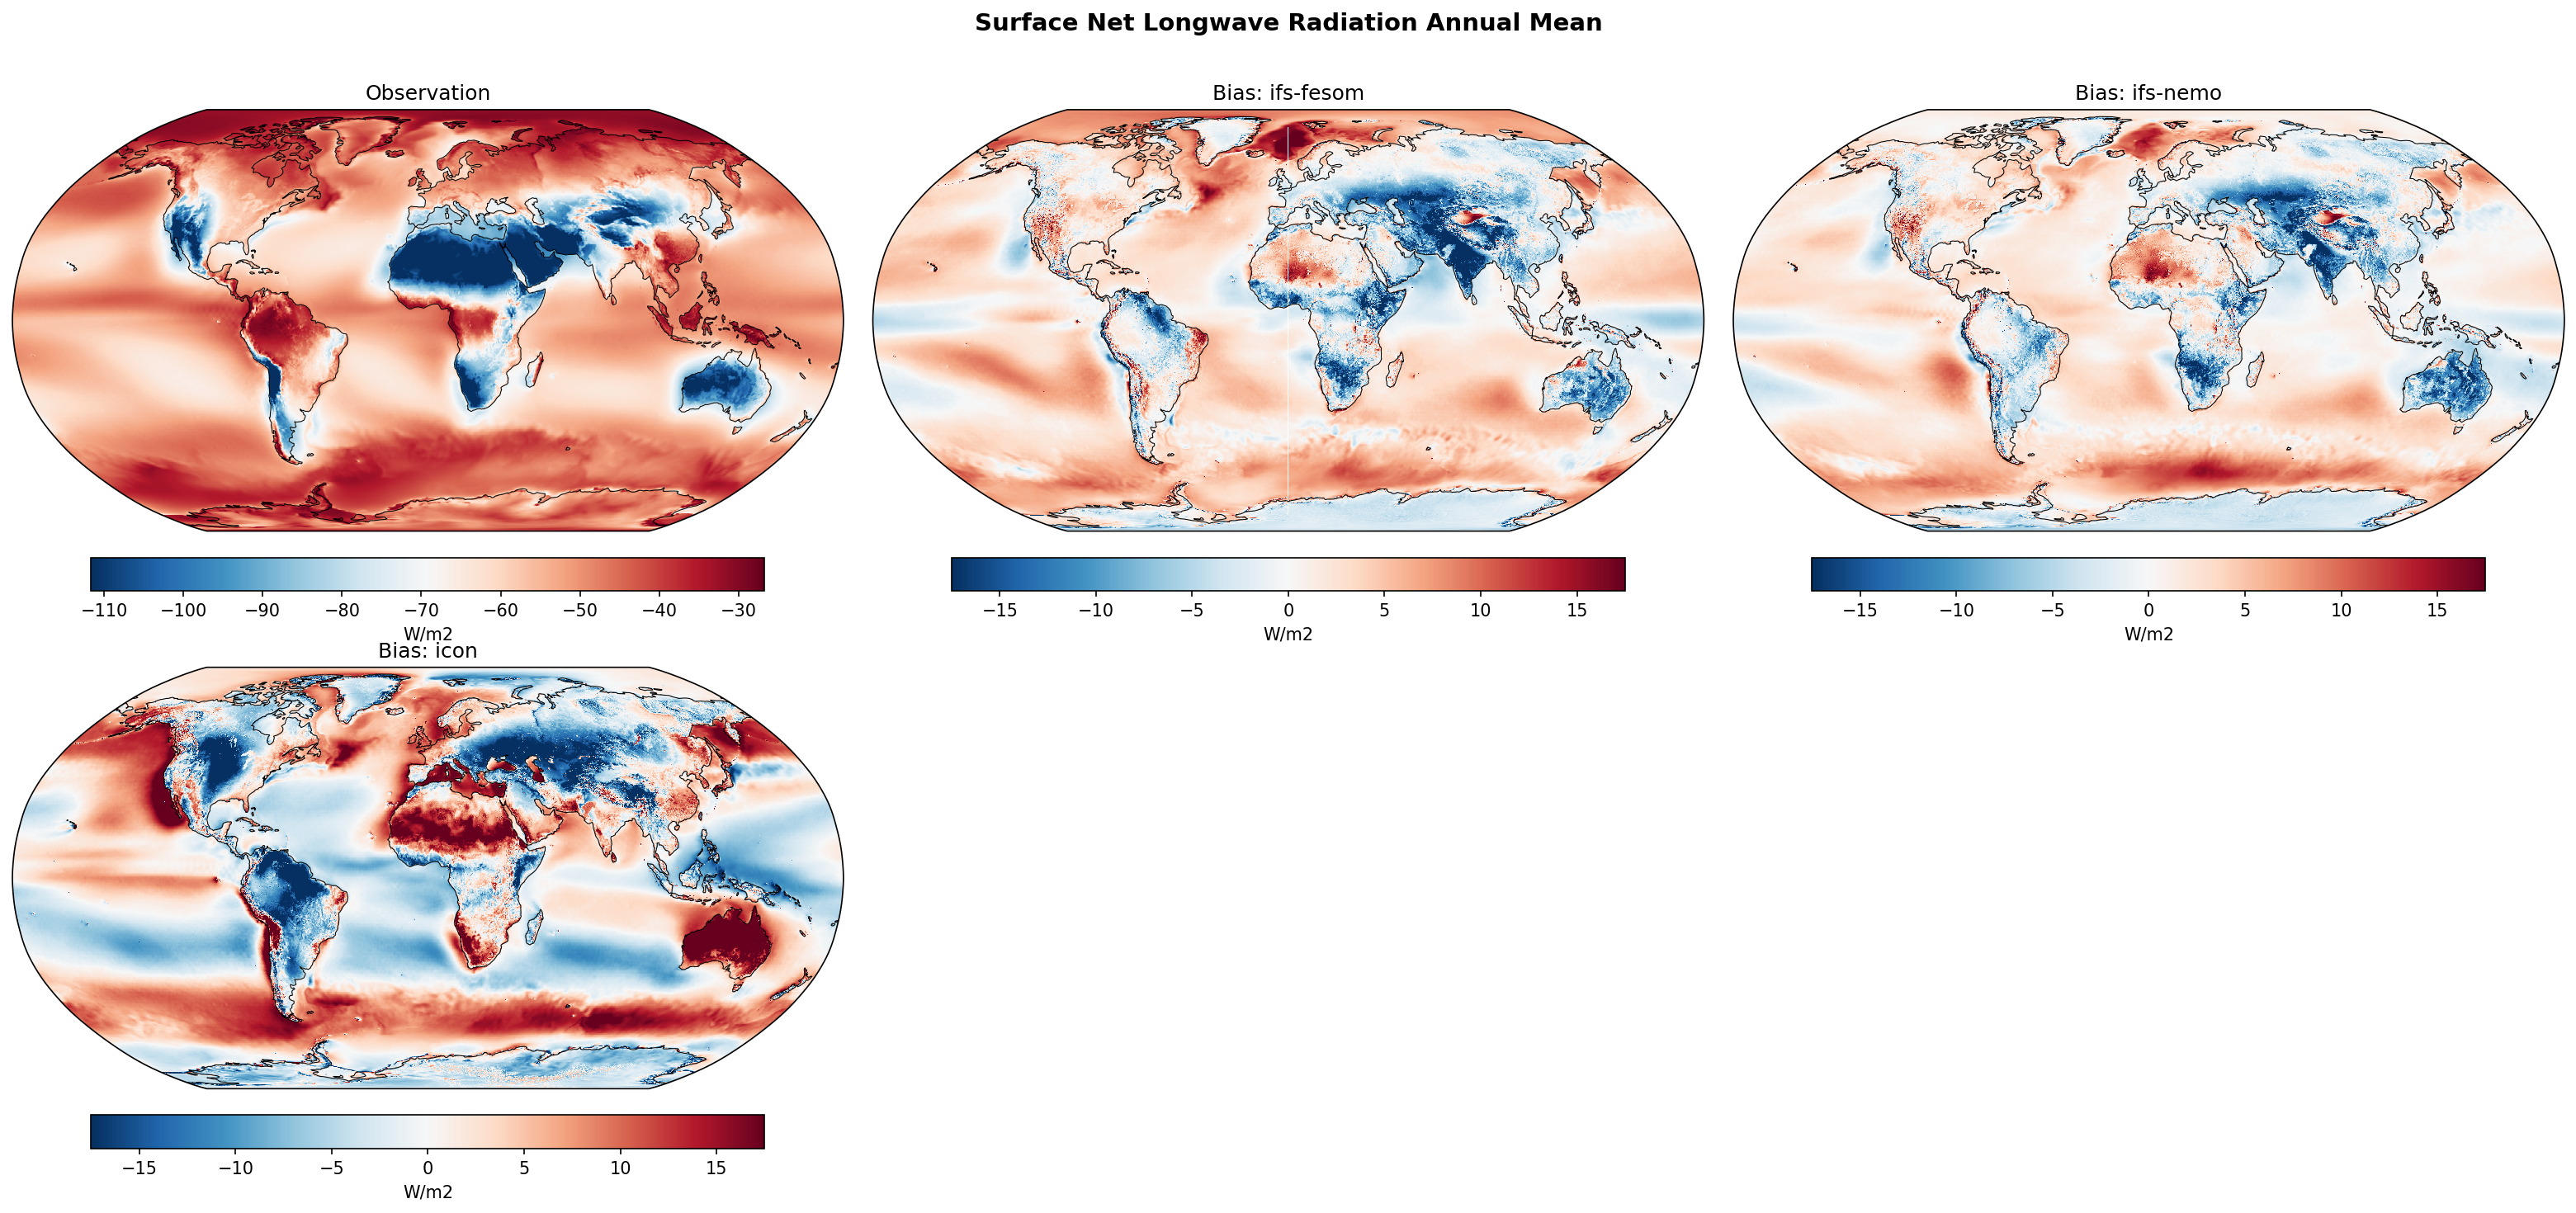
| Variables | avg_snlwrf |
|---|---|
| Models | ifs-fesom, ifs-nemo, icon |
| Reference Dataset | ERA5 |
| Units | W/m2 |
| Period | 1990–2014 |
| ifs-fesom | Global Mean Bias: 1.14 · Rmse: 5.73 |
| ifs-nemo | Global Mean Bias: 0.79 · Rmse: 5.00 |
| icon | Global Mean Bias: 0.77 · Rmse: 8.81 |
Summary high
Annual mean surface net longwave radiation bias maps reveal distinct and contrasting error structures between the IFS-based models and ICON when compared to ERA5.
Key Findings
- IFS-FESOM and IFS-NEMO share highly similar spatial bias patterns and have lower overall errors (RMSE ~4.8-5.6 W/m2) compared to ICON.
- ICON exhibits severe regional biases (RMSE 8.68 W/m2) with large compensating errors that result in an artificially low global mean bias (0.77 W/m2).
- IFS models generally show negative biases over arid land and positive biases over cloudy marine regions, whereas ICON frequently exhibits the opposite sign in these regions.
Spatial Patterns
The ERA5 climatology shows strong net surface cooling (highly negative values) over cloud-free deserts and weaker cooling over cloudy, humid regions. IFS models show positive biases (less negative/weaker net cooling) over the Southern Ocean, stratocumulus regions, and the Arctic, with negative biases (stronger net cooling) over deserts like the Sahara and Australia. In contrast, ICON features intense positive biases over the Sahara, Middle East, and Australia, and widespread negative biases across major ocean basins, particularly in the subtropics and trade-wind regions.
Model Agreement
IFS-FESOM and IFS-NEMO agree closely with one another, reflecting the dominance of their shared atmospheric model (IFS) in determining radiative fluxes. ICON shows poor inter-model agreement with the IFS models, displaying opposite bias signs over major landmasses (e.g., North Africa) and vast tracts of the global ocean.
Physical Interpretation
Surface net longwave radiation depends on upward surface emission (governed by surface temperature) and downward atmospheric emission (driven by temperature, humidity, and clouds). The positive biases in IFS over stratocumulus decks and the Southern Ocean likely indicate either excessive low cloud cover/optical depth (too much downward longwave) or cold surface temperature biases. Conversely, ICON's strong negative bias over subtropical oceans strongly suggests a deficit in marine low clouds, leading to insufficient downward longwave radiation. ICON's positive biases over deserts may point to cold land surface temperature biases, excessive atmospheric dust, or anomalous column water vapor.
Caveats
- Net longwave radiation biases conflate errors in surface temperature (upward component) and atmospheric state/clouds (downward component); analyzing the components separately is required for precise attribution.
- ERA5 surface radiation fields are model-derived products and inherently carry uncertainties, particularly over the Southern Ocean where cloud phase and supercooled liquid water are notoriously difficult to constrain.
Surface Net Longwave Radiation DJF Bias
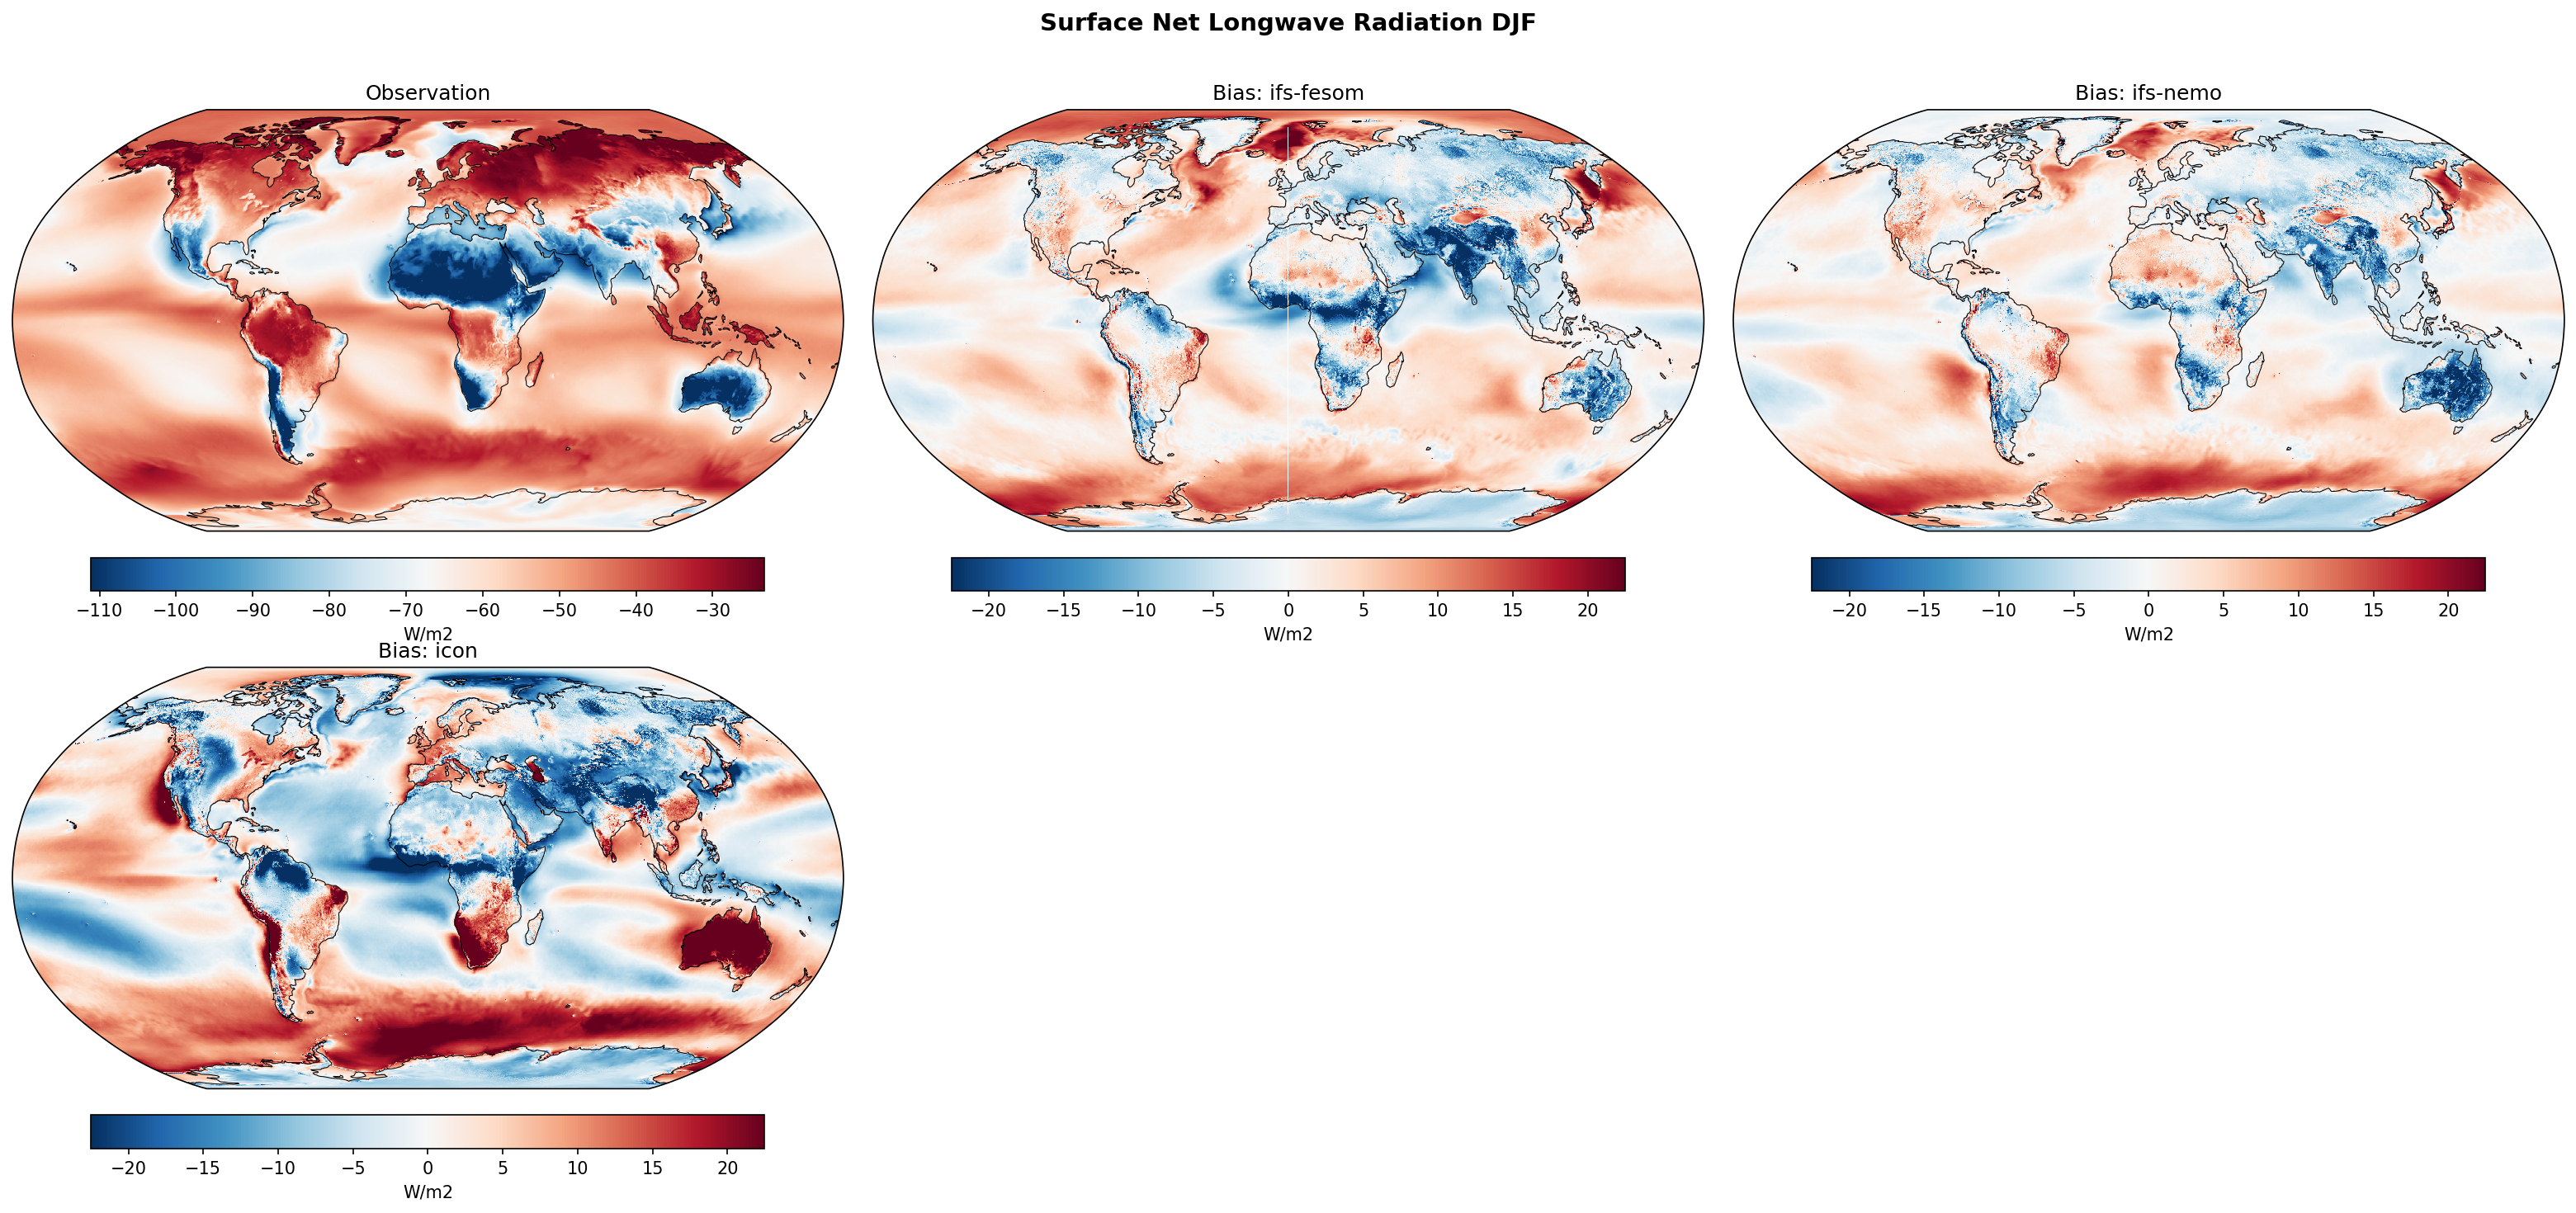
| Variables | avg_snlwrf |
|---|---|
| Models | ifs-fesom, ifs-nemo, icon |
| Reference Dataset | ERA5 |
| Units | W/m2 |
| Period | 1990–2014 |
Summary high
This figure presents DJF climatology bias maps of Surface Net Longwave Radiation for three high-resolution DestinE models (IFS-FESOM, IFS-NEMO, ICON) compared against ERA5 reanalysis, revealing distinct regional biases strongly tied to the atmospheric component.
Key Findings
- IFS-FESOM and IFS-NEMO exhibit nearly identical bias patterns, demonstrating that the choice of high-resolution ocean model has minimal impact on this radiatively driven atmospheric variable.
- All three models show a systematic positive bias (reduced net surface cooling) over the Southern Ocean, though the magnitude and latitudinal extent are significantly larger in ICON.
- ICON displays prominent and widespread negative biases (excessive net surface cooling) over Northern Hemisphere landmasses and tropical oceans, diverging sharply from the IFS-based models.
Spatial Patterns
Observations show strongest net longwave cooling (deep blue, ~ -100 W/m2) over clear-sky deserts and subtropical oceans, and weakest cooling (dark red) over the moist, cloudy ITCZ and winter high latitudes. Bias maps indicate that IFS models slightly underestimate cooling (positive bias, 5-15 W/m2) over NH landmasses and the Southern Ocean, while overestimating cooling (negative bias) in patchy tropical ocean regions. ICON shows a much sharper contrast: intense positive biases over the Southern Ocean and Australia (summer), combined with strong negative biases (-15 to -20 W/m2) across Europe, Asia, North America, and broad swaths of the tropical Atlantic and Pacific.
Model Agreement
Inter-model agreement is exceptionally high between IFS-FESOM and IFS-NEMO, indicating the dominance of the IFS atmospheric physics. Agreement between the IFS models and ICON is low, particularly over land and subtropical oceans. Overall, the IFS-based models demonstrate much better agreement with ERA5 observations, exhibiting lower-amplitude biases, whereas ICON struggles with large spatial gradients in surface radiation errors.
Physical Interpretation
Surface net longwave radiation is largely controlled by downward longwave fluxes, which are highly sensitive to low cloud cover, cloud optical depth, and lower-tropospheric moisture/temperature. The ubiquitous positive bias over the Southern Ocean across all models likely stems from the well-known 'too few, too bright' mixed-phase cloud problem, where excess supercooled liquid water leads to overly opaque clouds that trap too much downward longwave radiation. Conversely, ICON's strong negative biases over NH winter landmasses and tropical oceans suggest an underestimation of downward longwave radiation, pointing to potential deficiencies in low-cloud fraction or an atmospheric boundary layer that is too dry or too cold.
Caveats
- ERA5 surface radiation fields are derived from the forecast model's parameterizations rather than direct assimilation of surface fluxes, meaning the 'observation' itself contains inherent model uncertainties compared to satellite-derived products like CERES.
- The analysis is restricted to the DJF season; evaluating JJA is necessary to determine whether the large biases over NH land and the Southern Ocean are seasonally dependent or persistent throughout the year.
Surface Net Longwave Radiation JJA Bias
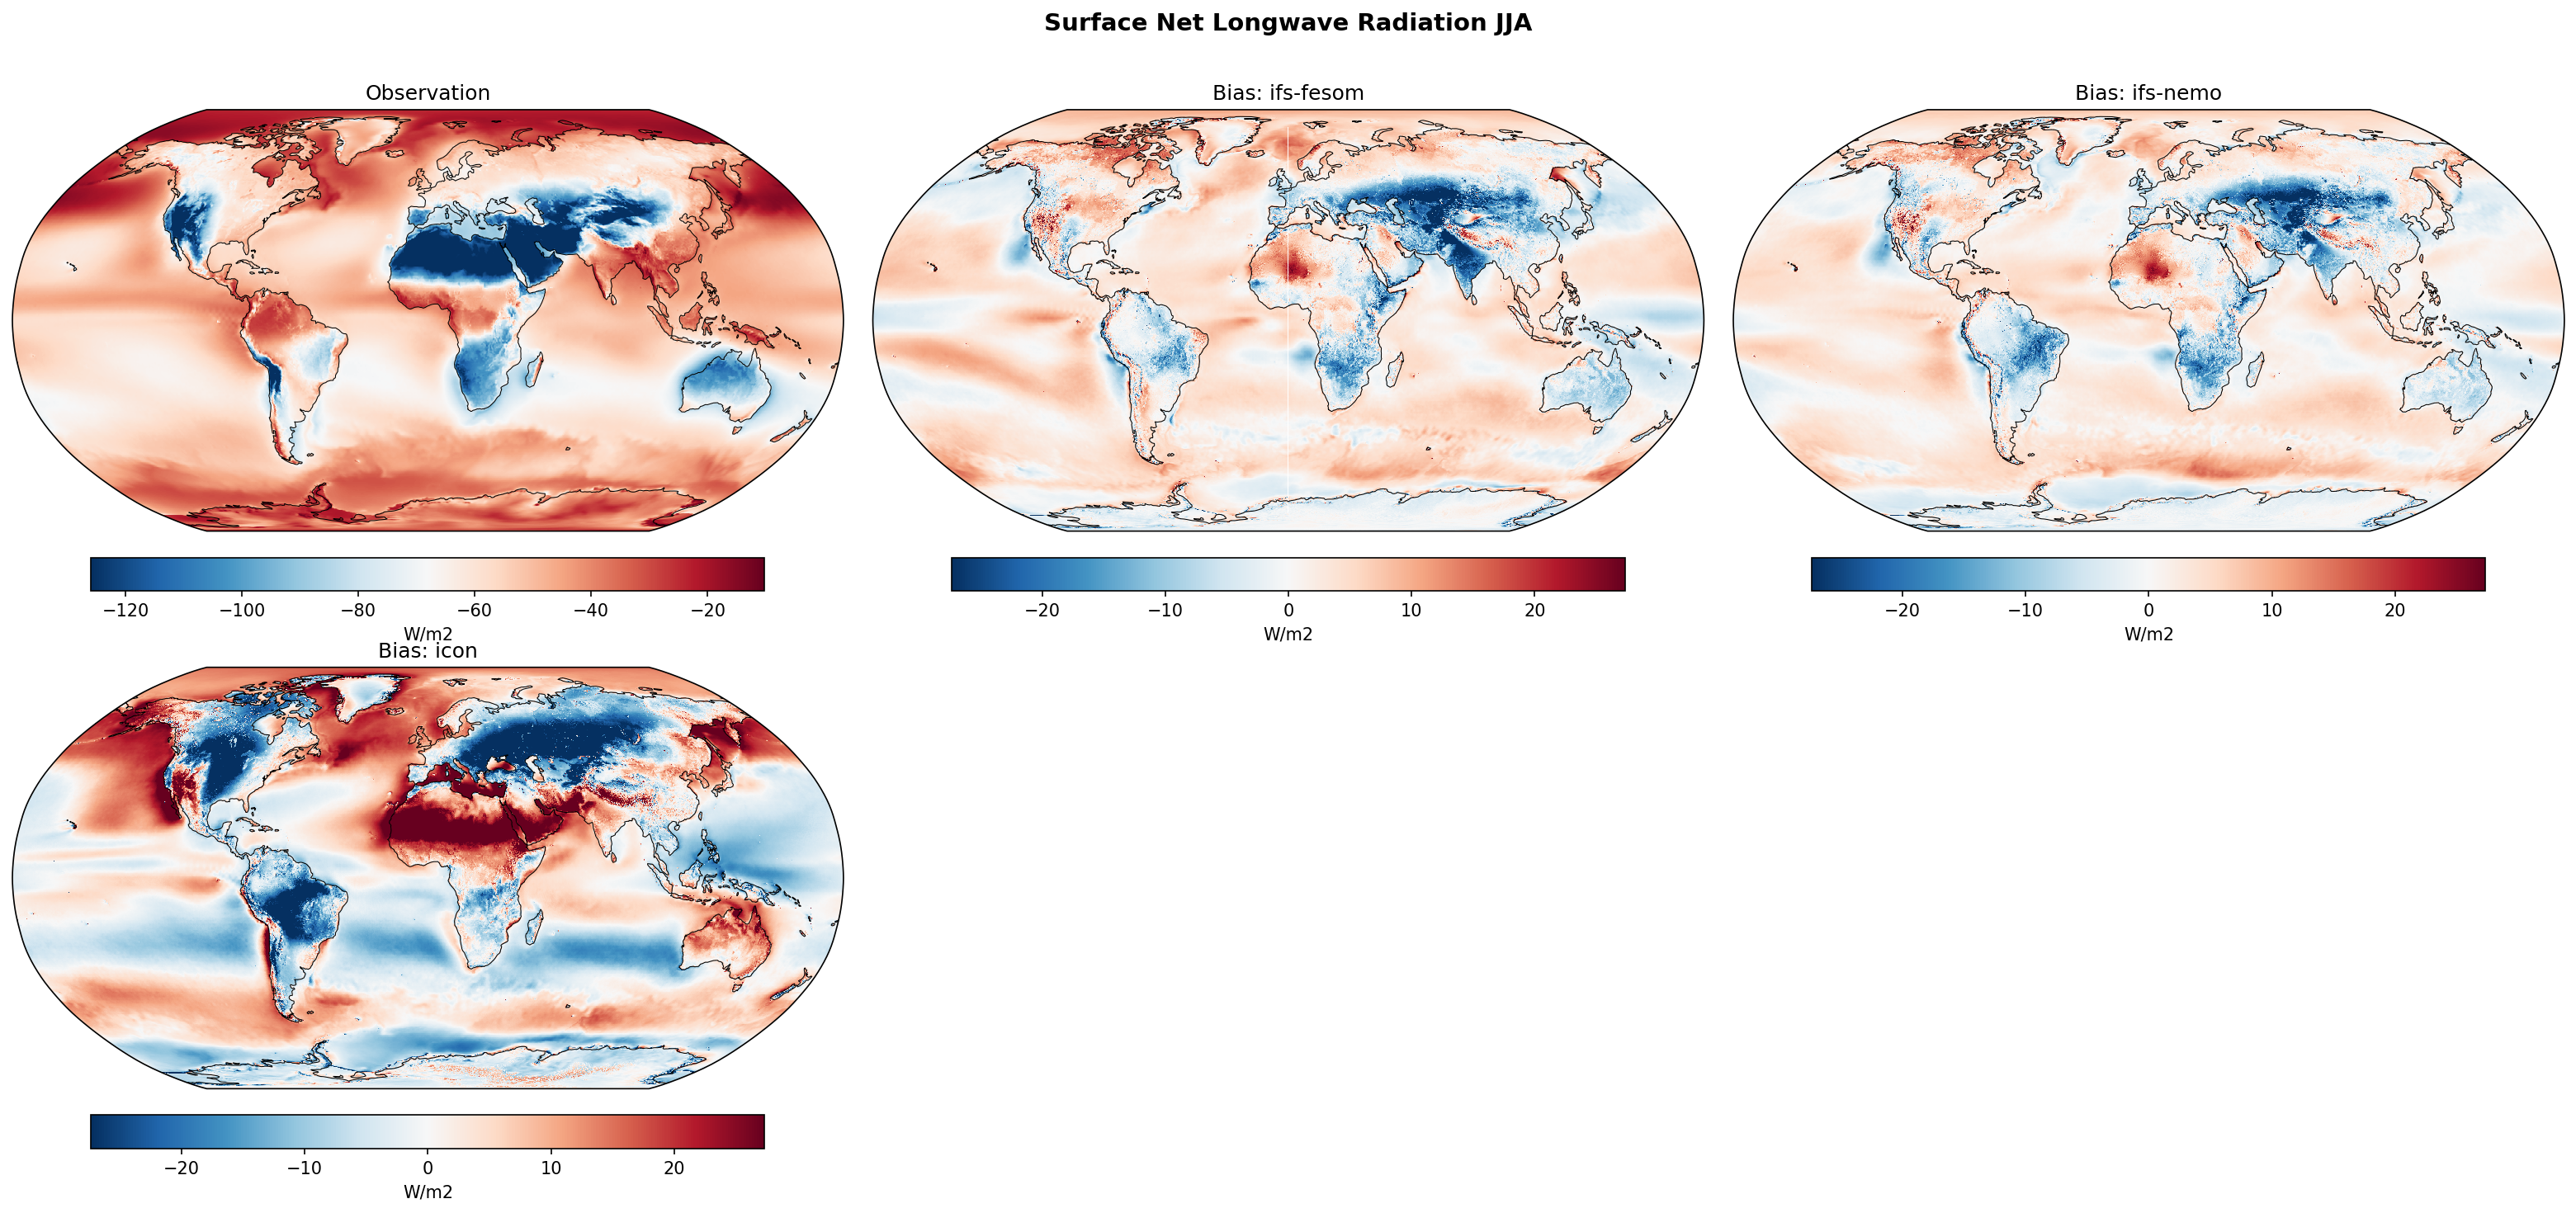
| Variables | avg_snlwrf |
|---|---|
| Models | ifs-fesom, ifs-nemo, icon |
| Reference Dataset | ERA5 |
| Units | W/m2 |
| Period | 1990–2014 |
Summary high
High-resolution bias maps of JJA Surface Net Longwave Radiation reveal consistent, moderate biases in IFS-coupled models and severe, widespread biases in the ICON model compared to ERA5 reanalysis.
Key Findings
- IFS-FESOM and IFS-NEMO display nearly identical bias patterns, indicating that the atmospheric component (IFS) completely dominates the surface longwave radiation bias regardless of the ocean model.
- The ICON model exhibits substantially larger biases than the IFS configurations, characterized by massive errors exceeding 25 W/m2 in multiple regions.
- Common structural errors include negative biases over Northern Hemisphere summer continents (Eurasia, North America) and positive biases over the Southern Ocean and marine stratocumulus decks.
Spatial Patterns
Negative biases (excessive net surface longwave cooling) are prominent over boreal landmasses in Eurasia and North America, particularly pronounced and widespread in ICON. Positive biases (insufficient net longwave cooling) are consistently found over the Southern Ocean and subtropical eastern ocean basins (stratocumulus regions) in the IFS models. ICON features anomalous, extreme positive biases over the Sahara, Middle East, North Atlantic, and high northern latitudes, contrasting with deep negative biases over the tropics and Amazon.
Model Agreement
There is excellent agreement between IFS-FESOM and IFS-NEMO in both spatial structure and magnitude. However, ICON diverges dramatically, showing much larger bias magnitudes and fundamentally different spatial error distributions, highlighting significant inter-model spread in atmospheric radiative transfer or cloud parameterizations.
Physical Interpretation
Surface net longwave biases are primarily driven by discrepancies in cloud cover, cloud base height, and atmospheric moisture. Positive biases over marine stratocumulus regions and the Southern Ocean suggest overestimations in low-level cloud fraction or optical thickness, leading to excessive downward longwave emission. Negative biases over summer continents imply a lack of clouds or water vapor, allowing excessive radiative cooling to space. ICON's extreme positive bias over the Sahara may be linked to issues in dry atmospheric profiling or the representation of dust aerosol radiative effects.
Caveats
- ERA5 surface radiative fluxes are largely model-derived products reliant on reanalysis cloud parameterizations, not direct observations, and carry their own systematic uncertainties.
- Differences in aerosol climatologies between the models and ERA5 (e.g., mineral dust over the Sahara) can strongly influence clear-sky longwave biases.
Surface Net Longwave Radiation (Clear-Sky) Annual Mean Bias
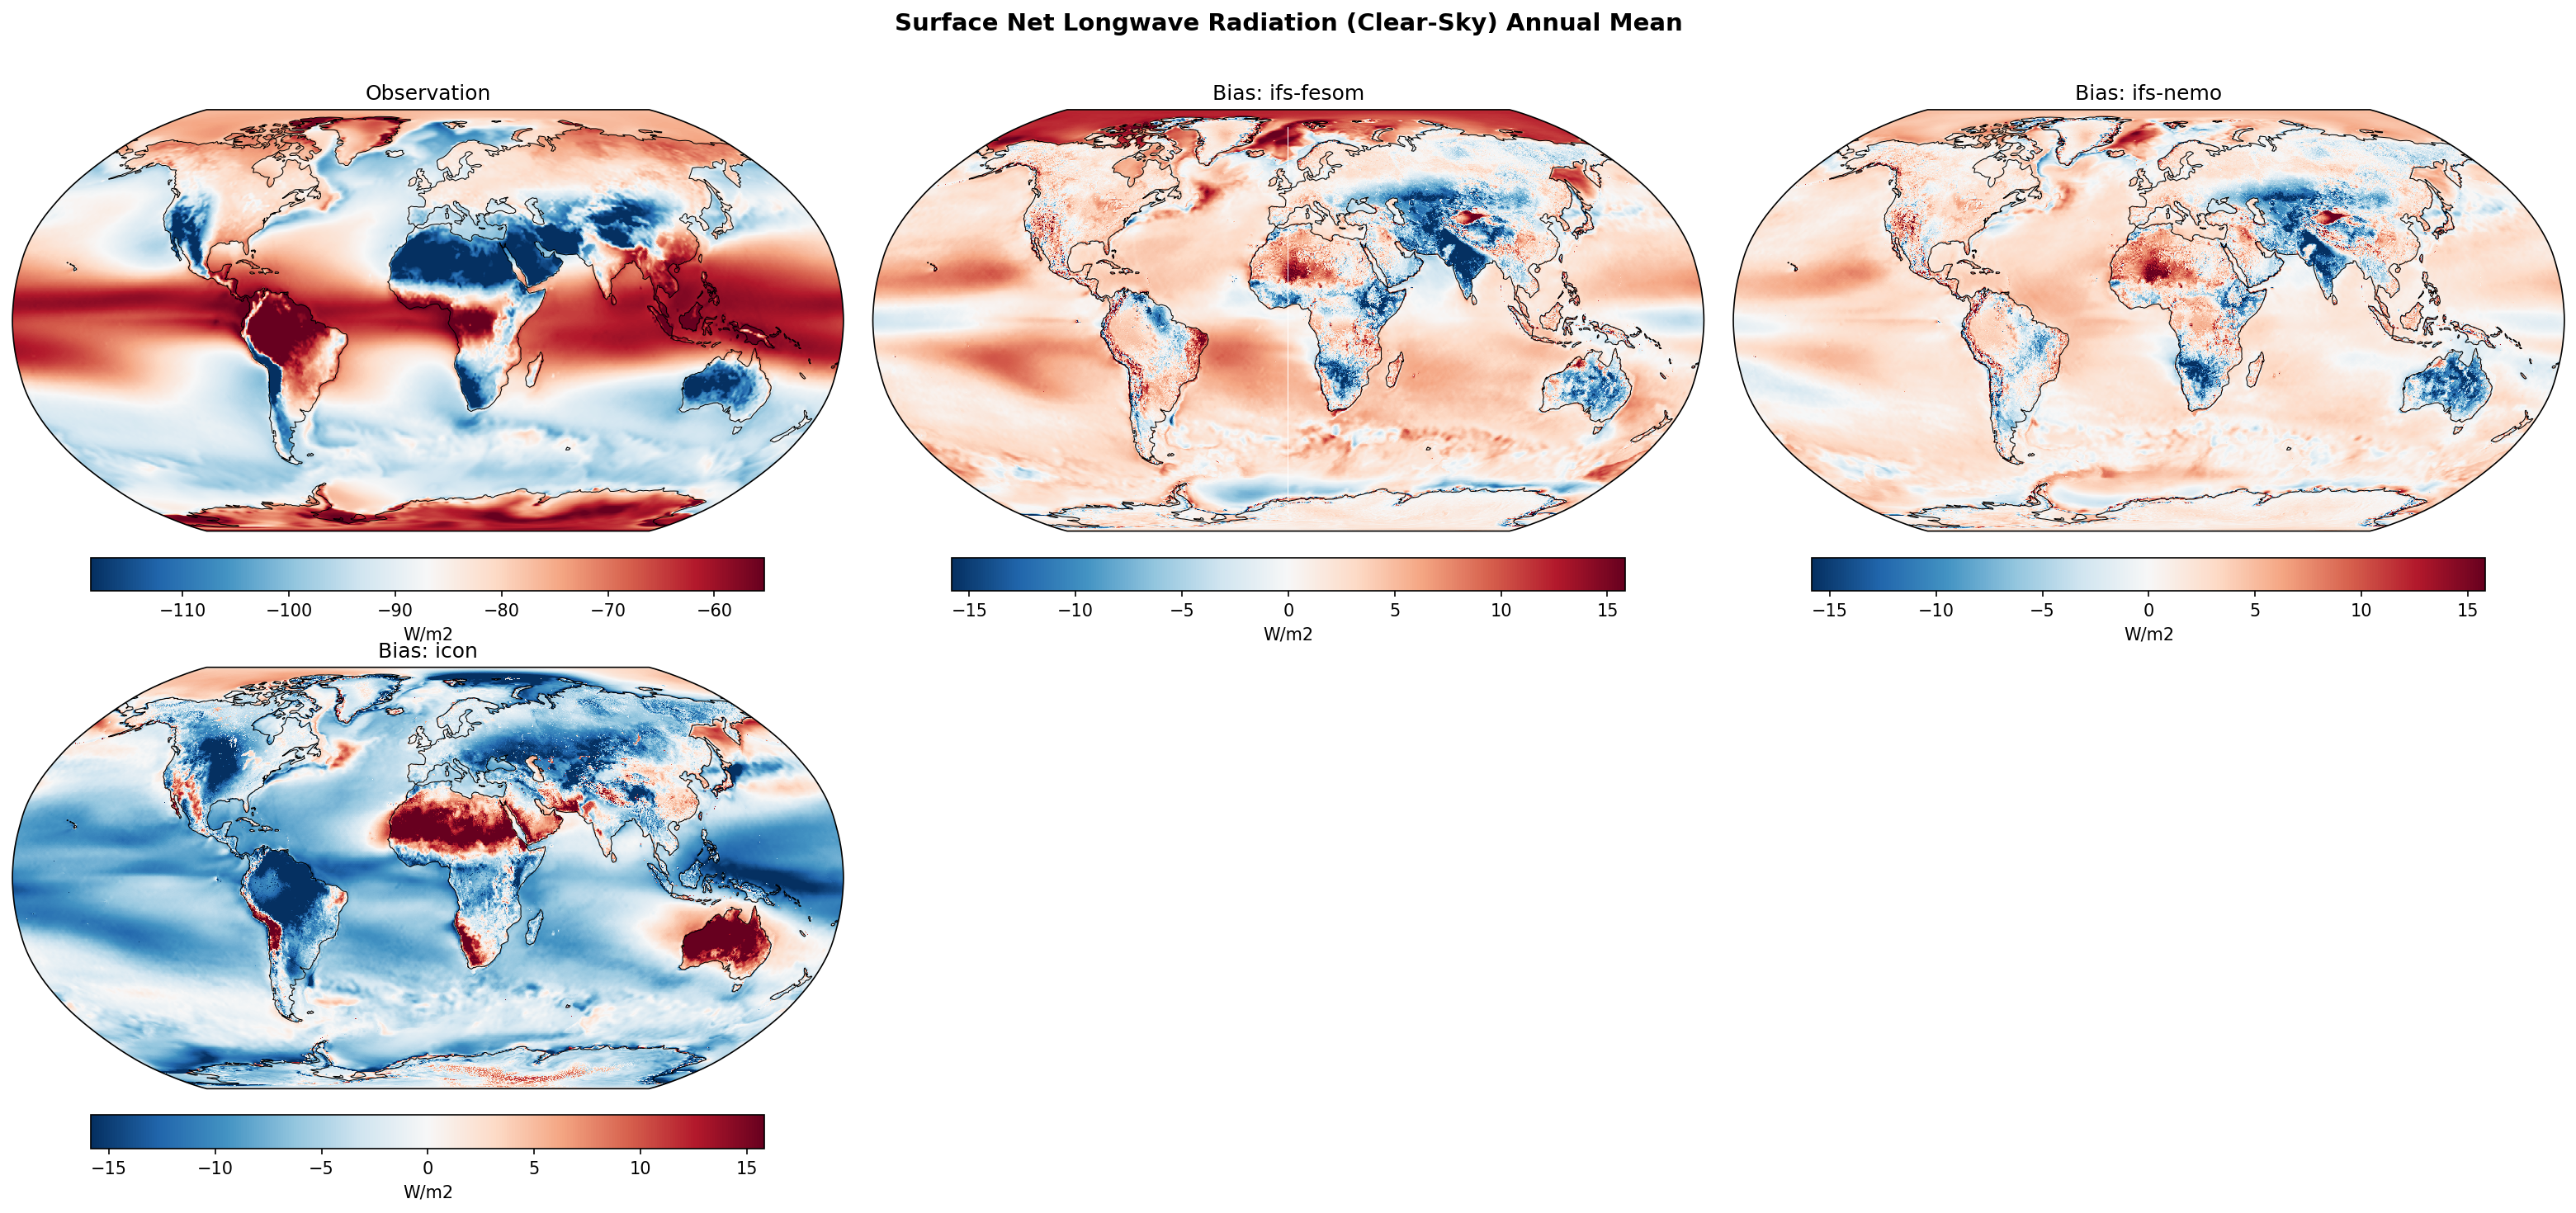
| Variables | avg_snlwrfcs |
|---|---|
| Models | ifs-fesom, ifs-nemo, icon |
| Reference Dataset | ERA5 |
| Units | W/m2 |
| Period | 1990–2014 |
| ifs-fesom | Global Mean Bias: 2.08 · Rmse: 5.15 |
| ifs-nemo | Global Mean Bias: 1.33 · Rmse: 4.07 |
| icon | Global Mean Bias: -4.33 · Rmse: 8.17 |
Summary high
This figure evaluates the annual mean clear-sky surface net longwave radiation from three high-resolution models against ERA5, highlighting significant differences in radiative biases between the ICON and IFS atmospheric models.
Key Findings
- IFS-FESOM and IFS-NEMO share similar spatial bias patterns characterized by positive biases over oceans and regional negative biases over land, with IFS-NEMO showing the lowest RMSE (3.97 W/m2).
- ICON exhibits a sharply contrasting pattern with strong negative biases over most oceans and strong positive biases over desert regions, resulting in the highest RMSE (8.13 W/m2).
- The stark divergence between ICON and the IFS models suggests fundamental differences in the modeling of boundary layer moisture or land-sea surface temperatures.
Spatial Patterns
Observationally, clear-sky net longwave loss is strongest in the dry subtropics (Sahara, Middle East) and weakest in the moist tropics and polar regions. IFS models exhibit broad positive biases (too little heat loss) over the oceans, particularly the tropical Pacific, and negative biases over tropical rainforests (Amazon, Congo) and the Tibetan Plateau. Conversely, ICON shows severe negative biases (excessive heat loss) across nearly all ocean basins and widespread positive biases over major deserts (Sahara, Australian outback).
Model Agreement
Inter-model agreement is high between IFS-FESOM and IFS-NEMO, which is expected given their shared IFS atmospheric component. However, agreement is extremely poor between the IFS models and ICON, which diverge completely in both the spatial distribution and the global mean sign of the clear-sky radiation biases.
Physical Interpretation
Clear-sky surface net longwave radiation depends strongly on surface emission (governed by skin temperature) and downward emission from the atmosphere (controlled by lower-tropospheric temperature and water vapor). The widespread negative biases over oceans in ICON suggest a dry bias in the marine boundary layer (reducing downward longwave) or overly warm sea surface temperatures. The positive biases in IFS models over oceans imply excessive lower-tropospheric moisture or cool surface temperatures, while their negative biases over tropical forests likely indicate a regional dry bias or excessive surface heating.
Caveats
- Clear-sky diagnostics represent hypothetical cloud-free conditions; full-sky radiation is more relevant for the actual coupled surface energy budget.
- ERA5 is a reanalysis product, and its clear-sky radiative fluxes depend heavily on its internal radiative transfer scheme and assumed moisture distributions, carrying their own inherent uncertainties.
Surface Net Longwave Radiation (Clear-Sky) DJF Bias
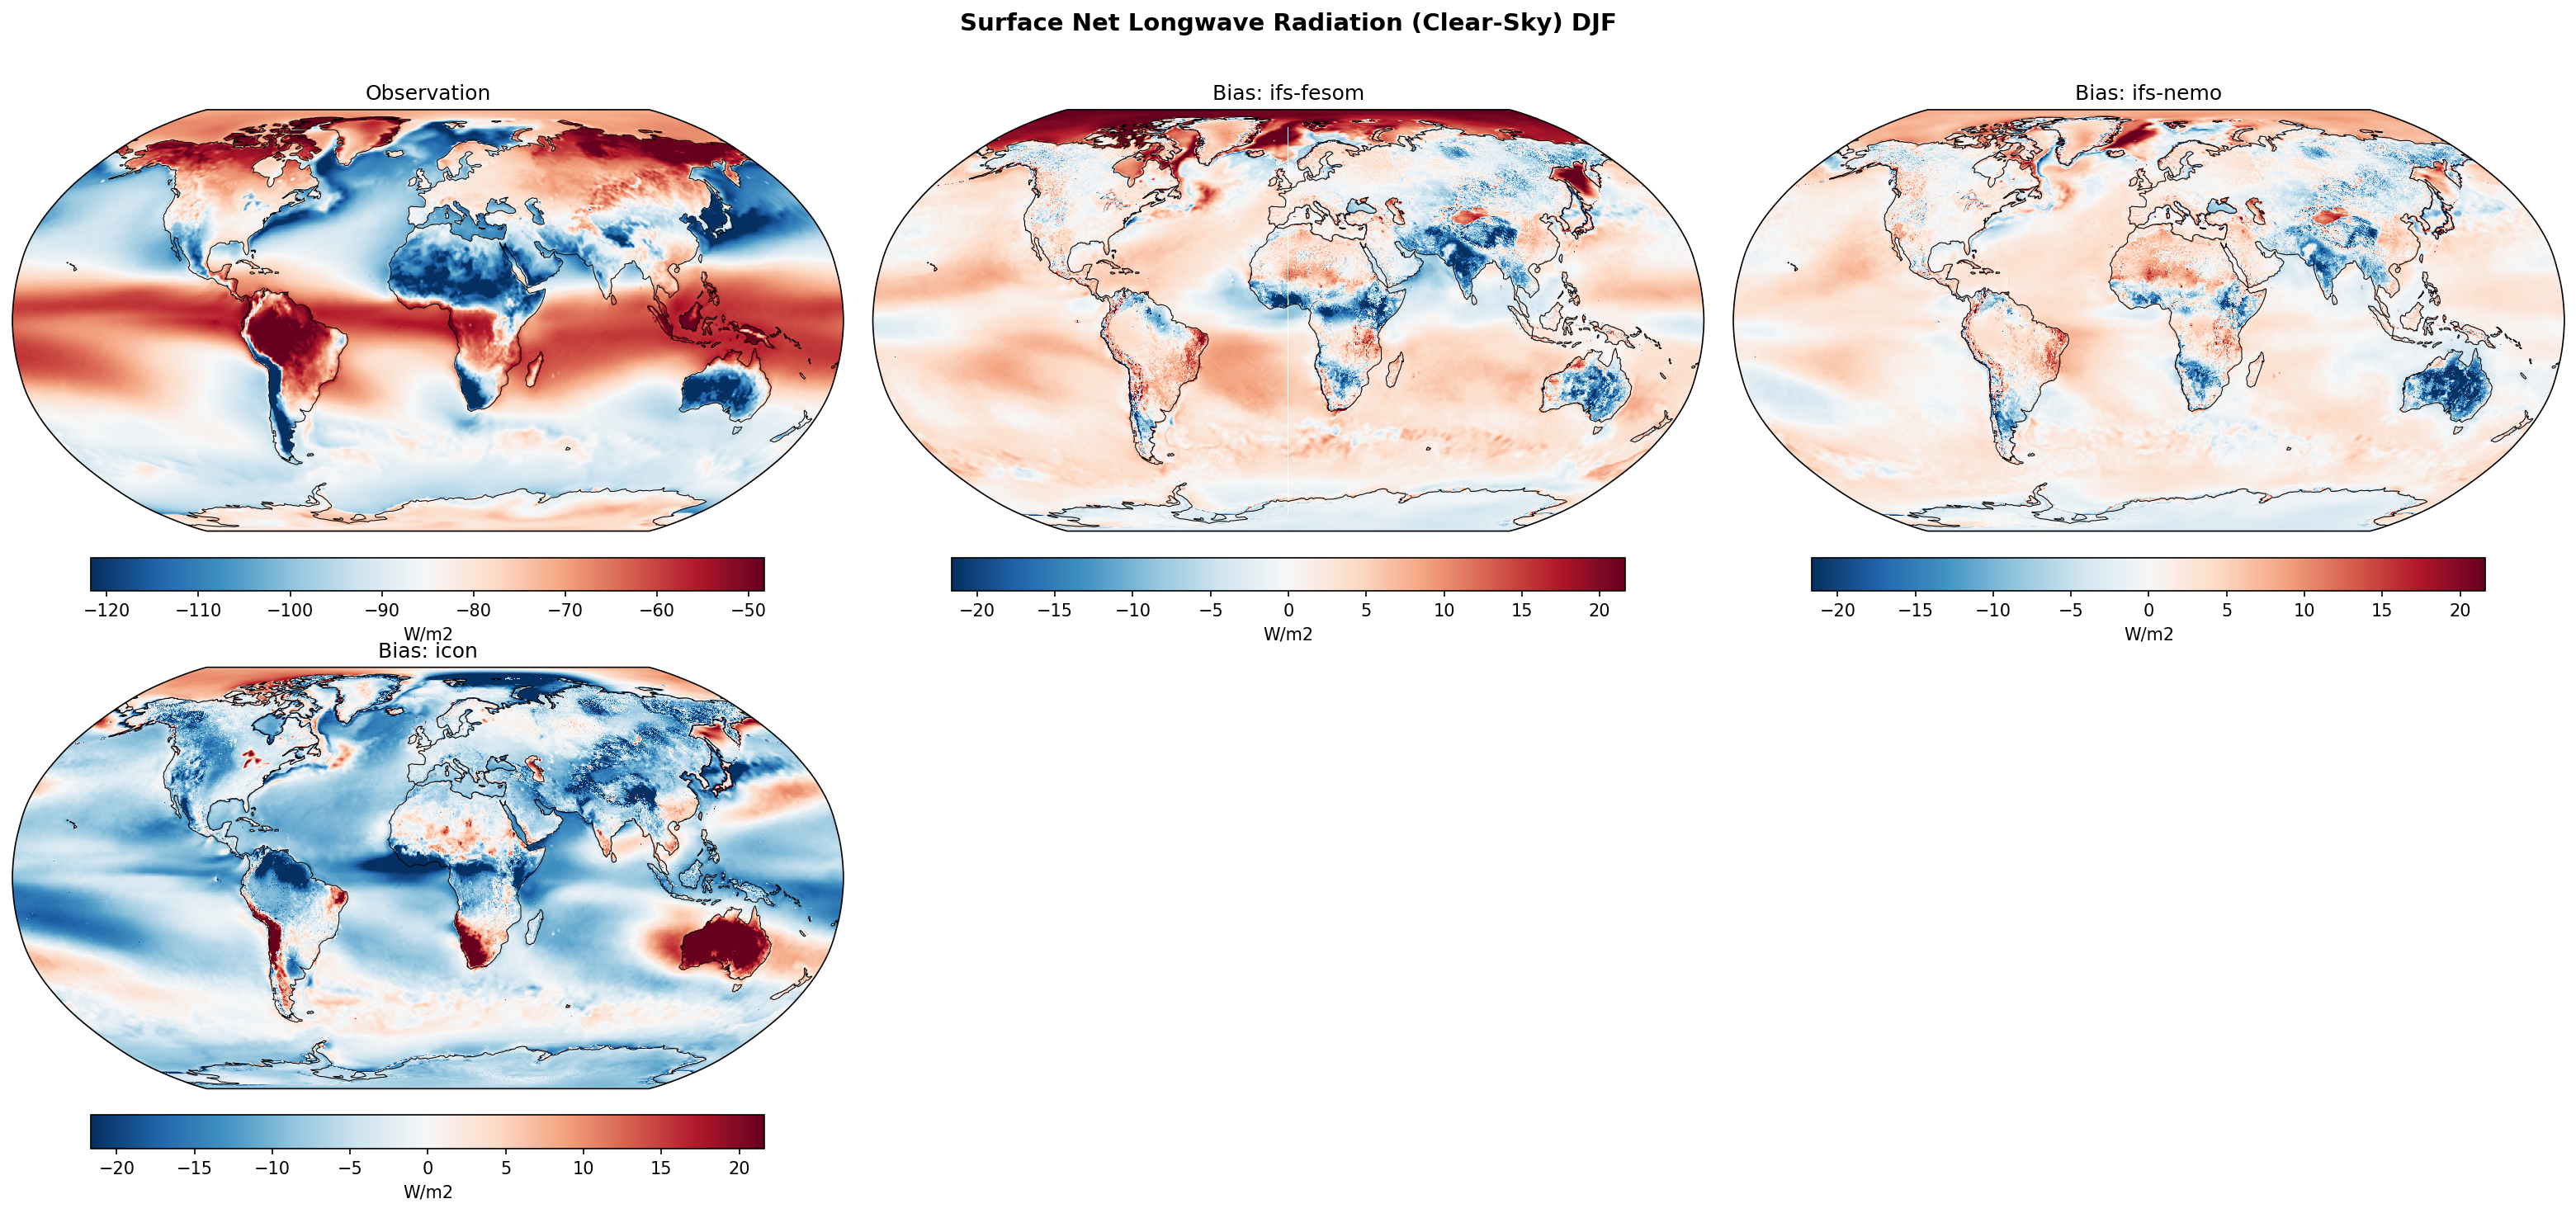
| Variables | avg_snlwrfcs |
|---|---|
| Models | ifs-fesom, ifs-nemo, icon |
| Reference Dataset | ERA5 |
| Units | W/m2 |
| Period | 1990–2014 |
Summary high
Global maps of surface net clear-sky longwave radiation biases during DJF reveal stark contrasts between the IFS-based models and ICON, reflecting significant differences in their simulated temperature and moisture mean states.
Key Findings
- IFS-FESOM and IFS-NEMO display nearly identical bias patterns, indicating that the shared atmospheric component dictates clear-sky longwave performance.
- The IFS models generally underestimate clear-sky surface cooling (positive biases) over mid-to-high latitude oceans and the Arctic, but overestimate cooling (negative biases) over tropical and subtropical land.
- ICON exhibits a fundamentally different bias spatial distribution, with widespread overestimated cooling (negative biases) across most oceans, the Arctic, and Northern Hemisphere landmasses.
Spatial Patterns
In the IFS models, strong positive biases (+10 to +20 W/m2) dominate the Arctic, Southern Ocean, and northern Eurasia, alongside notable negative biases over the Amazon, Congo, and Australia. Conversely, ICON features intense negative biases over the Arctic, Eurasia, North America, and major ocean basins, with localized positive biases emerging over Australia and southern Africa. High-resolution topographic imprints are visible in all models, particularly along the Himalayas and Andes.
Model Agreement
IFS-FESOM and IFS-NEMO agree exceptionally well with each other, underscoring the dominance of the atmospheric physics. However, there is poor inter-model agreement between the IFS suite and ICON, which often show biases of opposite signs in major regions such as the Arctic, Australia, and the mid-latitude oceans.
Physical Interpretation
Clear-sky surface net longwave radiation is controlled by surface temperature (driving upward emission) and atmospheric water vapor/temperature profiles (driving downward emission). Positive biases in IFS at high latitudes suggest either anomalously cold surfaces (reducing upward emission) or an overly warm/moist lower troposphere (enhancing downward emission). The widespread negative biases in ICON imply the opposite: either surface temperatures are too warm, or the lower atmosphere is excessively dry and cold, allowing too much radiation to escape. The sharp biases along mountain ranges highlight the impact of km-scale resolution on resolving steep surface temperature and moisture gradients.
Caveats
- Clear-sky radiation diagnostics are highly sensitive to how clear-sky conditions are sampled in the models versus the ERA5 reanalysis.
- Attributing these biases specifically to surface temperature versus atmospheric humidity requires concurrent analysis of lower-tropospheric profiles and surface energy balances.
Surface Net Longwave Radiation (Clear-Sky) JJA Bias
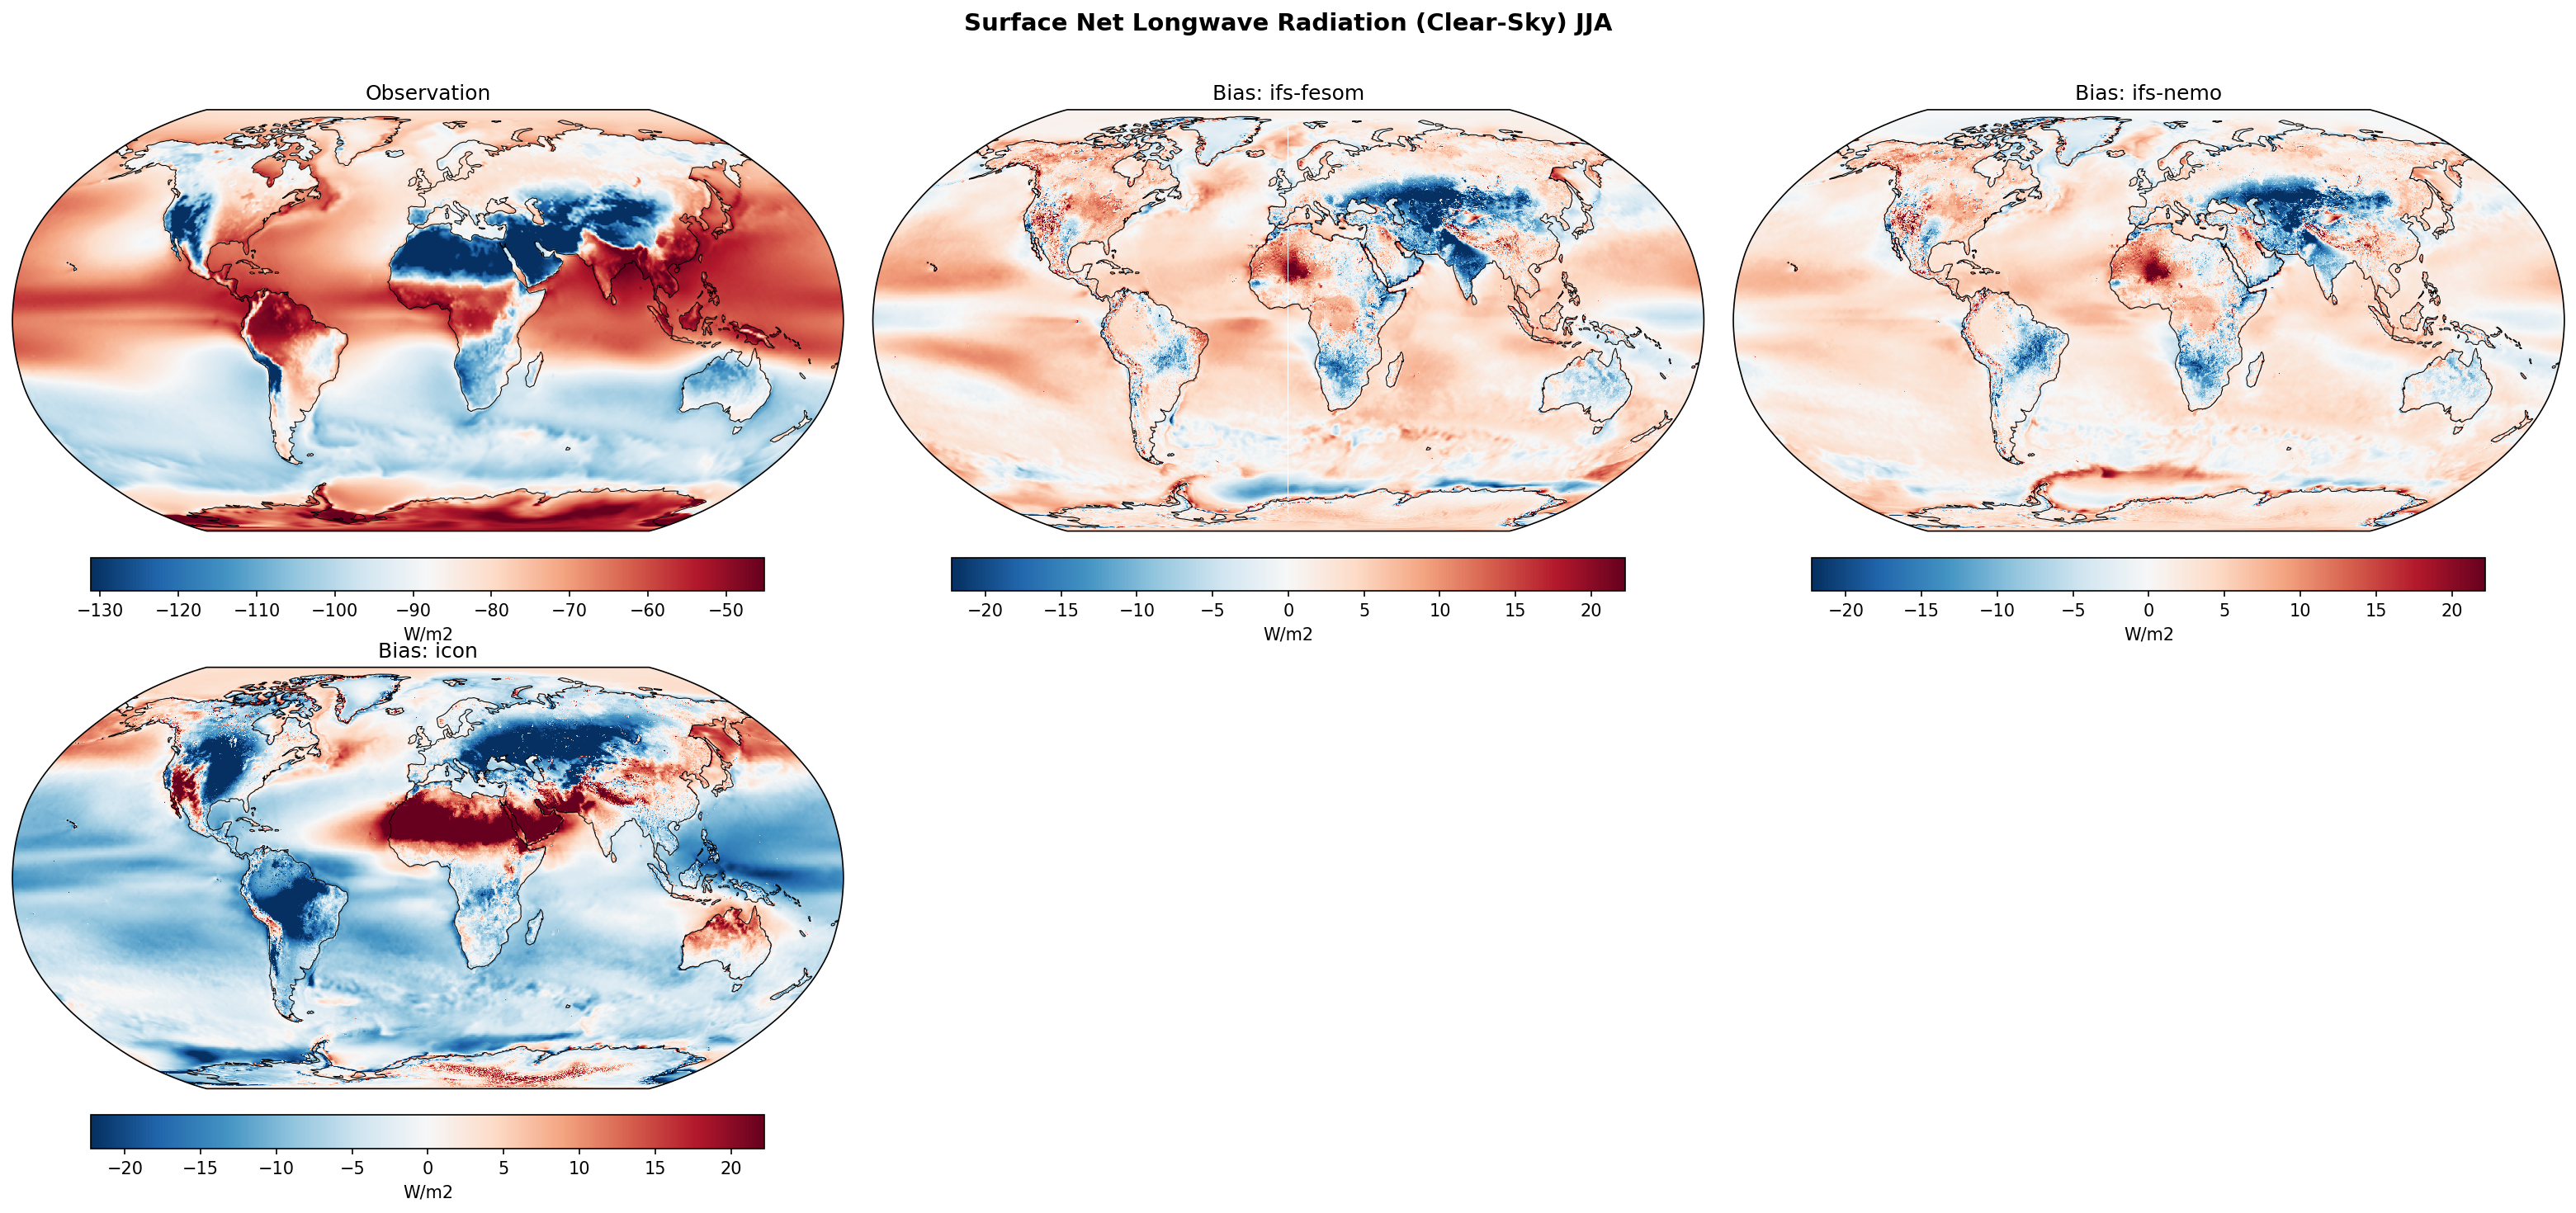
| Variables | avg_snlwrfcs |
|---|---|
| Models | ifs-fesom, ifs-nemo, icon |
| Reference Dataset | ERA5 |
| Units | W/m2 |
| Period | 1990–2014 |
Summary high
The figure presents JJA climatological biases for clear-sky surface net longwave radiation, revealing stark differences in magnitude and spatial distribution between the IFS-based models and ICON.
Key Findings
- IFS-FESOM and IFS-NEMO exhibit highly similar, moderate bias patterns, indicating the dominant role of their shared atmospheric component in clear-sky radiative fluxes.
- ICON demonstrates significantly larger biases globally compared to the IFS models, with pronounced negative biases over oceans and intense positive biases over the Sahara and Middle East.
- All three models share a tendency for negative biases (excessive net surface cooling) over the Tibetan Plateau and Central Asia.
Spatial Patterns
Observations (ERA5) show strong net upward (negative) fluxes over deserts (Sahara, Middle East) and high altitudes (Tibet) due to high surface temperatures and dry atmospheres. IFS models display weak-to-moderate positive biases over oceans and the Sahara, and negative biases over Central Asia, the western Americas, and Southern Africa. In contrast, ICON features severe negative biases across most global oceans, the Americas, and Eurasia, sharply contrasted by massive positive biases over the Sahara, Arabian Peninsula, and the Arctic.
Model Agreement
There is excellent agreement between IFS-FESOM and IFS-NEMO, as expected from their common atmospheric physics. However, there is very poor agreement between the IFS models and ICON, highlighting substantial differences in their clear-sky radiative transfer schemes, thermodynamic profiles, or boundary conditions.
Physical Interpretation
Clear-sky surface net longwave radiation is governed by surface temperature (driving upward emission) and the atmospheric temperature/humidity profile (driving downward emission). ICON's widespread negative bias over oceans suggests an underestimation of downwelling longwave radiation (potentially due to a drier lower troposphere) or overly warm SSTs. Conversely, ICON's strong positive bias over the Sahara implies a weaker net upward flux, which could result from simulated surface temperatures being too cold (e.g., due to different albedo or dust aerosol forcing) or the atmosphere being overly moist compared to ERA5.
Caveats
- Clear-sky radiative fluxes are sensitive to how 'clear-sky' conditions are sampled and defined in both the models and the ERA5 reanalysis.
- ERA5 is used as the observational reference, but its clear-sky radiative fluxes are model-derived products and carry their own uncertainties, particularly over deserts and high altitudes.
Surface Net Shortwave Radiation Annual Mean Bias
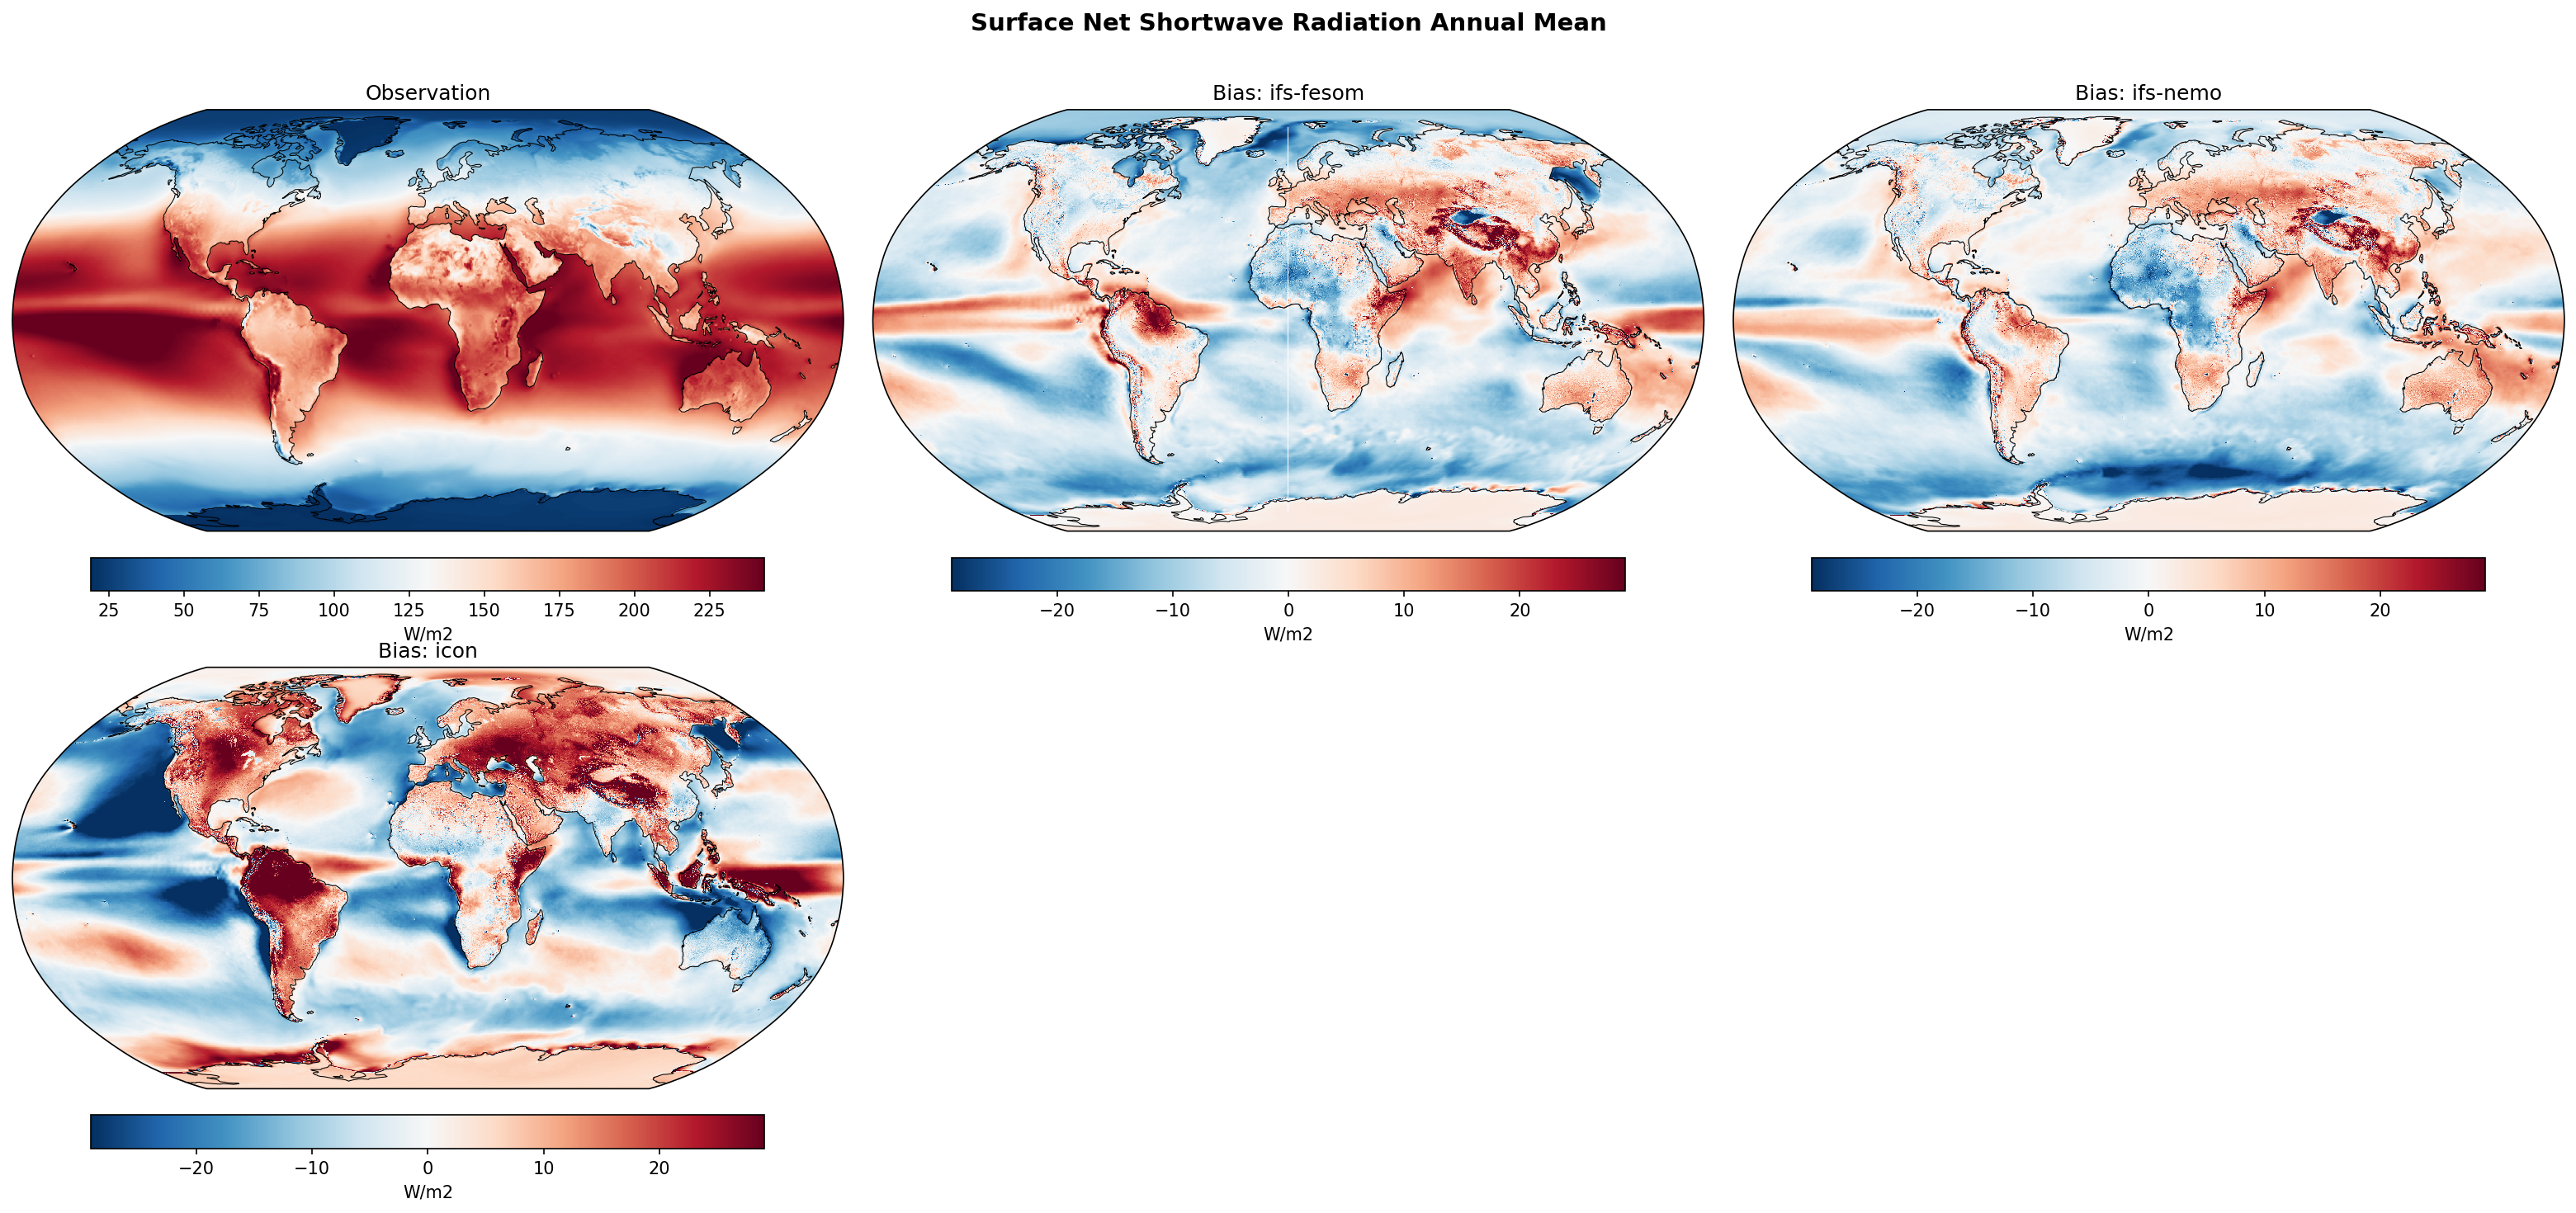
| Variables | avg_snswrf |
|---|---|
| Models | ifs-fesom, ifs-nemo, icon |
| Reference Dataset | ERA5 |
| Units | W/m2 |
| Period | 1990–2014 |
| ifs-fesom | Global Mean Bias: -1.43 · Rmse: 9.59 |
| ifs-nemo | Global Mean Bias: -1.61 · Rmse: 9.18 |
| icon | Global Mean Bias: -0.94 · Rmse: 15.53 |
Summary high
Annual mean bias maps of surface net shortwave radiation relative to ERA5 show that all three models have slight negative global mean biases, but ICON exhibits much larger regional compensating errors compared to the IFS-based models.
Key Findings
- ICON displays the highest spatial RMSE (15.4 W/m2) due to severe compensating errors: strong positive biases over landmasses and intense negative biases over oceans.
- IFS-FESOM and IFS-NEMO share highly similar bias patterns and lower RMSEs (~9.0-9.4 W/m2), reflecting the dominant role of their shared atmospheric component in radiation fields.
- All models exhibit persistent negative biases over the Southern Ocean and mid-latitude storm tracks, alongside positive biases over the Himalayas and Tibetan Plateau.
Spatial Patterns
IFS-FESOM and IFS-NEMO feature moderate negative biases (10-20 W/m2) over the Southern Ocean, North Atlantic, and North Pacific, with positive biases concentrated over the Tibetan Plateau, South America, and central Africa. They also show a distinct narrow band of positive bias along the equatorial Pacific. ICON displays a drastically amplified spatial variance: severe positive biases (>20 W/m2) dominate almost all continental landmasses (North America, Eurasia, Africa, South America), while intense negative biases dominate the equatorial Pacific (ITCZ), Southern Ocean, and Northern Hemisphere ocean basins.
Model Agreement
There is excellent inter-model agreement between IFS-FESOM and IFS-NEMO, driven by their identical atmospheric physics, resulting in the best spatial performance (lowest RMSE). ICON strongly diverges from the IFS models, showing much larger spatial variance. Despite ICON's high RMSE, its global mean bias (-1.21 W/m2) is lower in magnitude than the IFS models (-1.70 to -1.88 W/m2), purely due to the spatial cancellation of its large land (positive) and ocean (negative) biases. All models agree on the general negative bias over the Southern Ocean and positive bias over high Asian topography.
Physical Interpretation
Surface shortwave radiation biases are primarily driven by cloud radiative effects and surface albedo representation. Negative biases over the Southern Ocean and mid-latitude storm tracks suggest the models simulate overly extensive or overly optically thick clouds (a common issue related to supercooled liquid water phase partitioning). Positive biases over landmasses, especially prominent in ICON, indicate an underrepresentation of continental cloud cover (likely insufficient convective triggering) or overly dark surface albedo. Positive biases over the Himalayas likely point to issues with snow cover albedo parametrization. ICON's deep negative bias in the equatorial Pacific suggests an overly active ITCZ generating excessive cloud shading.
Caveats
- ERA5 surface radiation is a model-derived reanalysis product, not a direct satellite measurement like CERES, meaning the 'observation' contains its own inherent model biases.
- Annual mean diagnostics mask seasonal compensating errors; a region could have too much shortwave in summer and too little in winter, appearing neutral in the annual mean.
Surface Net Shortwave Radiation DJF Bias
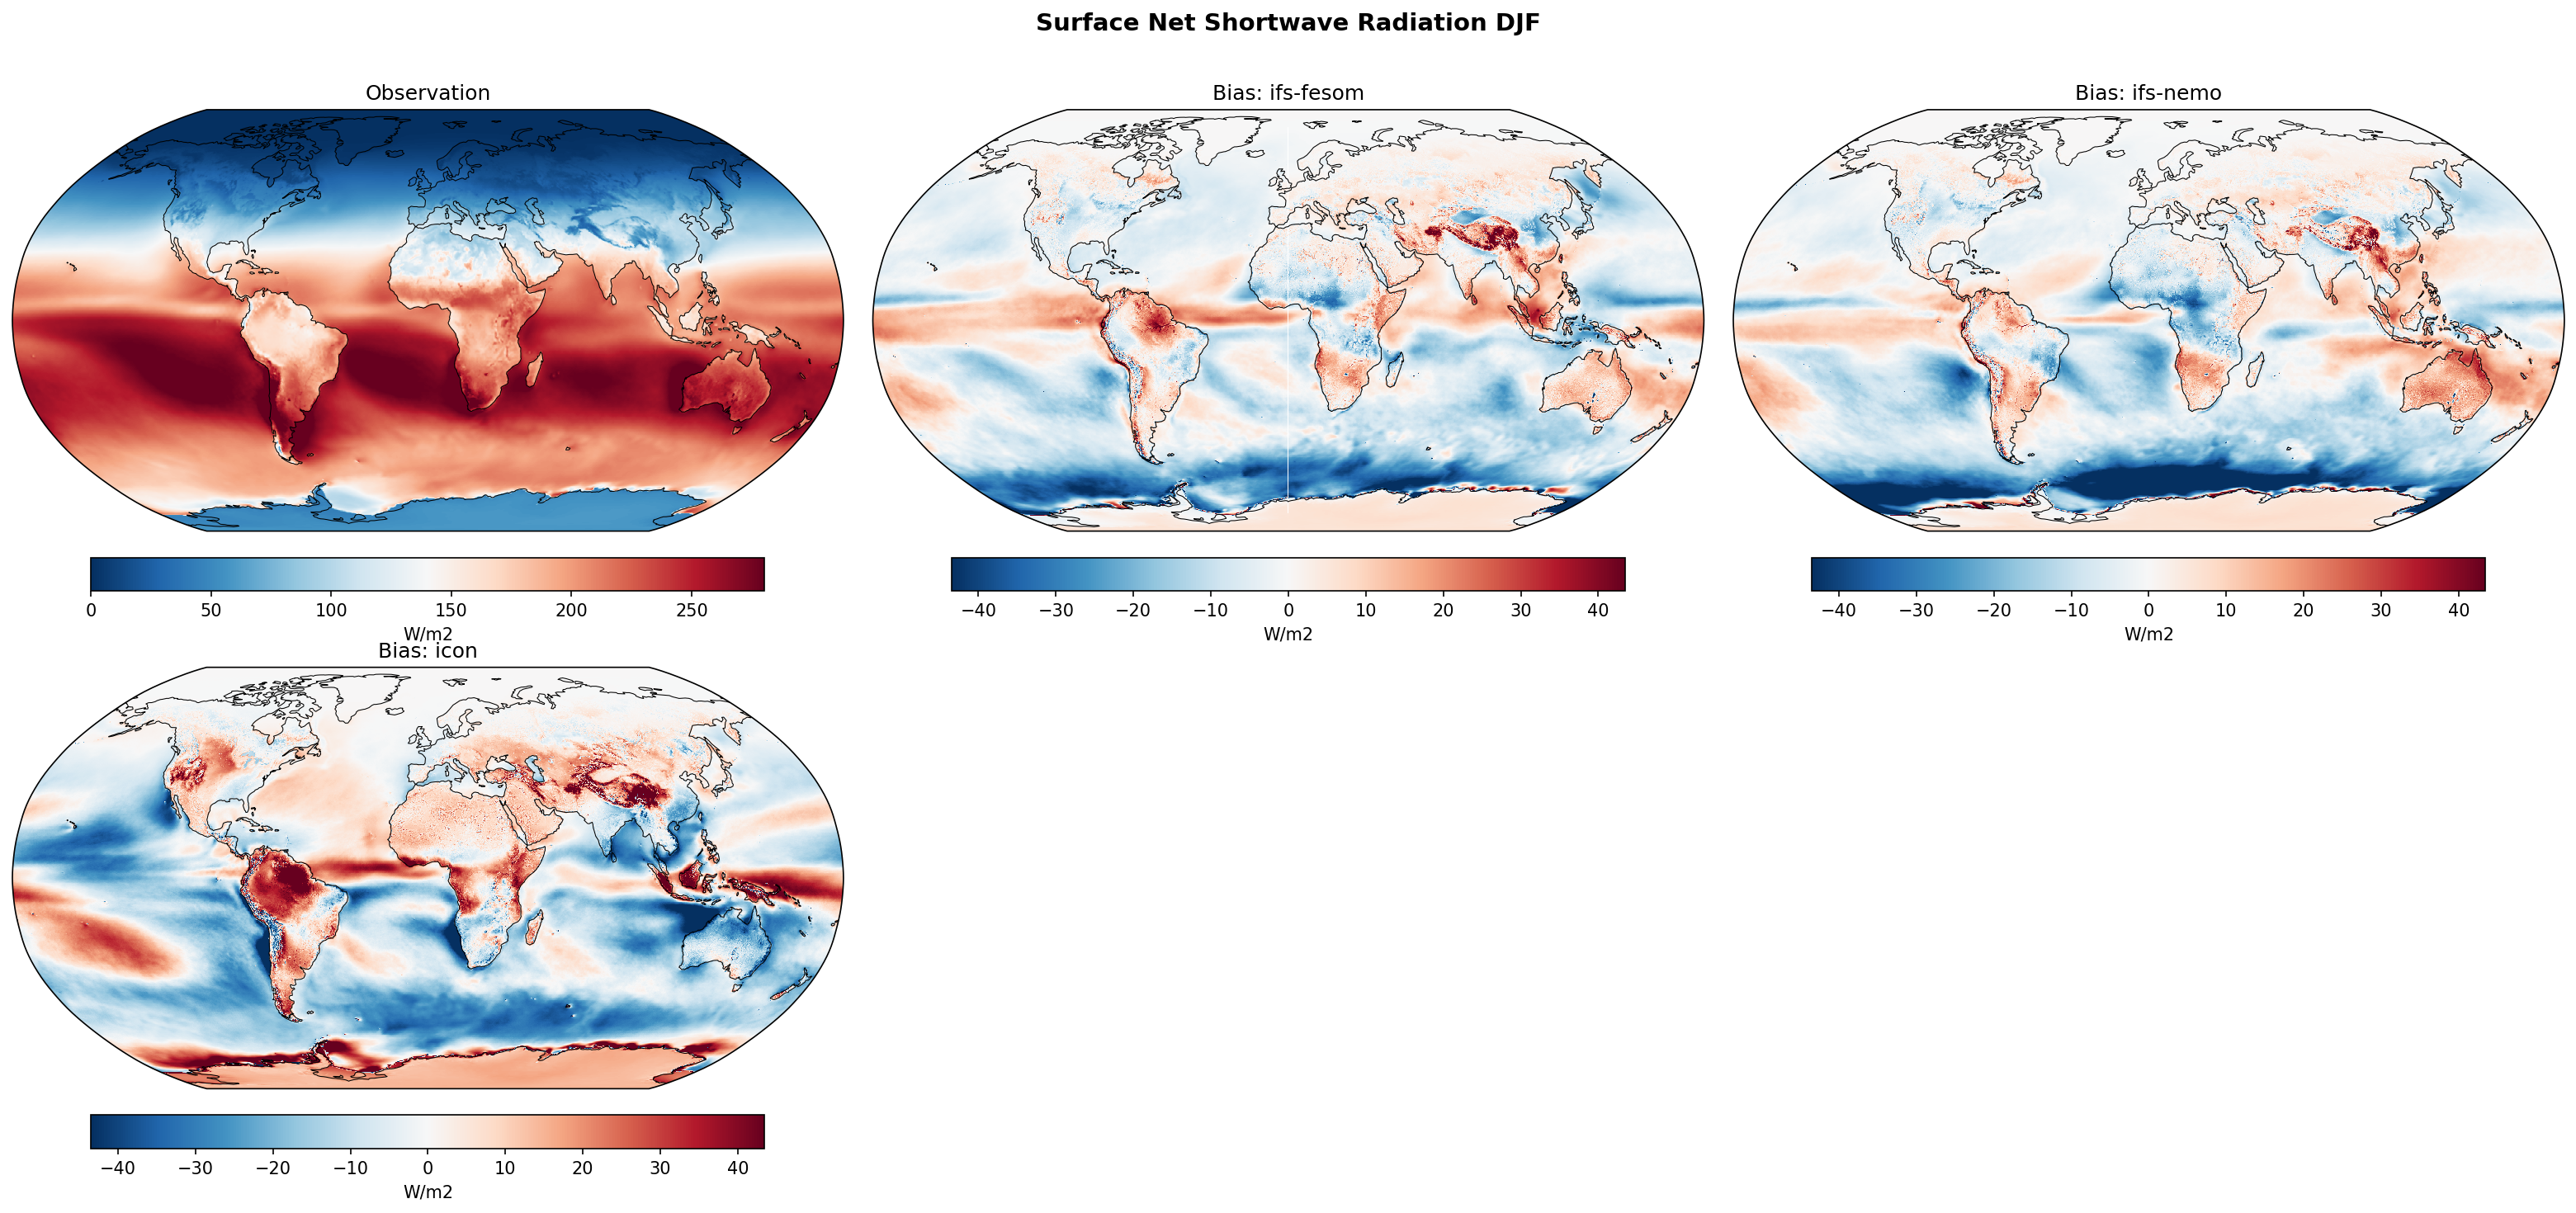
| Variables | avg_snswrf |
|---|---|
| Models | ifs-fesom, ifs-nemo, icon |
| Reference Dataset | ERA5 |
| Units | W/m2 |
| Period | 1990–2014 |
Summary high
The figure displays the DJF climatology of surface net shortwave radiation from ERA5 and the corresponding spatial bias maps for three high-resolution climate models (IFS-FESOM, IFS-NEMO, and ICON).
Key Findings
- All models exhibit strong positive biases over tropical landmasses, particularly the Amazon and Congo basins.
- A pronounced negative bias ring is present over the Southern Ocean in all models, contrasting with positive biases near the Antarctic coast.
- IFS-FESOM and IFS-NEMO share highly similar bias patterns, whereas ICON shows larger bias magnitudes in both tropical land regions and the Southern Ocean.
Spatial Patterns
Large positive biases (>40 W/m2) are prominent over tropical convective land regions (South America, Africa, Maritime Continent) and the Himalayas/Tibetan Plateau. Strong negative biases (<-40 W/m2) dominate the Southern Ocean between 45°S and 65°S. Over the tropical oceans, models show mixed patterns, with ICON displaying broader negative biases in the equatorial Pacific and Indian Oceans compared to the IFS-based models.
Model Agreement
There is high agreement between IFS-FESOM and IFS-NEMO, reflecting their shared atmospheric component. While ICON agrees with the IFS models on the general location of major biases (e.g., positive over Amazon/Himalayas, negative over Southern Ocean), it diverges by exhibiting significantly stronger magnitudes, particularly exacerbating the negative bias over the Southern and Pacific oceans and the positive bias over tropical land.
Physical Interpretation
Positive biases over tropical land during the DJF season suggest an underestimation of deep convective cloud fraction or cloud optical thickness, leading to excessive solar radiation reaching the surface. Over the Himalayas, the strong positive bias is likely driven by underestimated snow cover or surface albedo inaccuracies over complex terrain. The negative biases over the Southern Ocean indicate that the models either simulate too much cloud cover or clouds that are too optically thick (possibly related to supercooled liquid water representations) compared to ERA5.
Caveats
- ERA5 is a reanalysis and has known uncertainties in surface radiation fluxes; biases relative to ERA5 may partly reflect reanalysis errors rather than pure model deficiencies (e.g., over the Southern Ocean).
- Net surface shortwave radiation conflates atmospheric transmission (clouds/aerosols) and surface reflection (albedo/snow/ice), making definitive physical attribution difficult without separating the downward and upward flux components.
Surface Net Shortwave Radiation JJA Bias
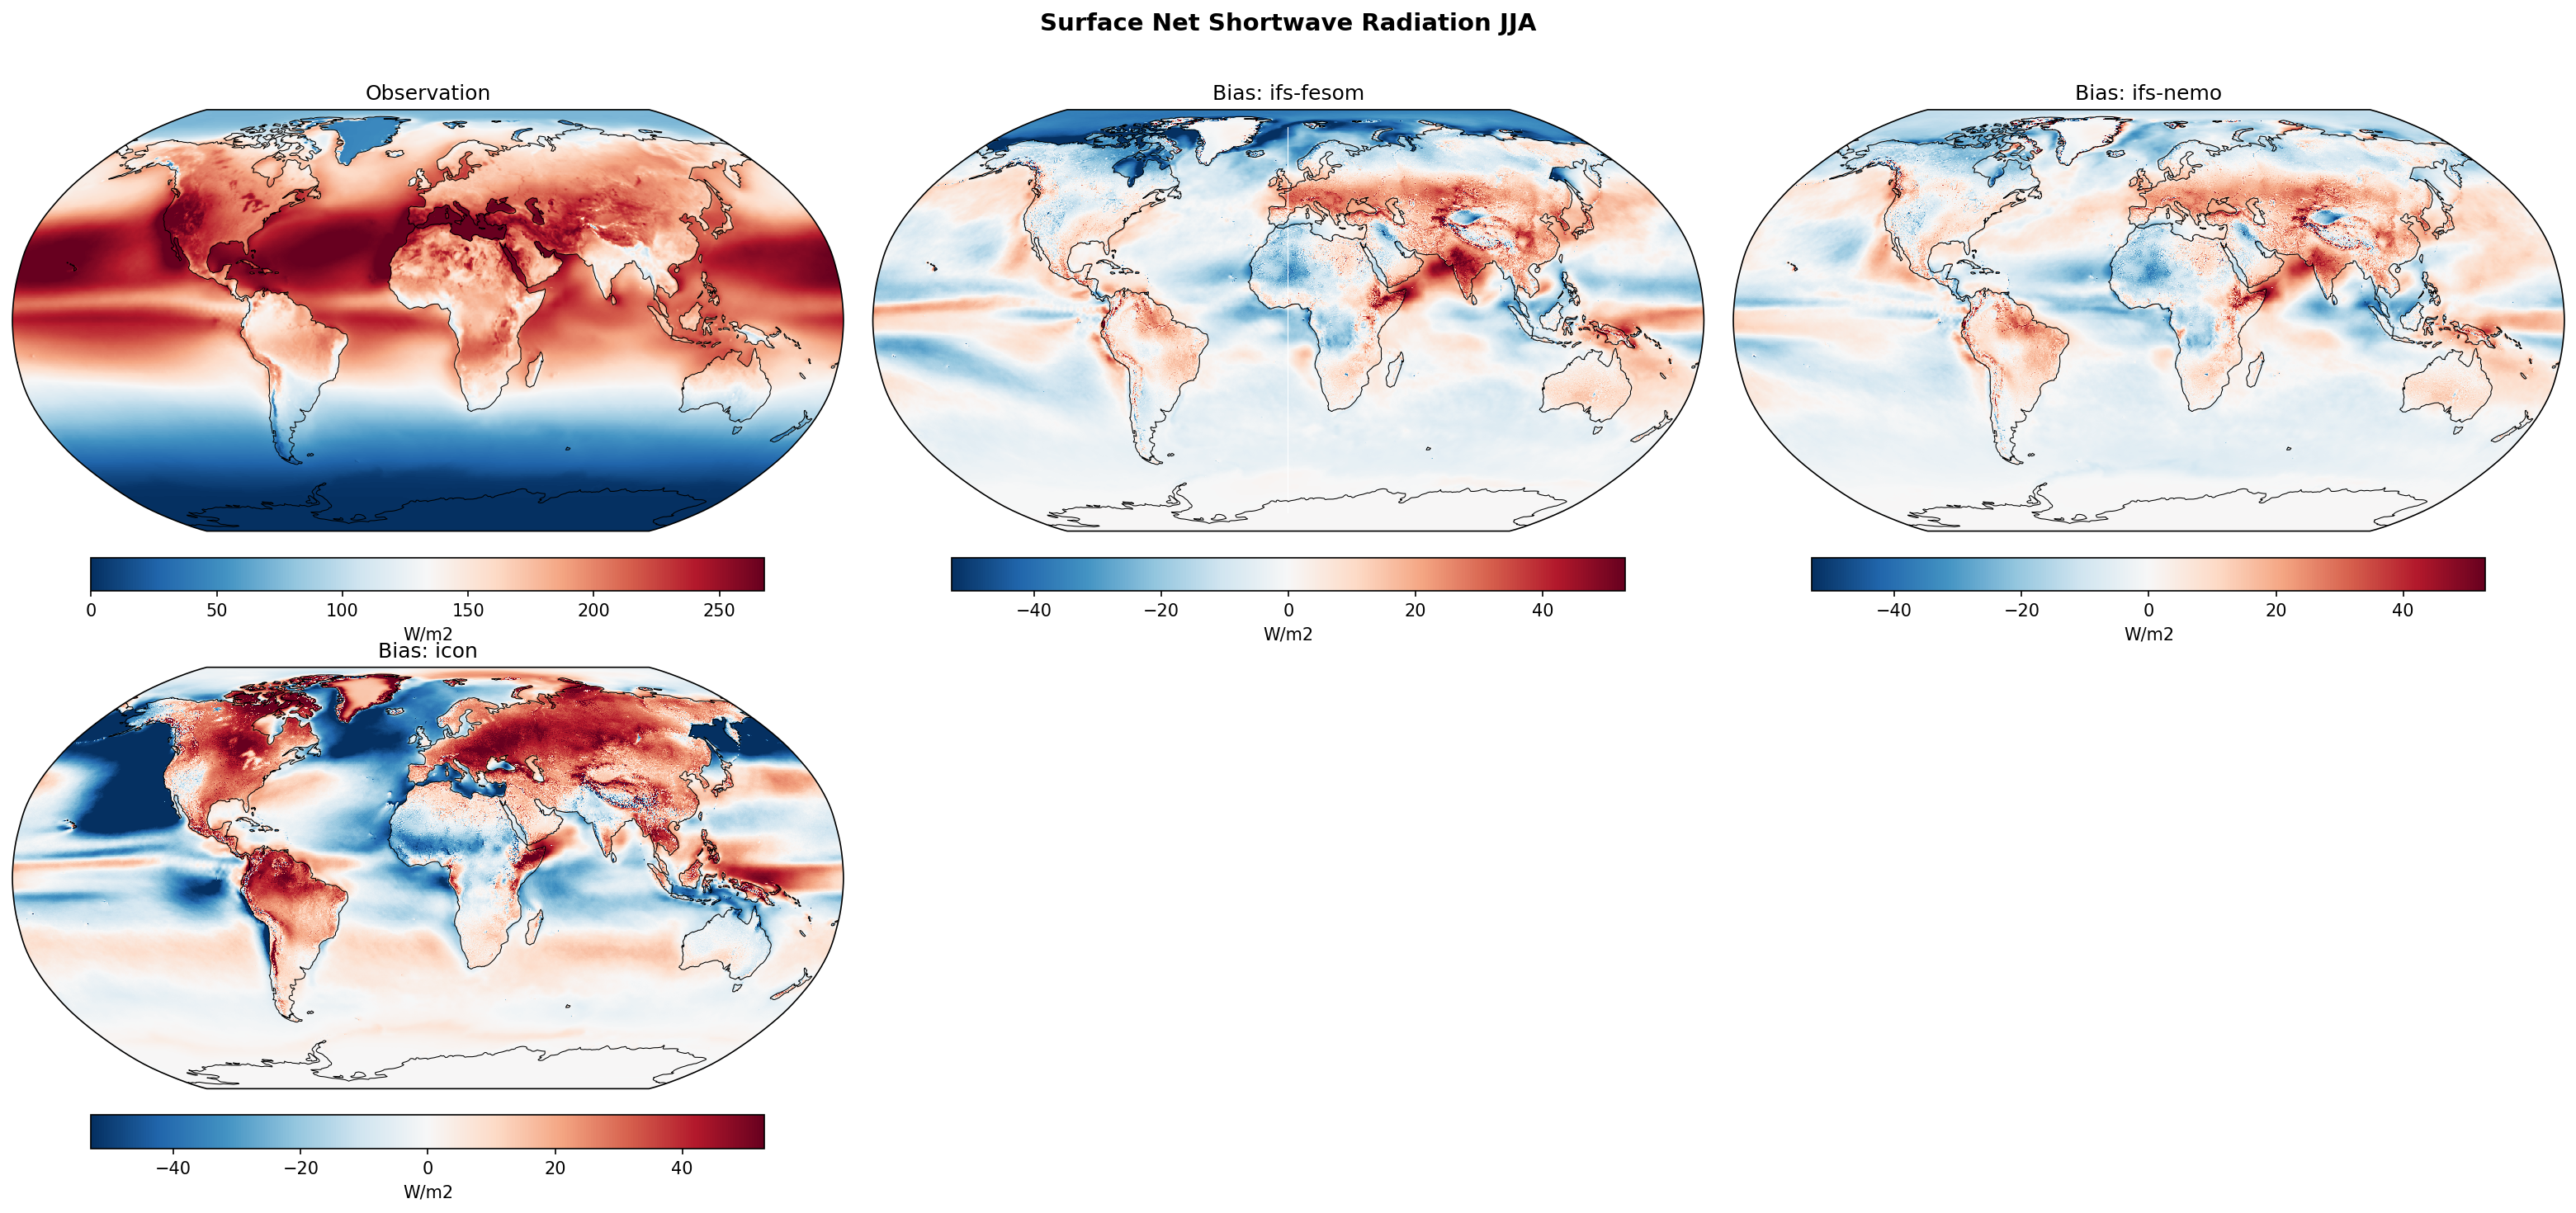
| Variables | avg_snswrf |
|---|---|
| Models | ifs-fesom, ifs-nemo, icon |
| Reference Dataset | ERA5 |
| Units | W/m2 |
| Period | 1990–2014 |
Summary high
The figure presents spatial bias maps of June-July-August (JJA) climatological surface net shortwave radiation for three high-resolution models (IFS-FESOM, IFS-NEMO, ICON) compared to ERA5 reanalysis.
Key Findings
- IFS-FESOM and IFS-NEMO exhibit highly similar bias spatial patterns, indicating that the atmospheric component (IFS) dominates the surface radiation errors rather than the ocean coupling.
- ICON displays substantially larger bias magnitudes globally compared to the IFS-based models, with pronounced extreme positive biases over Northern Hemisphere landmasses and extreme negative biases over Northern Hemisphere mid-latitude oceans.
- All three models show positive biases in the eastern subtropical Pacific and Atlantic oceans, consistent with a widespread underestimation of marine stratocumulus cloud cover in global climate models.
Spatial Patterns
During JJA, all models generally exhibit positive biases (excessive net shortwave radiation) over Northern Hemisphere landmasses, particularly Eurasia and North America, with ICON's biases exceeding 40 W/m2 in these regions. Positive biases are also prevalent in the eastern subtropical ocean basins (stratocumulus decks off the coasts of California, Peru, and Namibia) and the Indian Ocean. Conversely, negative biases (insufficient net shortwave radiation) are concentrated over the North Pacific and North Atlantic oceans, the Arctic Ocean, and portions of the Intertropical Convergence Zone (ITCZ). ICON shows particularly severe negative biases over the Northern Hemisphere storm tracks.
Model Agreement
There is excellent agreement in the bias spatial structure between IFS-FESOM and IFS-NEMO, underscoring the dominant role of the atmospheric model formulation. However, ICON diverges significantly from the IFS models, showing much higher amplitude biases and distinct spatial structures, particularly over the North Atlantic, North Pacific, and major landmasses.
Physical Interpretation
Biases in surface net shortwave radiation are primarily driven by errors in simulated cloud cover and cloud optical properties. The widespread positive biases over Northern Hemisphere land in summer, especially in ICON, likely stem from underestimated convective cloud cover or an overly dry land surface limiting cloud formation. The positive biases in the eastern ocean basins reflect the classic model deficiency in adequately resolving boundary layer marine stratocumulus clouds. The negative biases over the North Pacific and Atlantic suggest an overestimation of cloud fraction or excessive cloud optical thickness in these maritime regions during summer.
Caveats
- ERA5 is a reanalysis product; while it provides high-resolution, temporally consistent fields, its surface radiation fields are model-derived and may contain their own biases compared to direct satellite observations like CERES.
- The evaluation focuses only on the JJA season; biases in cloud regimes and radiation are highly seasonally dependent, and performance may differ substantially in DJF.
Surface Net Shortwave Radiation (Clear-Sky) Annual Mean Bias
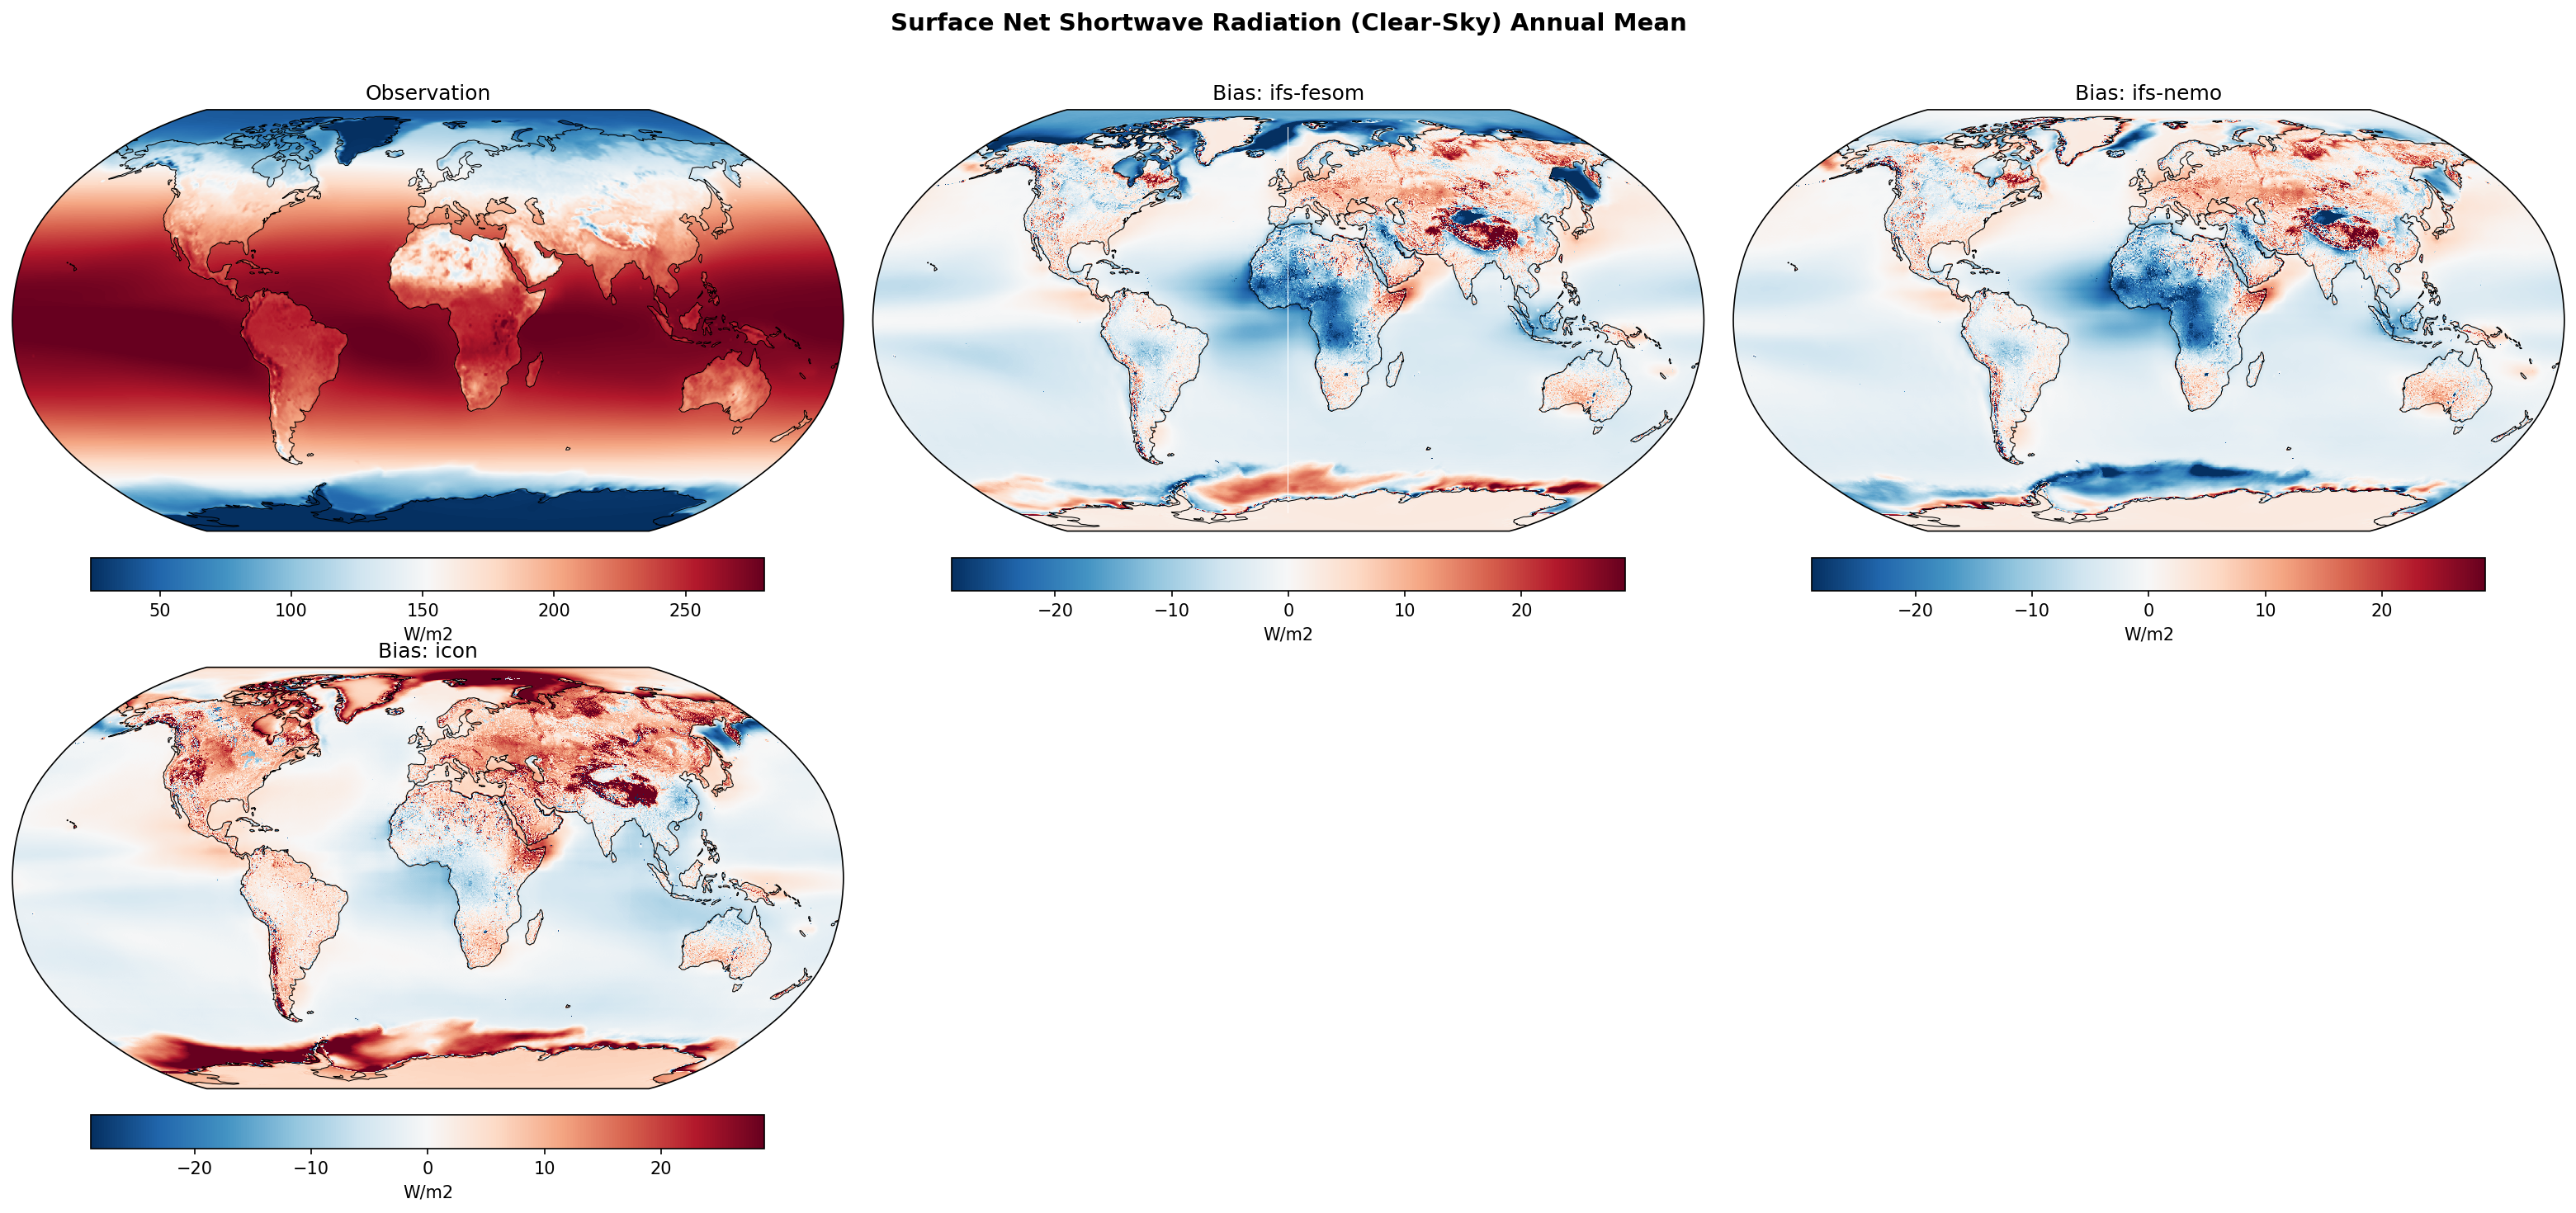
| Variables | avg_snswrfcs |
|---|---|
| Models | ifs-fesom, ifs-nemo, icon |
| Reference Dataset | ERA5 |
| Units | W/m2 |
| Period | 1990–2014 |
| ifs-fesom | Global Mean Bias: -2.33 · Rmse: 8.57 |
| ifs-nemo | Global Mean Bias: -1.96 · Rmse: 7.89 |
| icon | Global Mean Bias: 1.98 · Rmse: 9.57 |
Summary high
Annual mean biases in clear-sky surface net shortwave radiation reveal distinct regional patterns across the models, strongly differentiating the IFS-based systems from ICON.
Key Findings
- IFS-FESOM and IFS-NEMO share a similar spatial bias pattern, dominated by strong negative anomalies over North Africa, the Middle East, and tropical oceans.
- ICON exhibits a contrasting pattern with widespread positive biases over Northern Hemisphere landmasses and high-latitude regions.
- Global mean biases are negative for the IFS models (~-2.5 W/m2) and positive for ICON (+1.7 W/m2), though all models exhibit comparable RMSEs of 7.8-9.3 W/m2.
Spatial Patterns
The IFS models show pronounced negative biases (-10 to -20 W/m2) over major desert regions (Sahara, Arabian Peninsula) and the equatorial oceans (Pacific and Atlantic ITCZ regions). In contrast, ICON features strong positive biases (>15 W/m2) across much of Eurasia, North America, the Tibetan Plateau, and the margins of Antarctica.
Model Agreement
IFS-FESOM and IFS-NEMO display high structural agreement, reflecting their shared atmospheric component. ICON diverges significantly, particularly over mid-to-high latitude land areas where it shows positive biases opposite to the IFS models.
Physical Interpretation
Clear-sky surface net shortwave radiation is primarily controlled by atmospheric attenuation (aerosols and water vapor) and surface albedo. The strong negative biases in the IFS models over dust source regions (Sahara) likely indicate excessive aerosol optical depth or overestimated surface albedo. High-latitude positive biases, particularly prominent in ICON around Antarctica, often stem from differences in sea-ice/snow surface albedo parametrization compared to the ERA5 reference.
Caveats
- The ERA5 reference for clear-sky fluxes is a model-derived product reliant on its own aerosol climatologies and radiative transfer assumptions, carrying inherent uncertainties.
- Differences in whether models use prognostic or prescribed aerosol climatologies strongly impact clear-sky radiation and complicate direct inter-model comparisons.
Surface Net Shortwave Radiation (Clear-Sky) DJF Bias
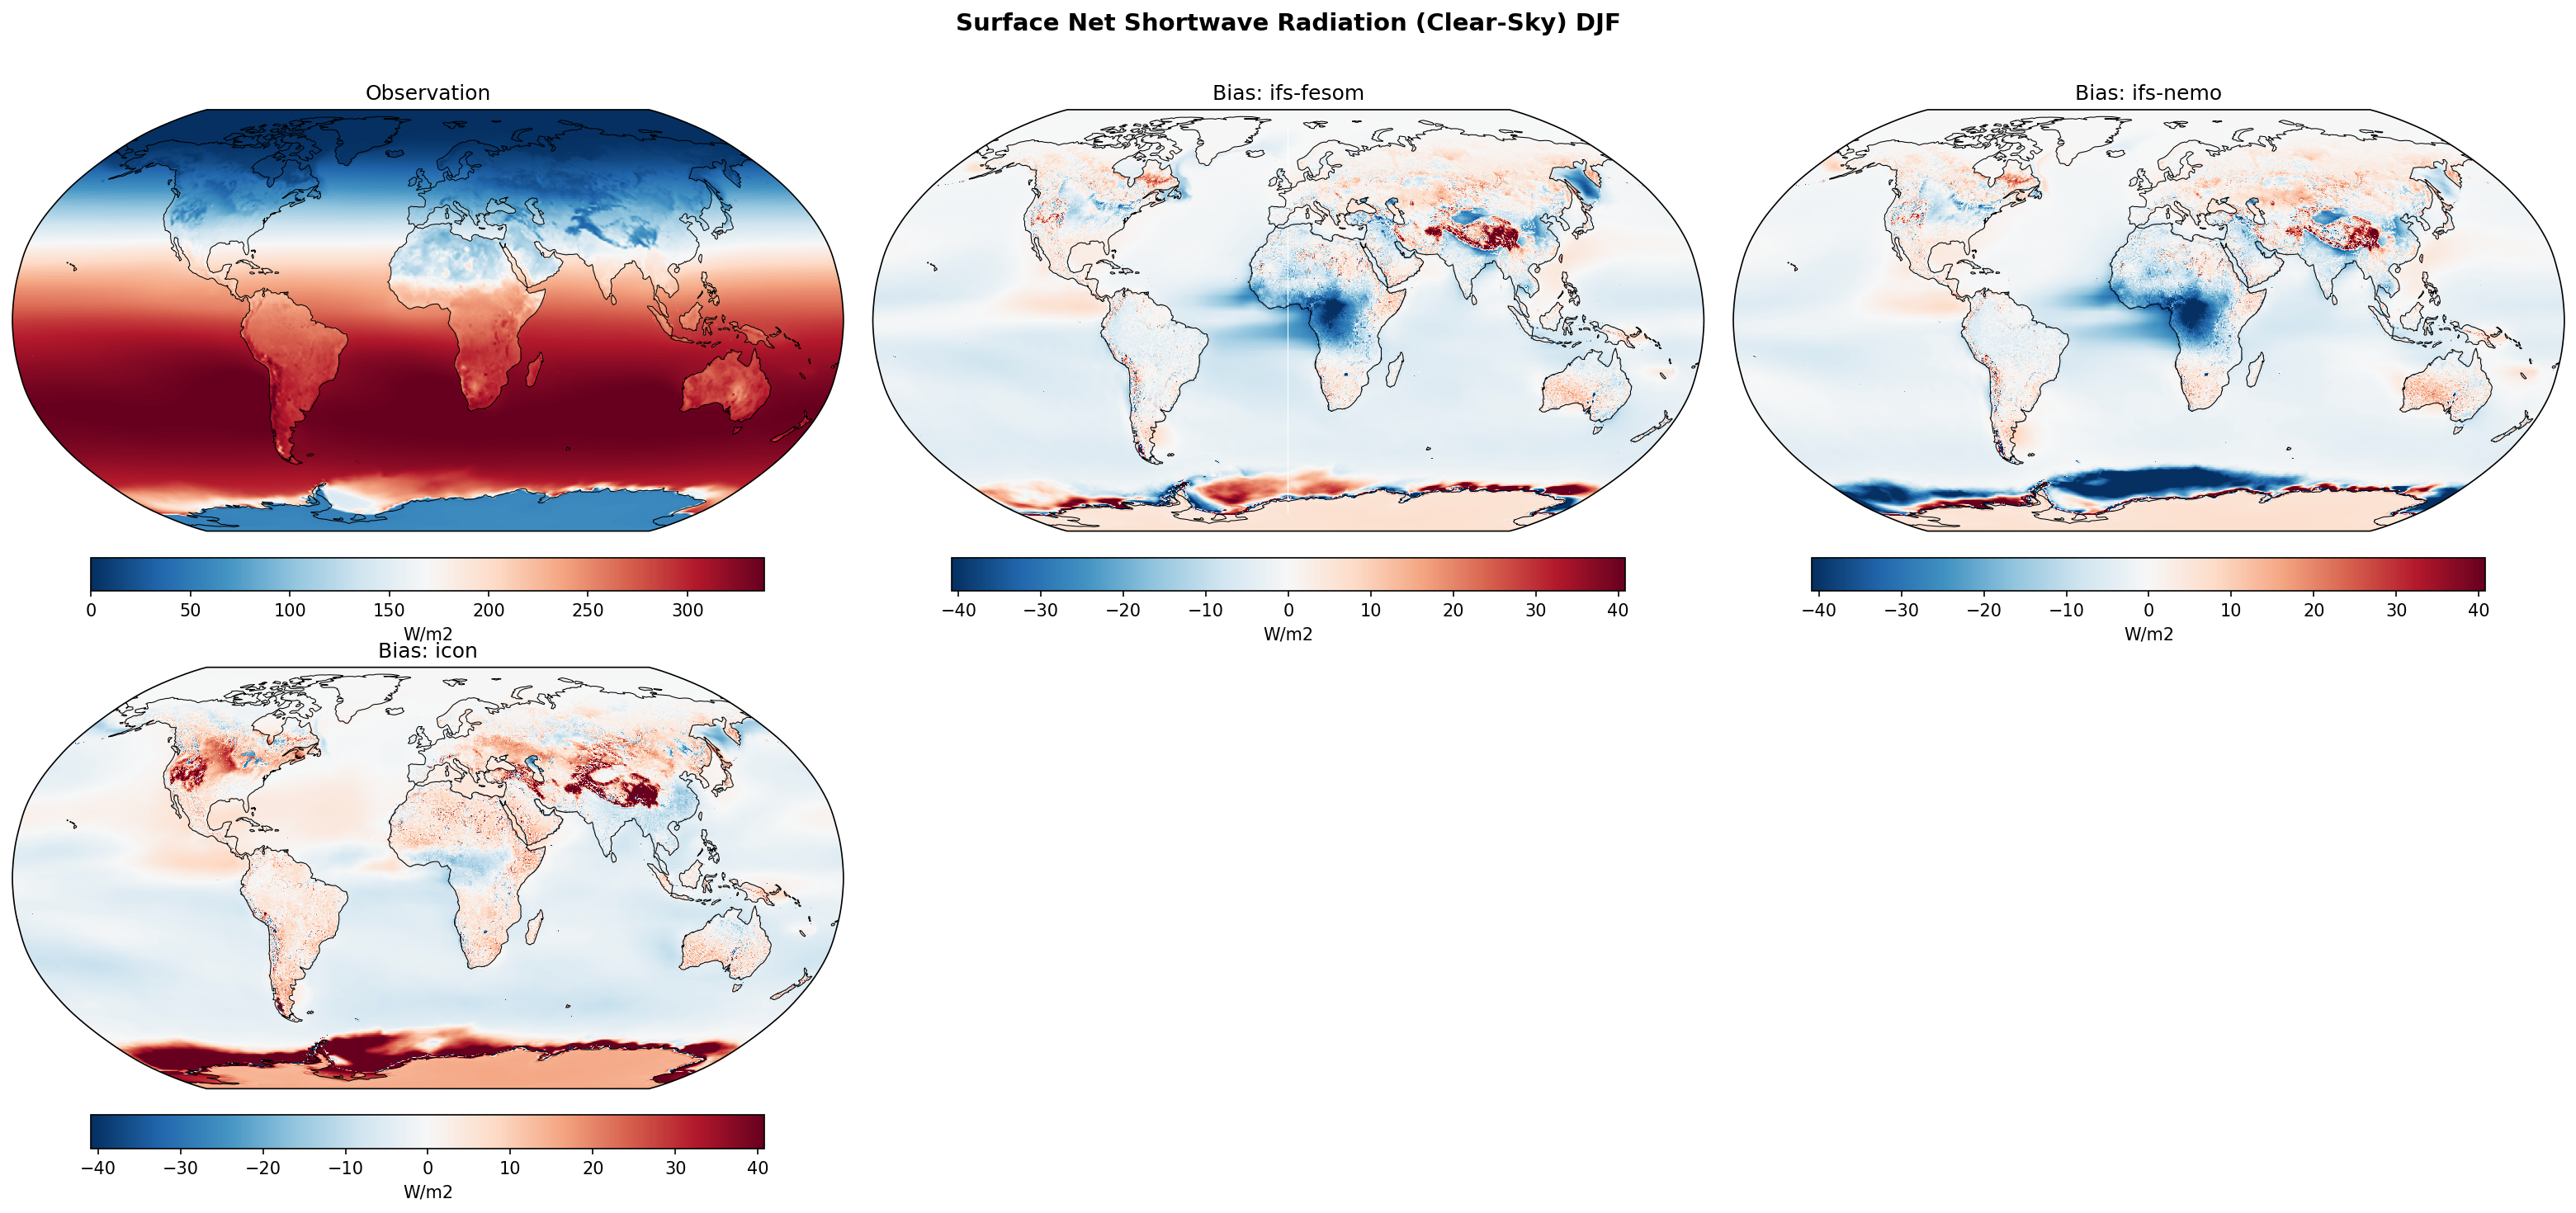
| Variables | avg_snswrfcs |
|---|---|
| Models | ifs-fesom, ifs-nemo, icon |
| Reference Dataset | ERA5 |
| Units | W/m2 |
| Period | 1990–2014 |
Summary high
Global bias maps of DJF clear-sky surface net shortwave radiation for IFS-FESOM, IFS-NEMO, and ICON high-resolution models compared to ERA5 climatology.
Key Findings
- All models exhibit strong positive biases (excessive net shortwave) over the Himalayas and Tibetan Plateau.
- IFS-FESOM and IFS-NEMO show pronounced negative biases over equatorial Africa (Congo basin), which are less severe or absent in ICON.
- Significant inter-model divergence occurs over Antarctica and the Southern Ocean sea ice margins, with IFS-NEMO showing negative biases and IFS-FESOM and ICON showing positive biases.
Spatial Patterns
Biases are predominantly concentrated over land and sea-ice regions. Positive biases are widespread over Northern Hemisphere snow-covered regions (parts of North America and Asia) and the Himalayas. Negative biases are localized over specific tropical landmasses (e.g., Central Africa). Over the Southern Ocean and Antarctica, which receive peak solar insolation during DJF, the spatial pattern of biases strongly varies by model.
Model Agreement
The models agree on the general magnitude of near-zero biases over the open ocean and the positive bias over the Himalayas. IFS-FESOM and IFS-NEMO share similar bias patterns in the tropics and mid-latitudes due to their common atmospheric component, but diverge substantially over Antarctic sea ice. ICON displays unique patterns over tropical land (e.g., northern South America).
Physical Interpretation
Because these are clear-sky fluxes, biases are primarily driven by differences in surface albedo and, secondarily, atmospheric attenuation (aerosols and water vapor). Positive biases over the Himalayas, NH landmasses, and Antarctica (in ICON/IFS-FESOM) indicate the models' surface albedo is too low (e.g., insufficient snow/ice cover or darker snow) compared to ERA5. Conversely, negative biases in IFS-NEMO around Antarctica suggest overestimated sea-ice extent or albedo.
Caveats
- ERA5 clear-sky fluxes are derived from the ECMWF forecast model and depend on its assumed aerosol climatology and surface albedo, meaning they are not pure observations.
- Clear-sky radiation diagnostics do not reflect the actual surface energy budget, which is heavily modulated by cloud cover.
Surface Net Shortwave Radiation (Clear-Sky) JJA Bias
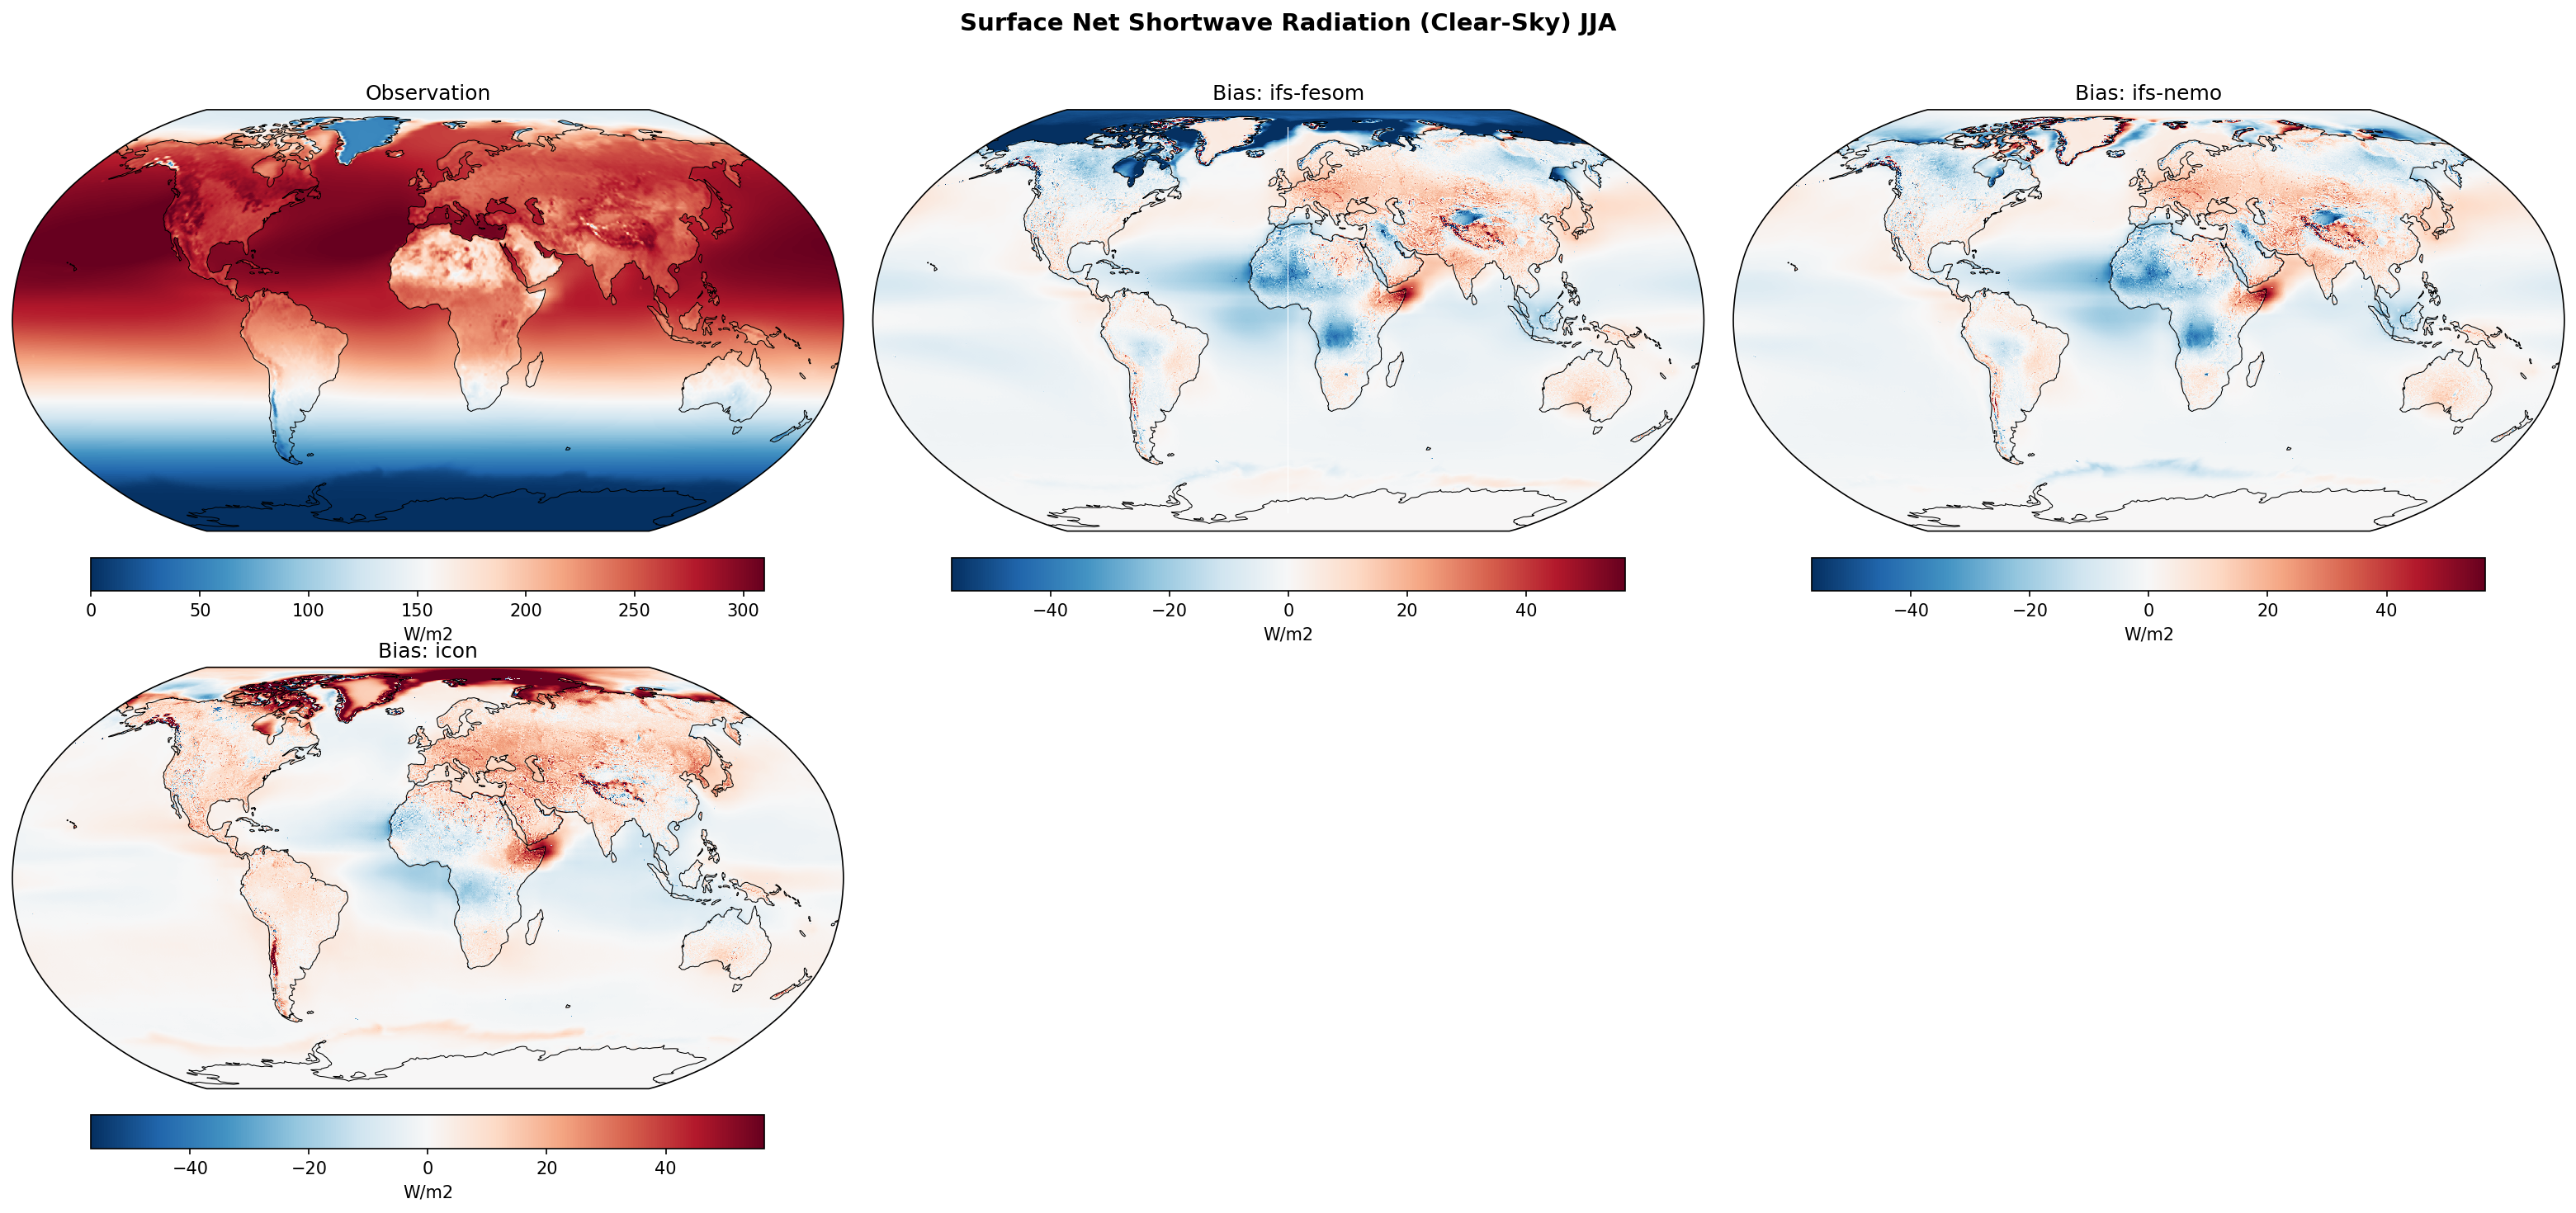
| Variables | avg_snswrfcs |
|---|---|
| Models | ifs-fesom, ifs-nemo, icon |
| Reference Dataset | ERA5 |
| Units | W/m2 |
| Period | 1990–2014 |
Summary high
Comparison of JJA clear-sky surface net shortwave radiation climatologies reveals systematic biases common across all three high-resolution models, predominantly characterized by positive biases over Northern Hemisphere landmasses and negative biases over the Arctic Ocean and Sahara.
Key Findings
- All three models exhibit widespread positive biases (+10 to +30 W/m2) over Northern Hemisphere landmasses, including North America, Europe, and Asia.
- Strong negative biases (-20 to -40 W/m2) are present over the Arctic Ocean in all models, suggesting higher sea-ice albedo or differing aerosol scattering compared to ERA5.
- Localized intense positive biases occur around the Horn of Africa and Arabian Peninsula, while the Sahara and Sahel display broad negative biases.
- IFS-FESOM and IFS-NEMO show nearly identical bias patterns, reflecting their shared atmospheric component, while ICON exhibits slightly stronger positive biases over high-latitude land areas like Greenland.
Spatial Patterns
During the boreal summer (JJA), positive biases dominate the mid-latitude Northern Hemisphere land areas (North America, Eurasia) and the Tibetan Plateau. Negative biases are concentrated in the high Arctic, over the Sahara Desert, and along the equatorial oceanic ITCZ belt. Small-scale noise in mountain ranges (e.g., Himalayas, Andes) highlights topographic and snow-albedo differences at high resolution.
Model Agreement
Inter-model agreement is exceptionally high regarding the spatial distribution and sign of the biases. IFS-FESOM and IFS-NEMO are nearly indistinguishable, as expected from their shared IFS atmosphere. ICON shares the same broad regional biases but shows slightly more pronounced positive biases over the Arctic land boundaries and Greenland.
Physical Interpretation
Since these are clear-sky fluxes, clouds are excluded. The biases are therefore driven primarily by surface albedo and atmospheric composition (aerosols and water vapor). Positive biases over NH landmasses likely result from lower surface albedo or lower aerosol optical depths (e.g., missing anthropogenic or fire aerosols) in the models compared to ERA5. Negative biases in the Arctic and Sahara point to overestimated surface albedos (sea ice/snow and desert sand, respectively) or excessive aerosol scattering (e.g., dust over North Africa).
Caveats
- ERA5 clear-sky radiation is a model-derived diagnostic dependent on assimilated aerosols and surface properties; differences may partly reflect ERA5's own assumptions rather than pure observational truth.
- Clear-sky radiation does not reflect the total energy balance, as cloud-radiative effects (which typically dominate shortwave biases) are removed.
Total Cloud Cover Annual Mean Bias
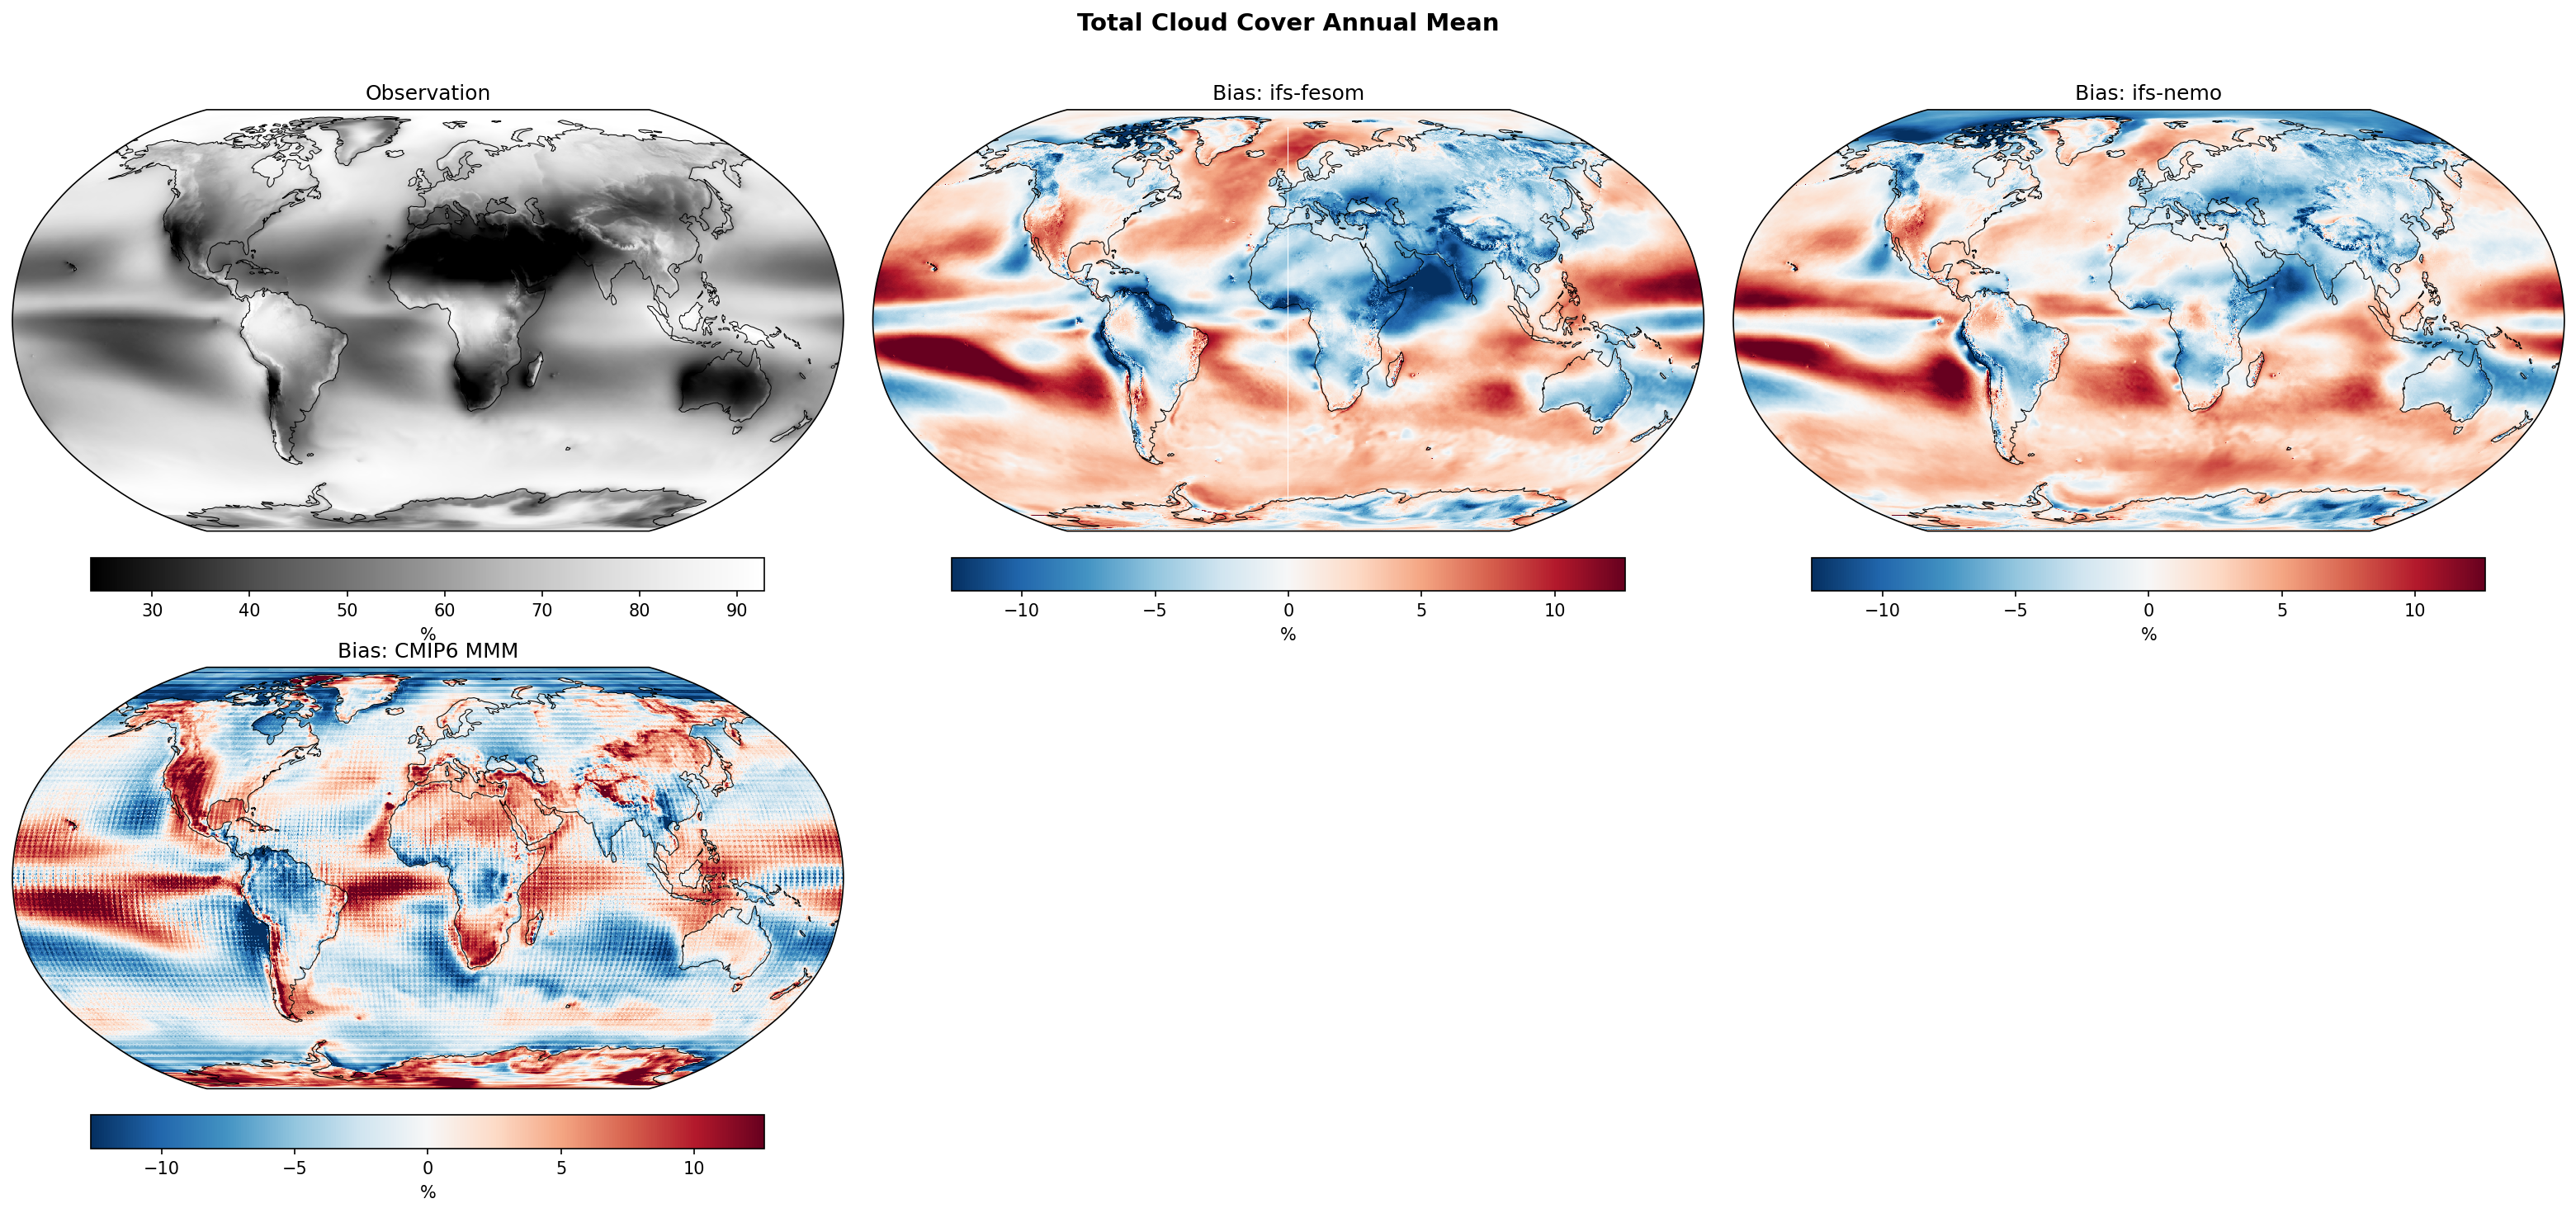
| Variables | avg_tcc |
|---|---|
| Models | ifs-fesom, ifs-nemo, CMIP6 MMM, MPI-ESM1-2-LR/r1i1p1f1, GISS-E2-1-G/r1i1p1f2, IPSL-CM6A-LR/r1i1p1f1, ACCESS-ESM1-5/r1i1p1f1, EC-Earth3/r1i1p1f1, CNRM-CM6-1/r1i1p1f2, AWI-CM-1-1-MR/r1i1p1f1, CNRM-ESM2-1/r1i1p1f2, FGOALS-g3/r1i1p1f1, INM-CM5-0/r1i1p1f1, MRI-ESM2-0/r1i1p1f1 |
| Reference Dataset | ERA5 |
| Units | % |
| Period | 1990–2014 |
| ifs-fesom | Global Mean Bias: 0.49 · Rmse: 5.19 |
| ifs-nemo | Global Mean Bias: 0.86 · Rmse: 4.58 |
| CMIP6 MMM | Global Mean Bias: -0.16 · Rmse: 5.34 |
| MPI-ESM1-2-LR/r1i1p1f1 | Global Mean Bias: -0.27 · Rmse: 7.06 |
| GISS-E2-1-G/r1i1p1f2 | Global Mean Bias: -2.99 · Rmse: 11.45 |
| IPSL-CM6A-LR/r1i1p1f1 | Global Mean Bias: -1.28 · Rmse: 10.50 |
| ACCESS-ESM1-5/r1i1p1f1 | Global Mean Bias: 2.18 · Rmse: 8.51 |
| EC-Earth3/r1i1p1f1 | Global Mean Bias: 1.19 · Rmse: 5.44 |
| CNRM-CM6-1/r1i1p1f2 | Global Mean Bias: 0.82 · Rmse: 9.48 |
| AWI-CM-1-1-MR/r1i1p1f1 | Global Mean Bias: -3.08 · Rmse: 7.12 |
| CNRM-ESM2-1/r1i1p1f2 | Global Mean Bias: 0.80 · Rmse: 9.66 |
| FGOALS-g3/r1i1p1f1 | Global Mean Bias: -9.41 · Rmse: 15.06 |
| INM-CM5-0/r1i1p1f1 | Global Mean Bias: 6.98 · Rmse: 11.71 |
| MRI-ESM2-0/r1i1p1f1 | Global Mean Bias: -0.98 · Rmse: 7.55 |
Summary high
The figure presents annual mean total cloud cover biases for high-resolution IFS-FESOM and IFS-NEMO models, alongside the CMIP6 multi-model mean, evaluated against ERA5 reanalysis.
Key Findings
- Both IFS-FESOM and IFS-NEMO exhibit similar spatial bias patterns, characterized by positive biases in subtropical ocean regions and negative biases over Northern Hemisphere landmasses.
- All evaluated models, including the CMIP6 MMM, persistently underestimate marine stratocumulus cloud cover off the west coasts of South America and Southern Africa.
- The IFS models show reduced positive cloud cover biases over the Southern Ocean compared to the CMIP6 MMM, contributing to a lower overall RMSE, particularly for IFS-NEMO.
Spatial Patterns
The observational reference captures classic high cloud cover in the ITCZ, mid-latitude storm tracks, and marine stratocumulus decks, with clear skies over subtropical deserts. The high-resolution IFS models display pronounced positive biases (often exceeding 10%) across the trade-wind regions of the Pacific, Atlantic, and Indian Oceans. Negative biases are prevalent over North America, Eurasia, and the eastern boundary upwelling systems (e.g., Peru/Chile, Benguela). The CMIP6 MMM contrasts with the IFS models by showing widespread, strong positive biases over the Southern Ocean and equatorial Pacific, alongside negative biases over tropical landmasses such as the Amazon and Congo basins.
Model Agreement
IFS-FESOM and IFS-NEMO show exceptionally high spatial agreement in their bias patterns, which is expected given their shared atmospheric component (IFS). IFS-NEMO performs slightly better globally, with the lowest RMSE (4.57%) compared to IFS-FESOM (5.17%) and the CMIP6 MMM (5.30%). Inter-model agreement is high regarding the underestimation of eastern boundary stratocumulus, but the models diverge significantly over the Southern Ocean and tropical land regions where the CMIP6 MMM exhibits its largest errors.
Physical Interpretation
The pervasive underestimation of marine stratocumulus across all models highlights ongoing challenges in parameterizing boundary layer inversions and shallow vertical mixing, even at higher resolutions. The positive biases in the subtropical oceans for the IFS models likely stem from an overactive shallow convection scheme or an overestimation of trade-wind cumulus fraction. The reduction of the Southern Ocean positive cloud bias in the high-resolution IFS models compared to the CMIP6 MMM may be attributed to improved representation of mixed-phase cloud microphysics and better-resolved synoptic eddy dynamics in the storm tracks.
Caveats
- Total cloud cover in ERA5 is a derived, model-dependent reanalysis product rather than a direct satellite observation (like CERES or CALIPSO), introducing inherent uncertainties into the 'observational' baseline.
- The annual mean obscures seasonal variations in cloud regimes, particularly in stratocumulus and monsoon regions, which could reveal compensating seasonal errors.
Total Cloud Cover DJF Bias

| Variables | avg_tcc |
|---|---|
| Models | ifs-fesom, ifs-nemo, CMIP6 MMM, MPI-ESM1-2-LR/r1i1p1f1, GISS-E2-1-G/r1i1p1f2, IPSL-CM6A-LR/r1i1p1f1, ACCESS-ESM1-5/r1i1p1f1, EC-Earth3/r1i1p1f1, CNRM-CM6-1/r1i1p1f2, AWI-CM-1-1-MR/r1i1p1f1, CNRM-ESM2-1/r1i1p1f2, FGOALS-g3/r1i1p1f1, INM-CM5-0/r1i1p1f1, MRI-ESM2-0/r1i1p1f1 |
| Reference Dataset | ERA5 |
| Units | % |
| Period | 1990–2014 |
| CMIP6 MMM | Global Mean Bias: 0.36 · Rmse: None |
| MPI-ESM1-2-LR/r1i1p1f1 | Global Mean Bias: -0.62 · Rmse: None |
| GISS-E2-1-G/r1i1p1f2 | Global Mean Bias: -2.09 · Rmse: None |
| IPSL-CM6A-LR/r1i1p1f1 | Global Mean Bias: 0.07 · Rmse: None |
| ACCESS-ESM1-5/r1i1p1f1 | Global Mean Bias: 3.13 · Rmse: None |
| EC-Earth3/r1i1p1f1 | Global Mean Bias: 0.99 · Rmse: None |
| CNRM-CM6-1/r1i1p1f2 | Global Mean Bias: 1.80 · Rmse: None |
| AWI-CM-1-1-MR/r1i1p1f1 | Global Mean Bias: -2.69 · Rmse: None |
| CNRM-ESM2-1/r1i1p1f2 | Global Mean Bias: 1.67 · Rmse: None |
| FGOALS-g3/r1i1p1f1 | Global Mean Bias: -9.98 · Rmse: None |
| INM-CM5-0/r1i1p1f1 | Global Mean Bias: 7.73 · Rmse: None |
| MRI-ESM2-0/r1i1p1f1 | Global Mean Bias: -0.46 · Rmse: None |
Summary high
This figure evaluates biases in DJF Total Cloud Cover (TCC) for high-resolution DestinE models (IFS-FESOM, IFS-NEMO) and the CMIP6 multi-model mean against ERA5 reanalysis. The high-resolution IFS models exhibit distinct and nearly identical bias patterns dominated by overestimations in marine stratocumulus regions and underestimations in the tropics, contrasting sharply with the severe high-latitude positive biases seen in the CMIP6 MMM.
Key Findings
- IFS-FESOM and IFS-NEMO display nearly identical spatial bias patterns, indicating that the atmospheric model (IFS) dominates total cloud cover errors, regardless of the coupled ocean model.
- The high-resolution IFS models severely overestimate cloud cover (>15%) in eastern boundary upwelling regions (marine stratocumulus), such as off the coasts of Peru/Chile, Namibia/Angola, and California.
- CMIP6 MMM shows massive overestimation of cloud cover over the Arctic, Antarctic, and Tibetan Plateau; the high-resolution IFS models largely resolve the Tibetan bias and significantly reduce the Arctic positive bias, though they introduce negative biases over Northern Hemisphere landmasses.
Spatial Patterns
The IFS models show pronounced positive biases in subtropical marine stratocumulus decks, the Southern Ocean (40°S-60°S), and parts of the subtropical Atlantic/Pacific. Negative biases for IFS are prominent along the equatorial oceanic ITCZ/warm pool, the northern extratropical storm tracks, and across the Northern Hemisphere landmasses (Eurasia and North America). In contrast, the CMIP6 MMM is characterized by broad negative biases across the trade-wind regions and profound positive biases over the poles and major topography.
Model Agreement
There is exceptional inter-model agreement between IFS-FESOM and IFS-NEMO. However, there is strong disagreement between the DestinE models and the CMIP6 MMM. While both generations of models struggle with marine stratocumulus, the high-resolution models sharply localize and intensify this positive bias. Conversely, the high-resolution models completely diverge from CMIP6 in the high latitudes, replacing strong positive biases with neutral to negative biases.
Physical Interpretation
The positive biases in eastern boundary regions in the IFS models point to persistent challenges in parameterizing boundary layer physics and subsidence inversions governing marine stratocumulus clouds. The negative biases in the equatorial oceans in IFS likely relate to the representation of deep convection and a lack of associated anvil cloud fraction. The marked improvement over the Tibetan Plateau in the DestinE models is a direct result of the ~5 km resolution accurately resolving steep orography, preventing the spurious parameterized orographic lift and cloud formation seen in ~100 km CMIP6 models. The difference in Arctic cloud biases suggests fundamental differences in stable boundary layer or mixed-phase cloud parameterizations between IFS and older CMIP6 models.
Caveats
- ERA5 is a reanalysis product, and its total cloud cover is heavily dependent on the assimilating model's own cloud parameterizations; comparing to direct satellite products (like CERES or CloudSat/CALIPSO) would provide a more robust observational truth.
- Comparing single high-resolution models to an ensemble mean (CMIP6 MMM) naturally results in the CMIP6 biases appearing spatially smoother due to the averaging of different model errors.
Total Cloud Cover JJA Bias
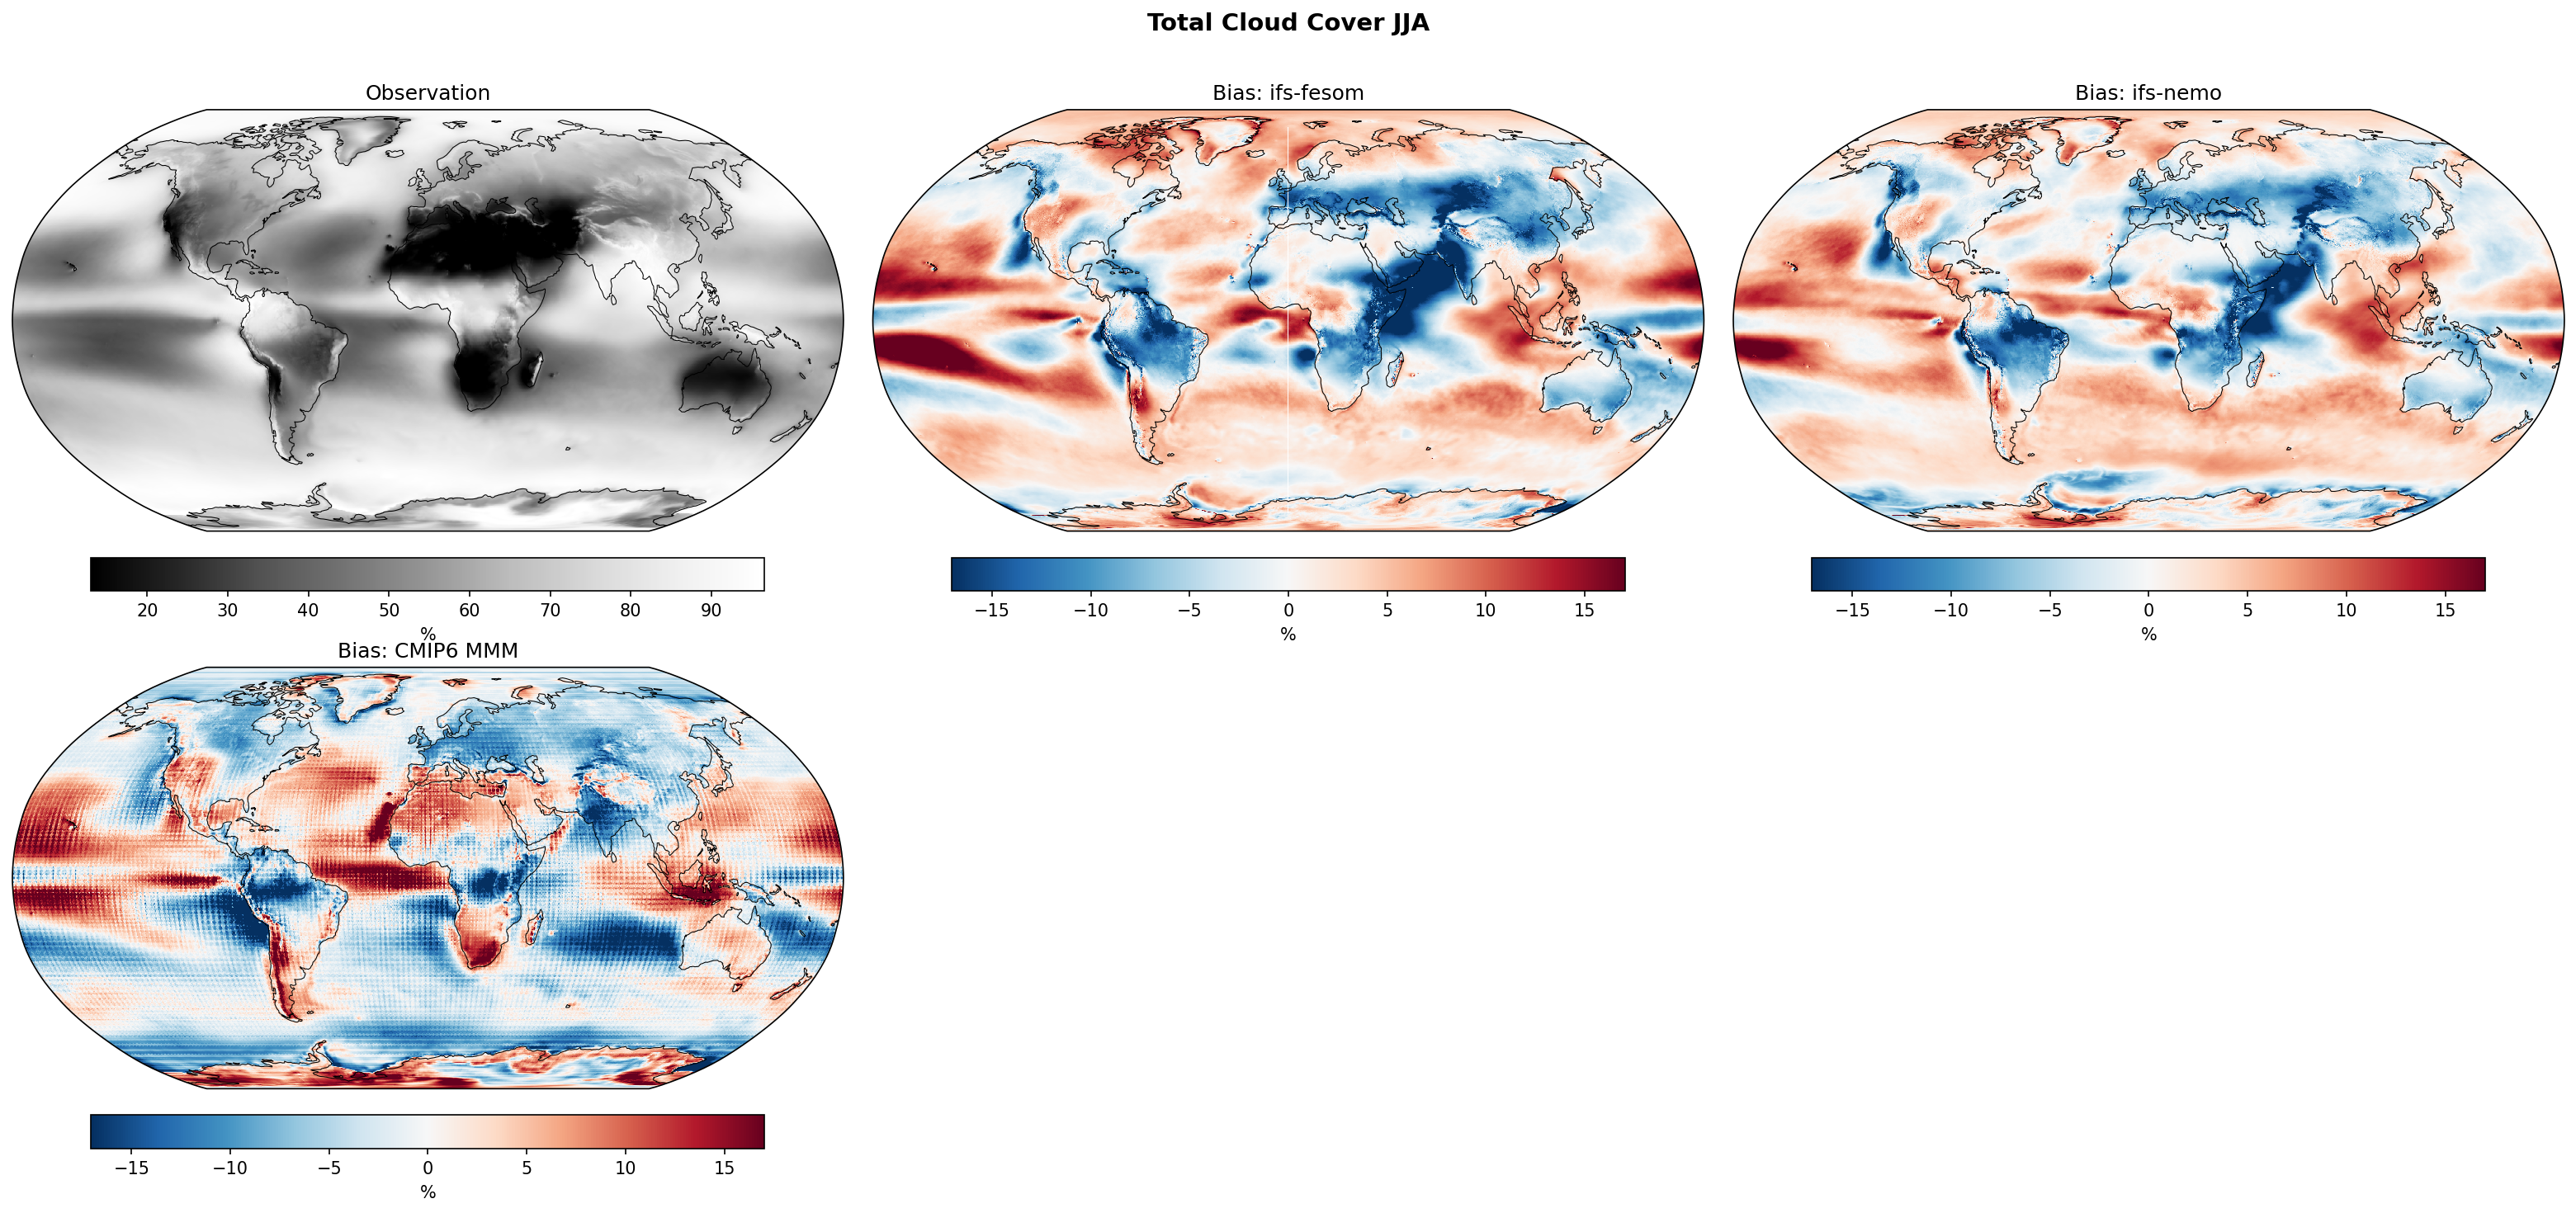
| Variables | avg_tcc |
|---|---|
| Models | ifs-fesom, ifs-nemo, CMIP6 MMM, MPI-ESM1-2-LR/r1i1p1f1, GISS-E2-1-G/r1i1p1f2, IPSL-CM6A-LR/r1i1p1f1, ACCESS-ESM1-5/r1i1p1f1, EC-Earth3/r1i1p1f1, CNRM-CM6-1/r1i1p1f2, AWI-CM-1-1-MR/r1i1p1f1, CNRM-ESM2-1/r1i1p1f2, FGOALS-g3/r1i1p1f1, INM-CM5-0/r1i1p1f1, MRI-ESM2-0/r1i1p1f1 |
| Reference Dataset | ERA5 |
| Units | % |
| Period | 1990–2014 |
| CMIP6 MMM | Global Mean Bias: -0.82 · Rmse: None |
| MPI-ESM1-2-LR/r1i1p1f1 | Global Mean Bias: -0.23 · Rmse: None |
| GISS-E2-1-G/r1i1p1f2 | Global Mean Bias: -4.29 · Rmse: None |
| IPSL-CM6A-LR/r1i1p1f1 | Global Mean Bias: -2.92 · Rmse: None |
| ACCESS-ESM1-5/r1i1p1f1 | Global Mean Bias: 1.15 · Rmse: None |
| EC-Earth3/r1i1p1f1 | Global Mean Bias: 1.20 · Rmse: None |
| CNRM-CM6-1/r1i1p1f2 | Global Mean Bias: -0.10 · Rmse: None |
| AWI-CM-1-1-MR/r1i1p1f1 | Global Mean Bias: -3.37 · Rmse: None |
| CNRM-ESM2-1/r1i1p1f2 | Global Mean Bias: -0.15 · Rmse: None |
| FGOALS-g3/r1i1p1f1 | Global Mean Bias: -8.41 · Rmse: None |
| INM-CM5-0/r1i1p1f1 | Global Mean Bias: 5.59 · Rmse: None |
| MRI-ESM2-0/r1i1p1f1 | Global Mean Bias: -1.55 · Rmse: None |
Summary high
The figure displays the JJA (June-July-August) climatological biases in total cloud cover for two high-resolution models (IFS-FESOM, IFS-NEMO) and the CMIP6 multi-model mean, evaluated against ERA5 reanalysis.
Key Findings
- IFS models exhibit severe underestimation of cloud cover over major Northern Hemisphere landmasses and tropical continents.
- IFS models strongly overestimate cloud cover in subtropical marine stratocumulus regions, a stark contrast to the underestimation seen in the CMIP6 MMM.
- The bias patterns in IFS-FESOM and IFS-NEMO are nearly identical, indicating that the atmospheric component (IFS) dominates the cloud climatology regardless of the coupled ocean model.
Spatial Patterns
Pronounced negative biases (exceeding -15%) are visible over North America, Eurasia, the Amazon, and equatorial Africa in both IFS models. Conversely, strong positive biases (>15%) occur over subtropical eastern ocean basins (stratocumulus decks off the coasts of Peru, California, and Namibia) and parts of the Southern Ocean. The CMIP6 MMM shows an opposing pattern in marine stratocumulus zones (negative bias) and generally more positive biases over tropical landmasses.
Model Agreement
There is exceptionally high agreement between IFS-FESOM and IFS-NEMO. However, there is substantial disagreement between the high-resolution IFS models and the coarse-resolution CMIP6 MMM, particularly regarding the sign of biases in marine stratocumulus regions and over deep tropical land.
Physical Interpretation
The widespread negative bias over NH land in the IFS models during summer suggests potential deficiencies in continental convection parameterizations, boundary layer venting, or land-atmosphere coupling under strong insolation, which could exacerbate summer warm biases. The overestimation in marine stratocumulus regions indicates boundary layer or shallow convection schemes in IFS that over-produce or excessively maintain low clouds, contrasting with the classic 'too few, too bright' low-cloud problem prevalent in older or coarser CMIP6 models.
Caveats
- ERA5 total cloud cover is heavily dependent on the reanalysis model's own physics rather than direct assimilation, and thus may contain biases compared to direct satellite observations (e.g., CERES or ISCCP).
- The CMIP6 MMM bias map exhibits visible gridding artifacts (stippling pattern), likely resulting from regridding numerous disparate coarse-resolution grids to a common high-resolution map.
TOA Net Longwave Radiation Annual Mean Bias
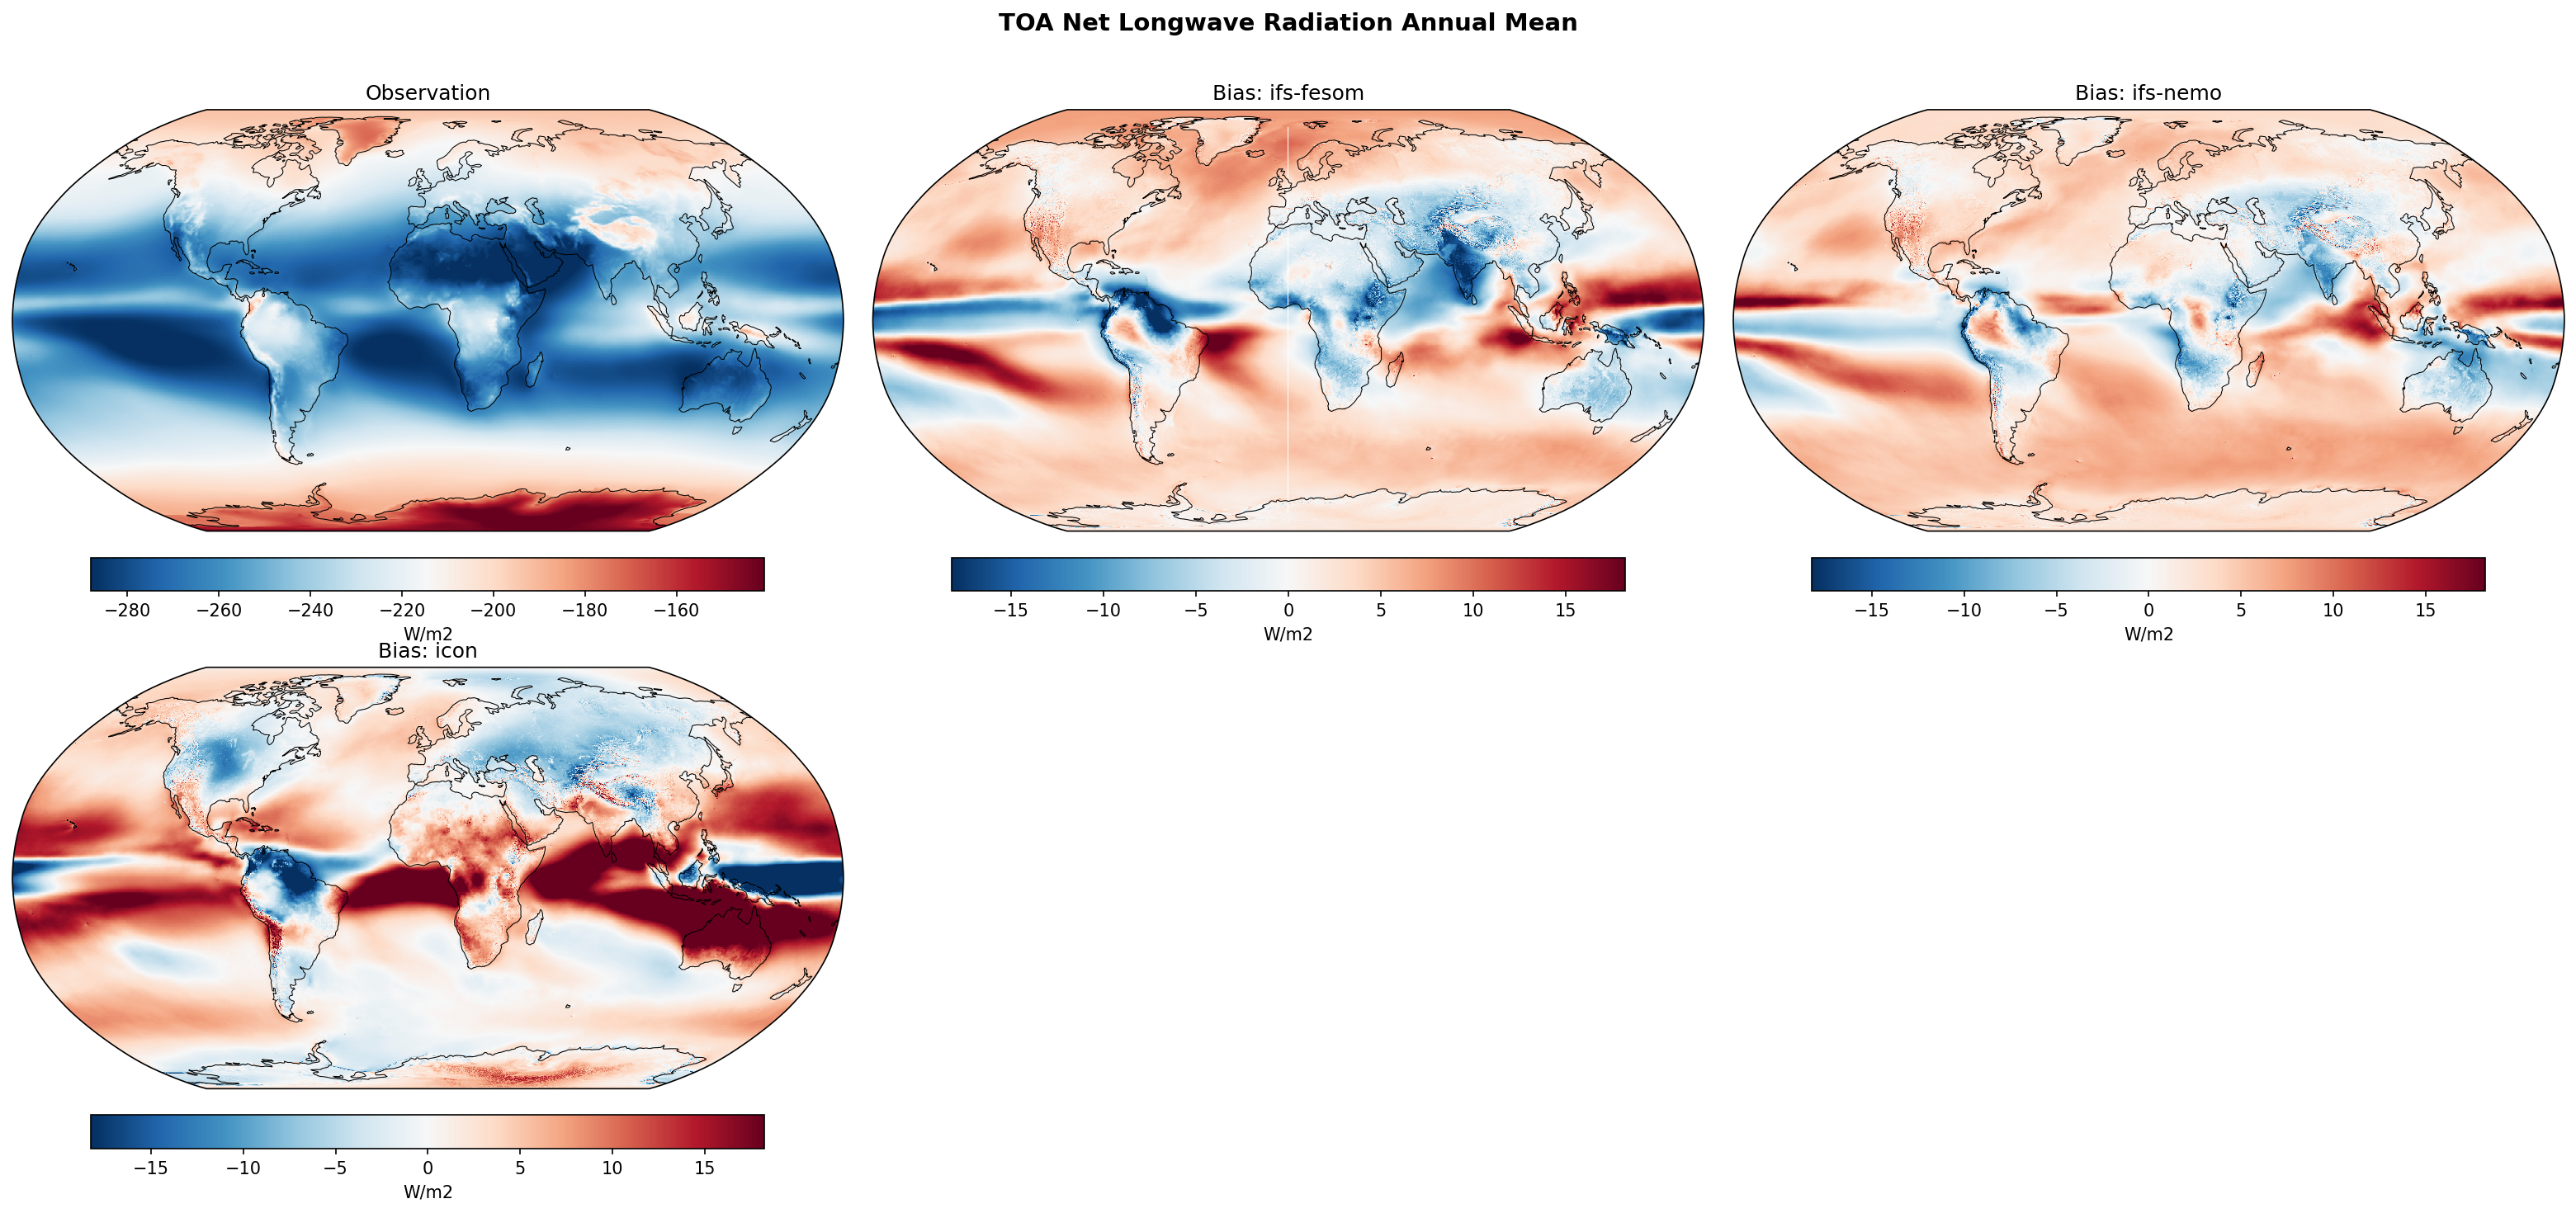
| Variables | avg_tnlwrf |
|---|---|
| Models | ifs-fesom, ifs-nemo, icon |
| Reference Dataset | ERA5 |
| Units | W/m2 |
| Period | 1990–2014 |
| ifs-fesom | Global Mean Bias: 1.51 · Rmse: 6.26 |
| ifs-nemo | Global Mean Bias: 2.26 · Rmse: 5.09 |
| icon | Global Mean Bias: 3.82 · Rmse: 10.14 |
Summary high
This figure evaluates the annual mean top-of-atmosphere (TOA) net longwave radiation biases for three high-resolution climate models compared to ERA5 reanalysis, highlighting their ability to simulate high clouds, deep convection, and clear-sky emission.
Key Findings
- IFS-NEMO exhibits the best global performance with the lowest RMSE (5.16 W/m²), followed closely by IFS-FESOM (6.26 W/m²), whereas ICON struggles with substantially larger errors (RMSE 10.06 W/m²).
- All three models share a common negative bias (excessive outgoing longwave radiation) over major tropical landmasses, including the Amazon and Congo basins.
- ICON displays a highly exaggerated tropical land-sea contrast, with severe OLR underestimation over tropical oceans and strong OLR overestimation over tropical land.
Spatial Patterns
Observations demonstrate strong OLR emission (highly negative values) in subtropical clear-sky subsidence zones and weaker emission over cloudy, deep convective regions like the ITCZ and warm pool. Both IFS-FESOM and IFS-NEMO show moderate positive biases (insufficient OLR) along the Pacific ITCZ and SPCZ, and negative biases over tropical land. In stark contrast, ICON features intense positive biases across the tropical Atlantic, Indian, and Pacific Oceans, paired with extreme negative biases over the Maritime Continent, equatorial South America, and central Africa.
Model Agreement
The two IFS-coupled models exhibit strong agreement in their spatial bias patterns, indicating that the atmospheric component predominantly dictates TOA radiation errors, though the NEMO ocean coupling slightly reduces the overall RMSE. ICON diverges significantly from the IFS models, producing uniquely large biases and a distinct spatial footprint.
Physical Interpretation
TOA net longwave radiation is heavily modulated by the presence and height of clouds. Positive biases (less negative net LW, meaning insufficient outgoing radiation) over oceans indicate that the models produce high clouds that are too extensive, optically thick, or have cloud tops that are too cold. Conversely, the widespread negative biases (excessive OLR) over tropical landmasses in all models point to a systematic deficiency in simulated deep convection and associated cirrus anvils over land. ICON's extreme land-sea bias dichotomy suggests structural challenges in its convective parameterization or cloud macrophysics regarding how convection is triggered and sustained over varying surface types.
Caveats
- ERA5 is a reanalysis product; using direct satellite retrievals like CERES EBAF would provide a more robust observational benchmark for TOA radiation.
- TOA longwave biases represent the integrated atmospheric column and may conceal compensating errors between surface temperature, cloud fraction, and cloud top height.
TOA Net Longwave Radiation DJF Bias
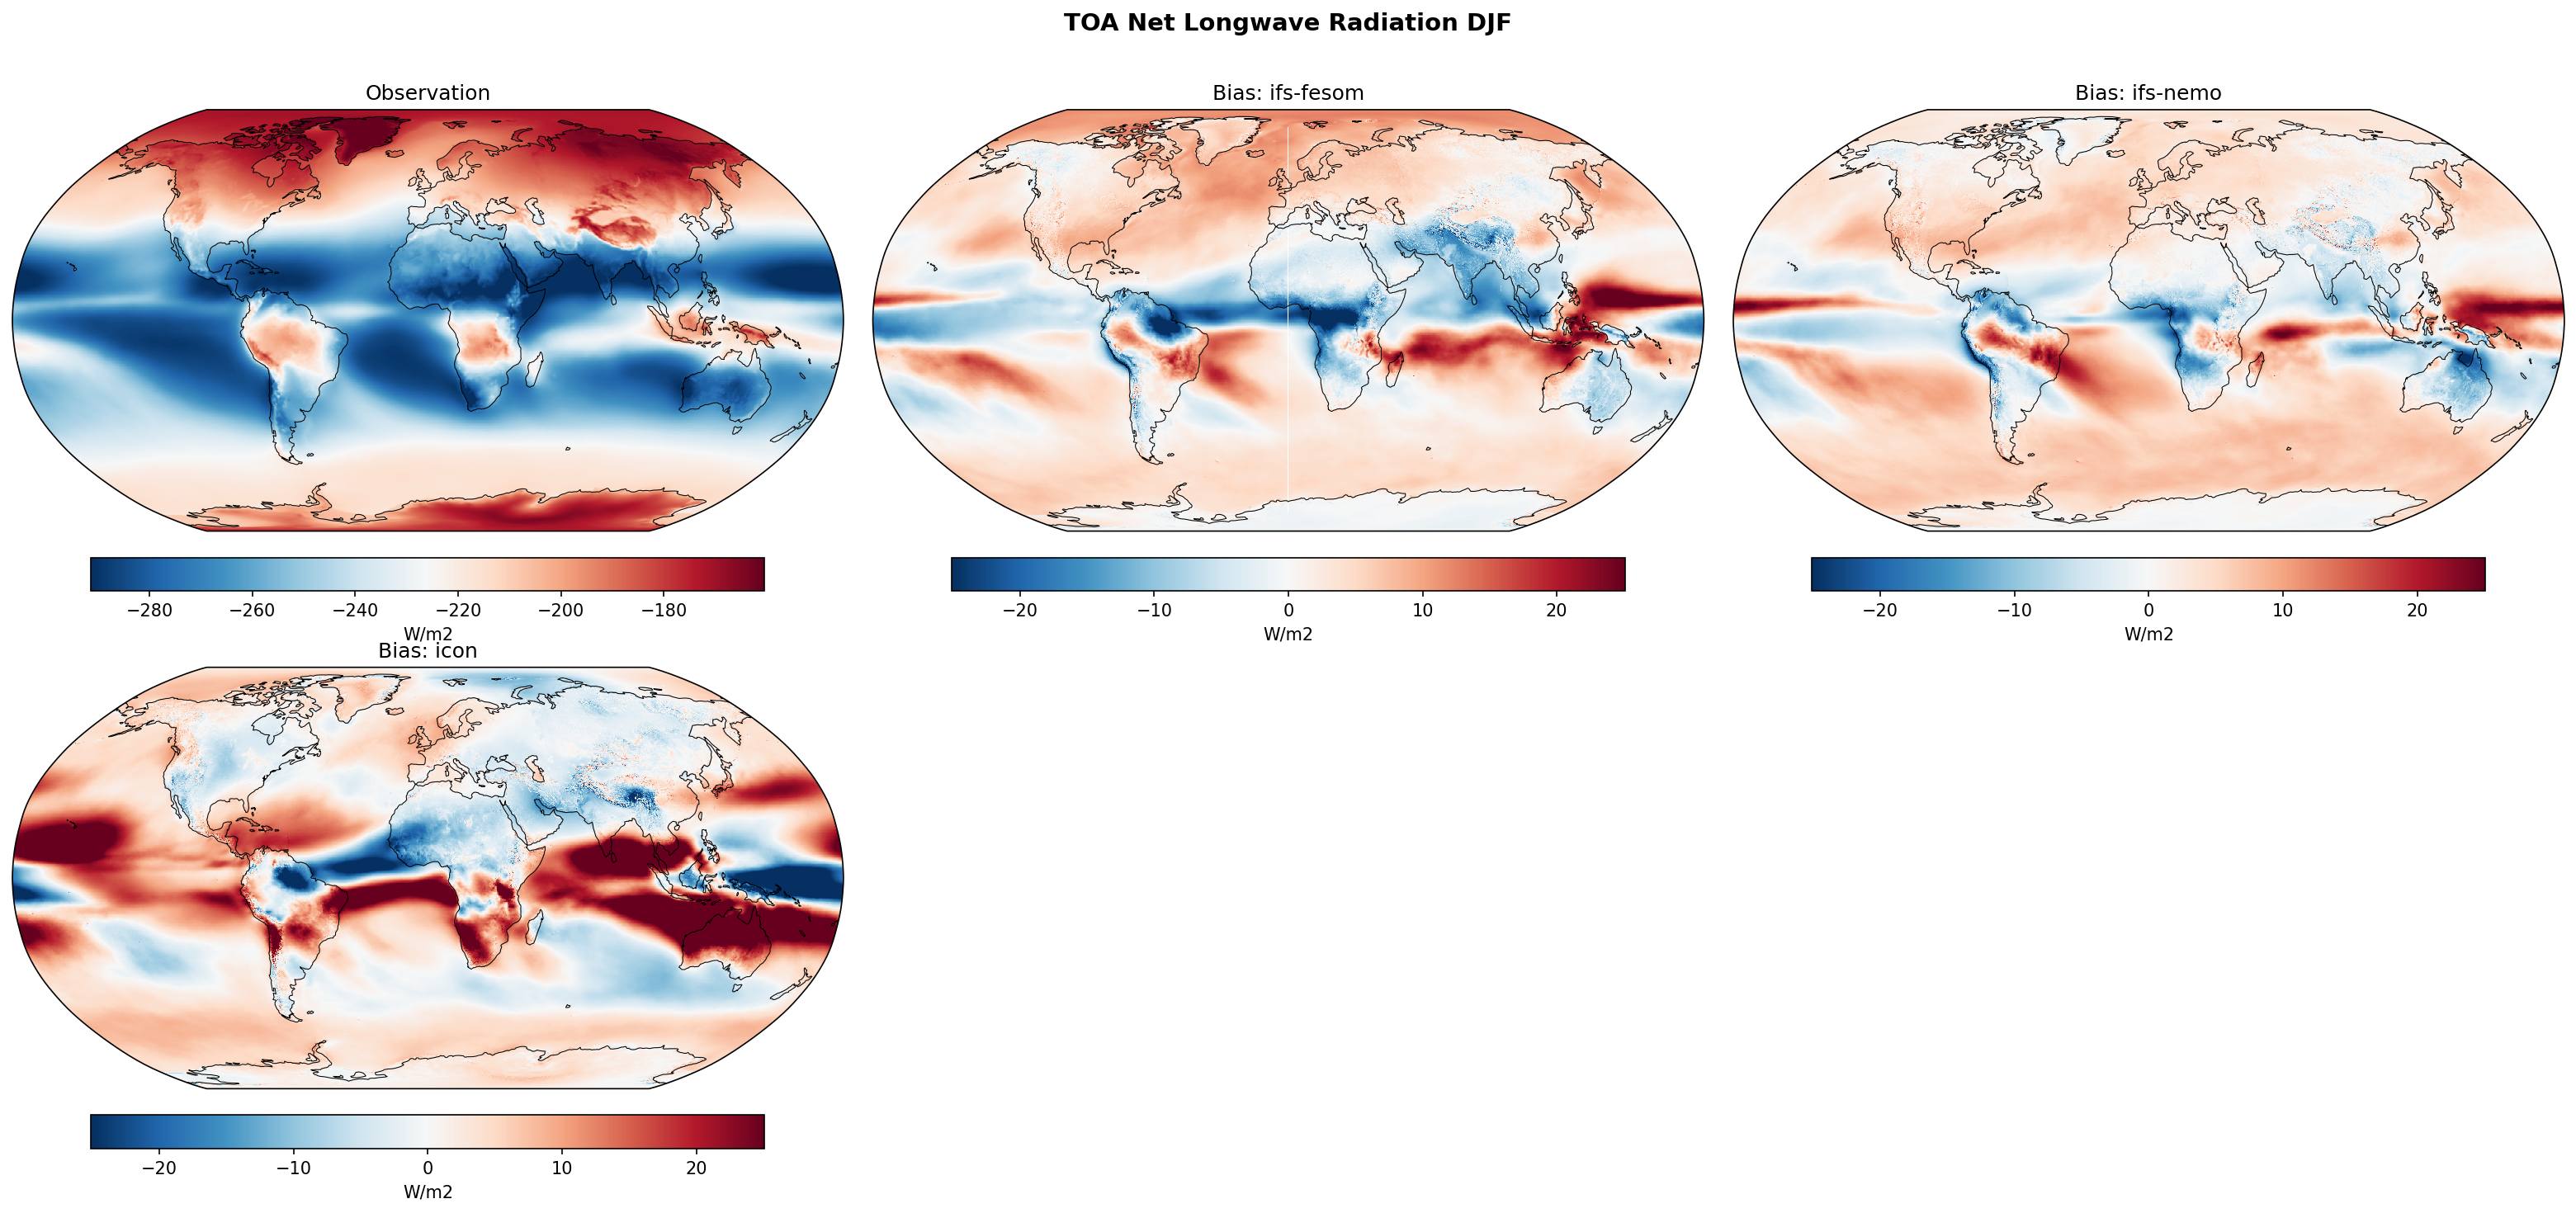
| Variables | avg_tnlwrf |
|---|---|
| Models | ifs-fesom, ifs-nemo, icon |
| Reference Dataset | ERA5 |
| Units | W/m2 |
| Period | 1990–2014 |
Summary high
The figure displays DJF climatological biases in Top of Atmosphere (TOA) Net Longwave Radiation for three high-resolution models against ERA5, highlighting systematic errors in cloud radiative effects and the representation of deep convection.
Key Findings
- IFS-FESOM and IFS-NEMO exhibit similar, moderate bias patterns, reflecting their shared atmospheric component.
- ICON displays substantially larger magnitude biases compared to the IFS-based models, particularly over tropical oceans and mid-latitude storm tracks.
- All models show a pronounced land-ocean contrast in tropical biases, systematically overestimating outgoing longwave radiation (OLR) over land convective centers and underestimating it over adjacent oceans.
Spatial Patterns
Observations show high OLR emission (strongly negative net longwave) in clear-sky subtropics and lower emission (less negative) over cold deep convective zones such as the Amazon, Congo, and Maritime Continent. Bias maps reveal significant negative biases (excessive OLR) over these tropical land masses. Conversely, prominent positive biases (reduced OLR) are widespread over the tropical Pacific, Atlantic, and Indian Oceans. ICON's positive biases are highly amplified and extend extensively into the mid-latitude oceanic storm tracks.
Model Agreement
IFS-FESOM and IFS-NEMO agree strongly in both spatial structure and magnitude, demonstrating the dominant role of the atmospheric formulation over the ocean coupling. ICON captures a similar broad-scale spatial dipole but diverges significantly in magnitude, showing severe biases that dominate the global tropics.
Physical Interpretation
TOA Net Longwave (effectively negative OLR) is heavily modulated by high clouds. Negative biases over tropical landmasses during the DJF wet season imply an underestimation of deep convection, high cloud fraction, or anvil thickness, allowing too much longwave radiation to escape. Positive biases over oceans suggest excessive high or mid-level cloud cover trapping too much heat. ICON's exaggerated land-ocean contrast suggests its convective parameterization is overly sensitive to surface types or struggles to balance deep convection between land and ocean.
Caveats
- ERA5 TOA radiation relies on model parameterizations; comparing against direct satellite measurements like CERES EBAF is standard and preferable for evaluating top-of-atmosphere radiation budgets.
- OLR biases represent integrated column effects; compensating errors between surface temperature, cloud fraction, and cloud optical depth cannot be fully disentangled from this single diagnostic.
TOA Net Longwave Radiation JJA Bias
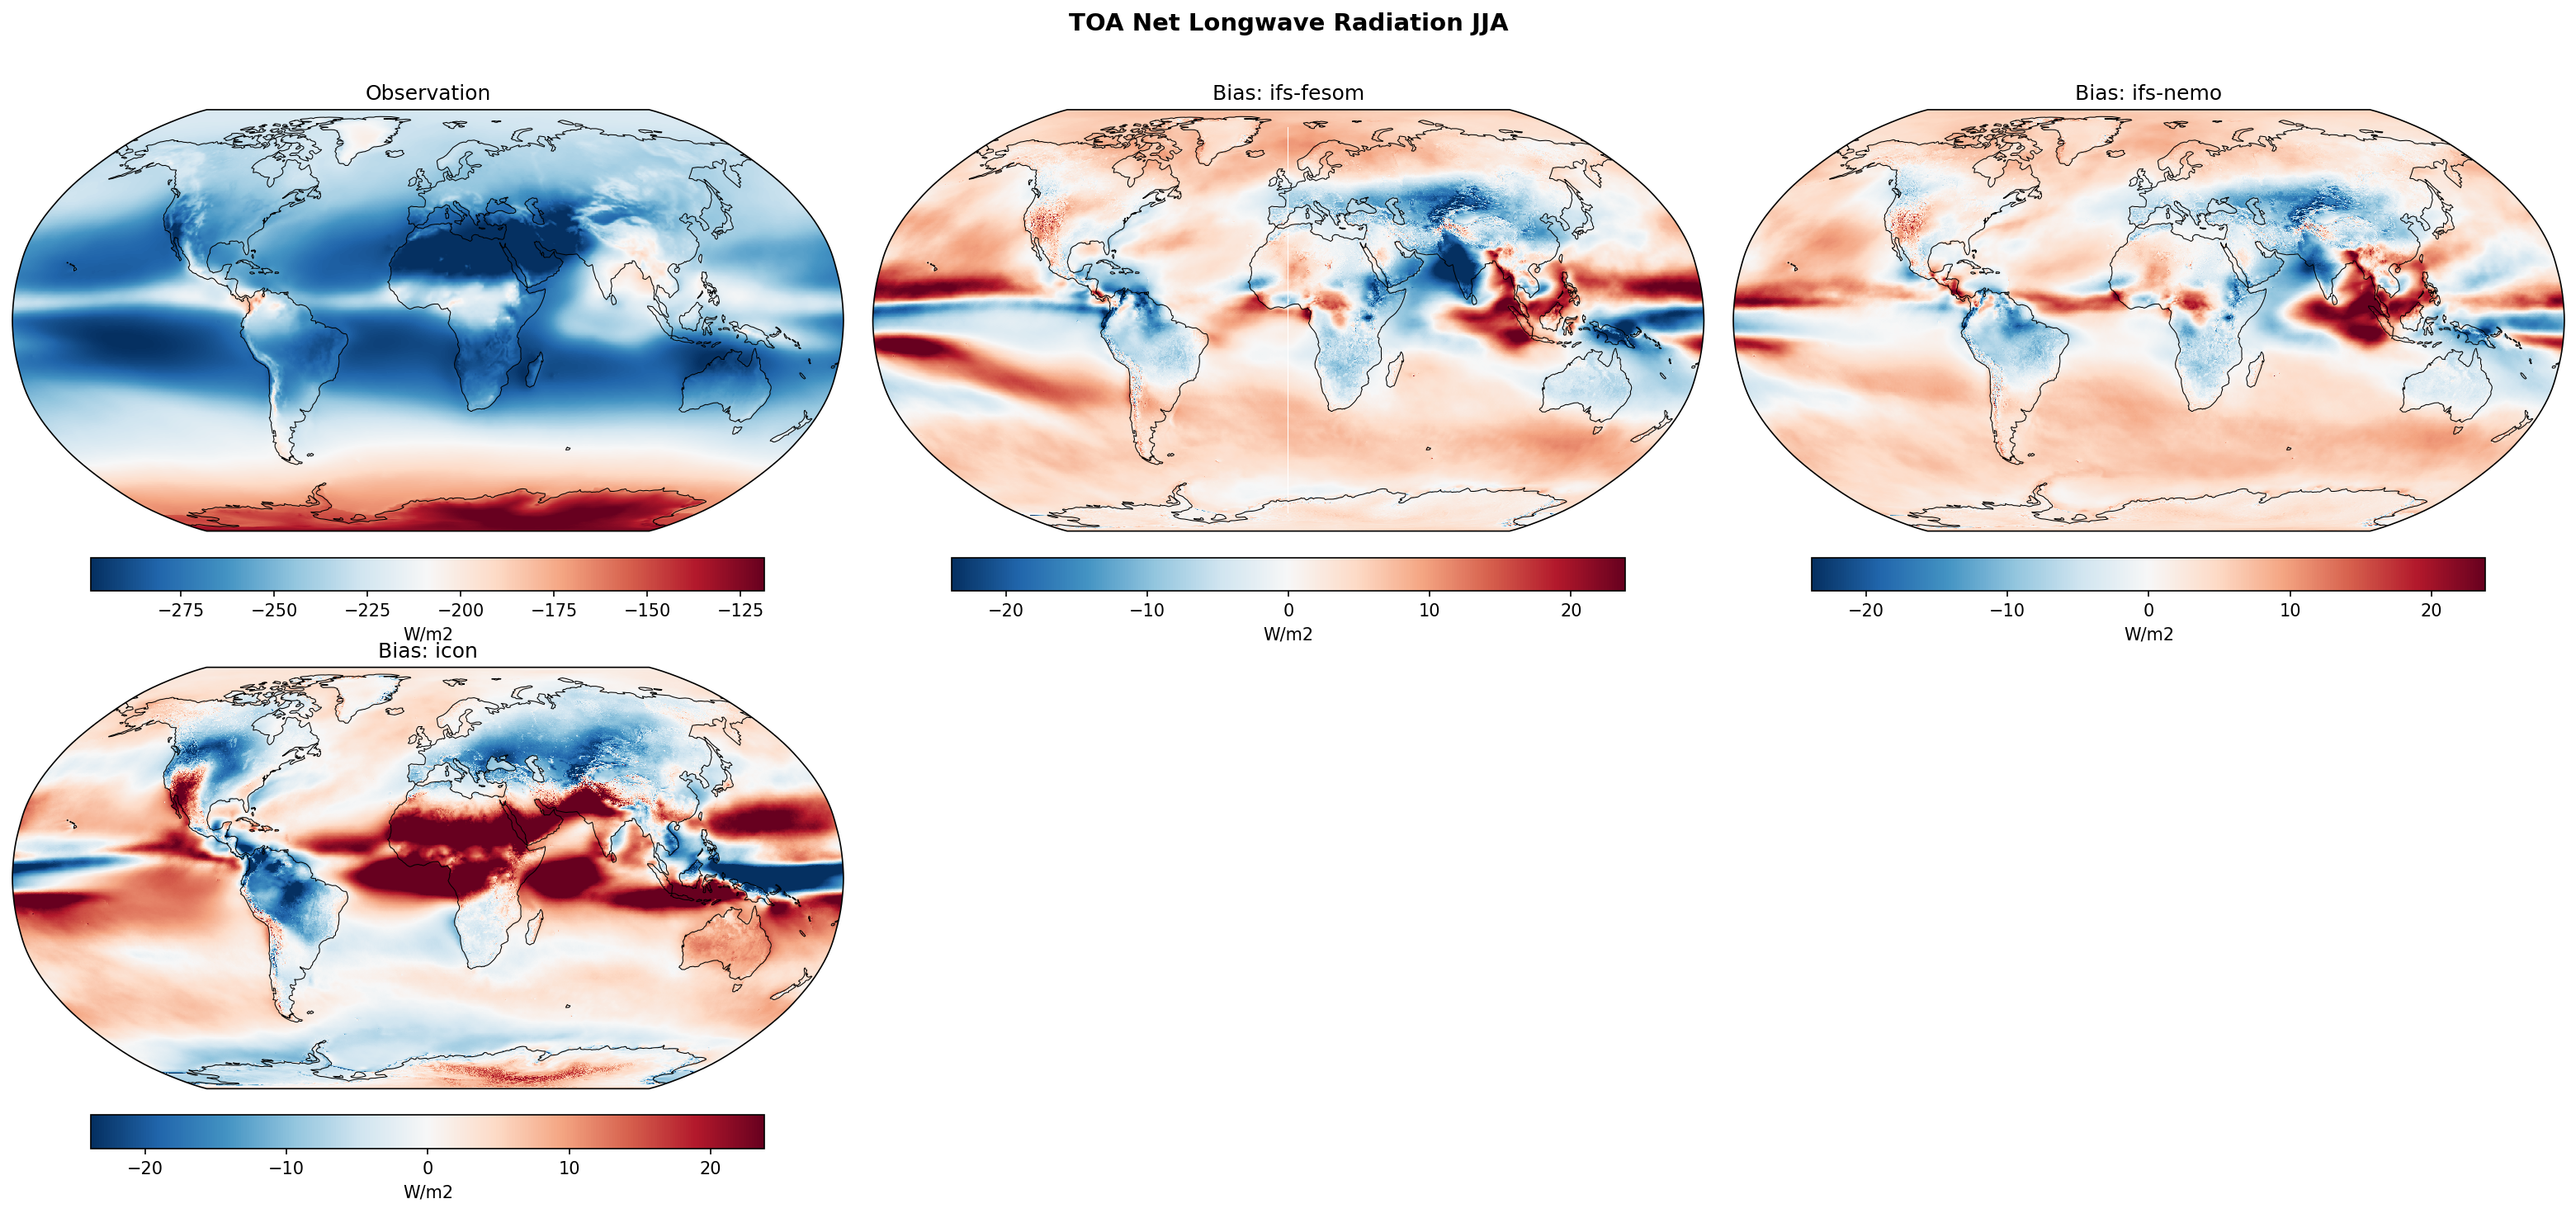
| Variables | avg_tnlwrf |
|---|---|
| Models | ifs-fesom, ifs-nemo, icon |
| Reference Dataset | ERA5 |
| Units | W/m2 |
| Period | 1990–2014 |
Summary high
The figure presents the JJA (June-July-August) climatological mean of Top-Of-Atmosphere (TOA) Net Longwave Radiation from ERA5 and the corresponding biases for three high-resolution models (IFS-FESOM, IFS-NEMO, ICON).
Key Findings
- All models exhibit positive biases (underestimated outgoing longwave radiation, OLR) over the deep tropics and summer monsoon regions, indicating an overestimation of high clouds.
- ICON shows substantially larger bias magnitudes in the tropics compared to the IFS-based models, particularly over Africa, the Indian Ocean, and the Maritime Continent.
- Negative biases (overestimated OLR) dominate over Northern Hemisphere mid-latitude landmasses and subtropical oceans, suggesting insufficient cloud cover or excessive surface heating.
Spatial Patterns
Pronounced positive biases (red, indicating too little OLR) are concentrated in the Asian monsoon region, the Maritime Continent, and along the ITCZ. Widespread negative biases (blue, indicating too much OLR) are visible over Northern Hemisphere summer continents (North America, Eurasia) and the Sahara. In the Pacific, the IFS models show a banded bias structure along the equator, with a central positive bias flanked by negative biases.
Model Agreement
IFS-FESOM and IFS-NEMO display nearly identical bias patterns and magnitudes, reflecting their shared atmospheric component. ICON agrees on the broad geographic distribution of the biases (e.g., positive in convective tropics, negative over NH land) but diverges significantly in amplitude, showing much more severe OLR underestimations in tropical monsoon regions.
Physical Interpretation
TOA Net Longwave radiation is primarily modulated by cloud top temperatures and clear-sky surface temperatures. The strong positive biases in the tropics imply that the models generate excessive high-altitude, cold cloud cover (such as deep convective anvils), which traps too much outgoing longwave radiation. Conversely, the negative biases over summer continents suggest a lack of cloud cover, allowing excessive thermal emission from the warm land surface to escape to space.
Caveats
- The reference dataset is ERA5, which relies on a model parameterization to generate TOA radiation fields; evaluating against direct satellite observations like CERES EBAF would provide a more robust ground truth.
- TOA radiation biases represent vertically integrated effects and may obscure compensating errors between surface temperature, vertical temperature profiles, and cloud optical properties.
TOA Net Longwave Radiation (Clear-Sky) Annual Mean Bias
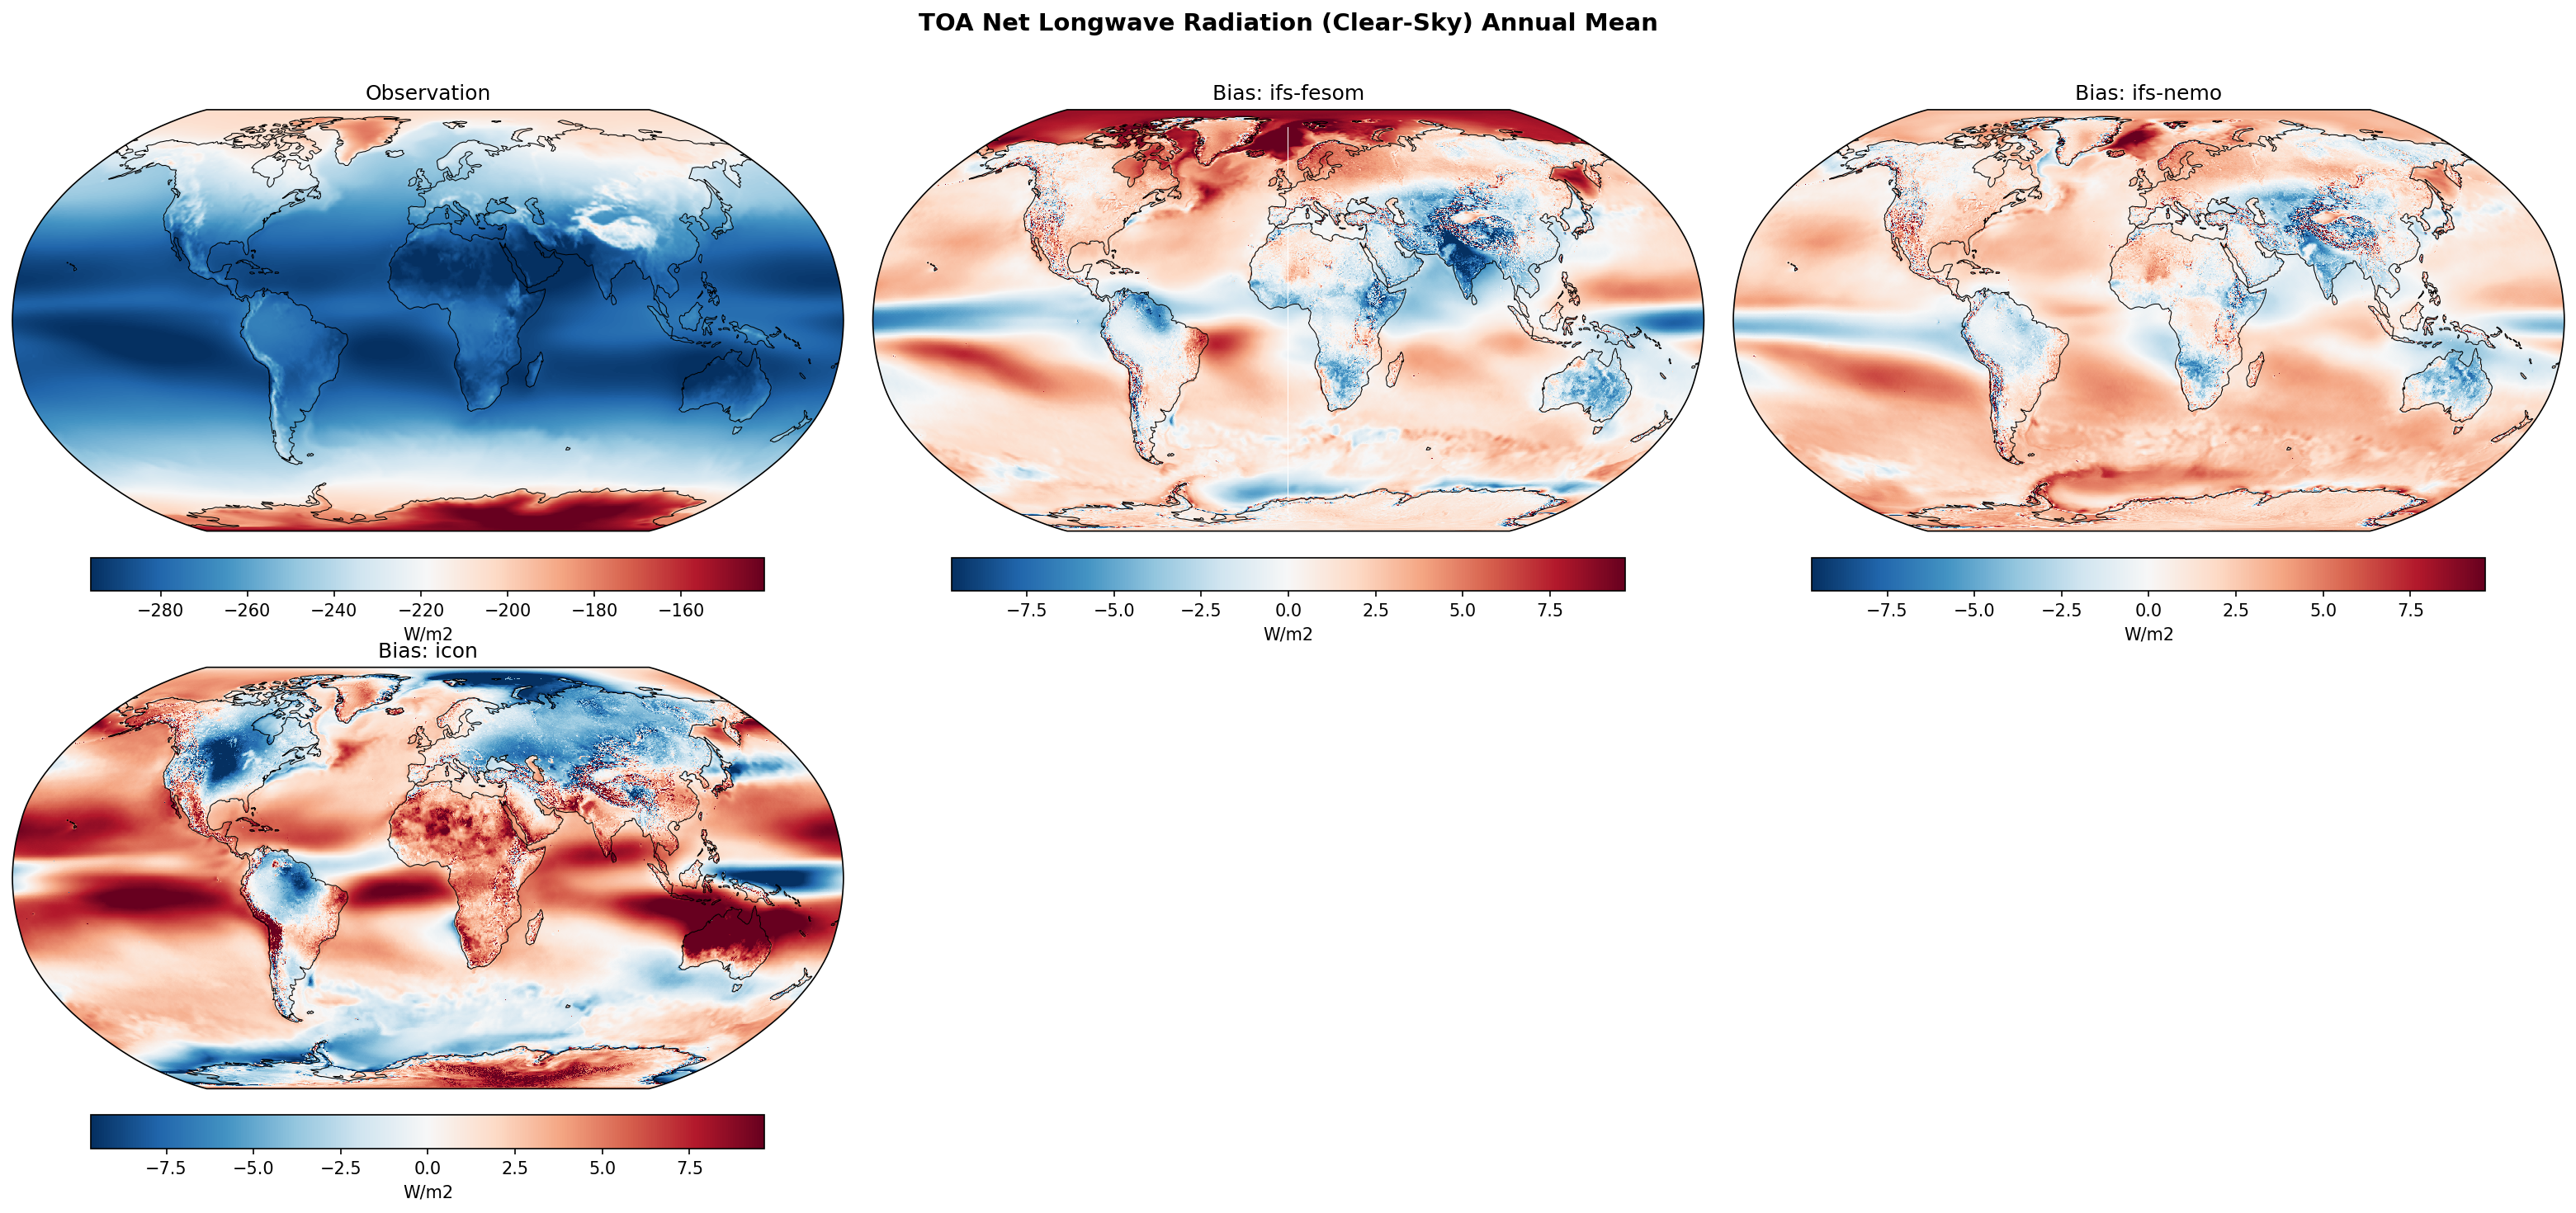
| Variables | avg_tnlwrfcs |
|---|---|
| Models | ifs-fesom, ifs-nemo, icon |
| Reference Dataset | ERA5 |
| Units | W/m2 |
| Period | 1990–2014 |
| ifs-fesom | Global Mean Bias: 0.67 · Rmse: 3.06 |
| ifs-nemo | Global Mean Bias: 1.20 · Rmse: 2.64 |
| icon | Global Mean Bias: 2.10 · Rmse: 4.92 |
Summary high
The figure evaluates the annual mean TOA clear-sky net longwave radiation biases of three high-resolution DestinE models against ERA5, revealing distinct model-dependent spatial patterns and magnitudes.
Key Findings
- IFS-FESOM and IFS-NEMO exhibit similar, relatively low-magnitude bias patterns, reflecting their shared atmospheric component (IFS).
- ICON displays significantly larger biases, characterized by a pronounced land-sea contrast with excessive OLR over northern hemisphere landmasses and deficient OLR over subtropical oceans.
- Fine-scale bias structures are prominently visible over major mountain ranges (e.g., Himalayas, Andes, Rockies), highlighting the impact of high-resolution (~5 km) topography on local surface emission or moisture fields.
Spatial Patterns
In the IFS-based models, positive biases (insufficient outgoing longwave radiation, OLR) are localized over high-latitude oceans (Southern Ocean, Arctic), while negative biases (excessive OLR) dominate tropical landmasses and parts of the equatorial oceans. Conversely, ICON shows strong negative biases over North America, Eurasia, and Antarctica, juxtaposed with intense, widespread positive biases across the subtropical and mid-latitude oceans.
Model Agreement
There is strong inter-model agreement between IFS-FESOM and IFS-NEMO, with minor regional differences driven by their respective ocean components (which influence SSTs). ICON diverges substantially from the IFS models, resulting in the highest global mean bias (2.22 W/m2) and RMSE (4.89 W/m2), compared to IFS-NEMO's lowest RMSE (2.68 W/m2).
Physical Interpretation
Clear-sky TOA OLR biases are primarily controlled by errors in surface skin temperature and tropospheric water vapor. Negative biases (excessive OLR, blue) typically indicate that the surface is too warm or the overlying atmosphere is too dry. Positive biases (insufficient OLR, red) suggest the surface is too cold or the troposphere is overly moist (enhanced greenhouse trapping). ICON's severe land-sea bias contrast likely indicates systematic issues with exaggerated land-surface warming or atmospheric moisture partitioning compared to oceanic regions.
Caveats
- The calculation of 'clear-sky' fluxes in models depends on specific radiative transfer assumptions (e.g., removing clouds vs. sampling only cloud-free columns), which can introduce methodological discrepancies when compared to reanalysis.
- ERA5 is used as the observational baseline, but as a reanalysis, its clear-sky radiation fields are derived from the model physics and assimilated state rather than being direct observations, and may differ from dedicated satellite products like CERES.
TOA Net Longwave Radiation (Clear-Sky) DJF Bias
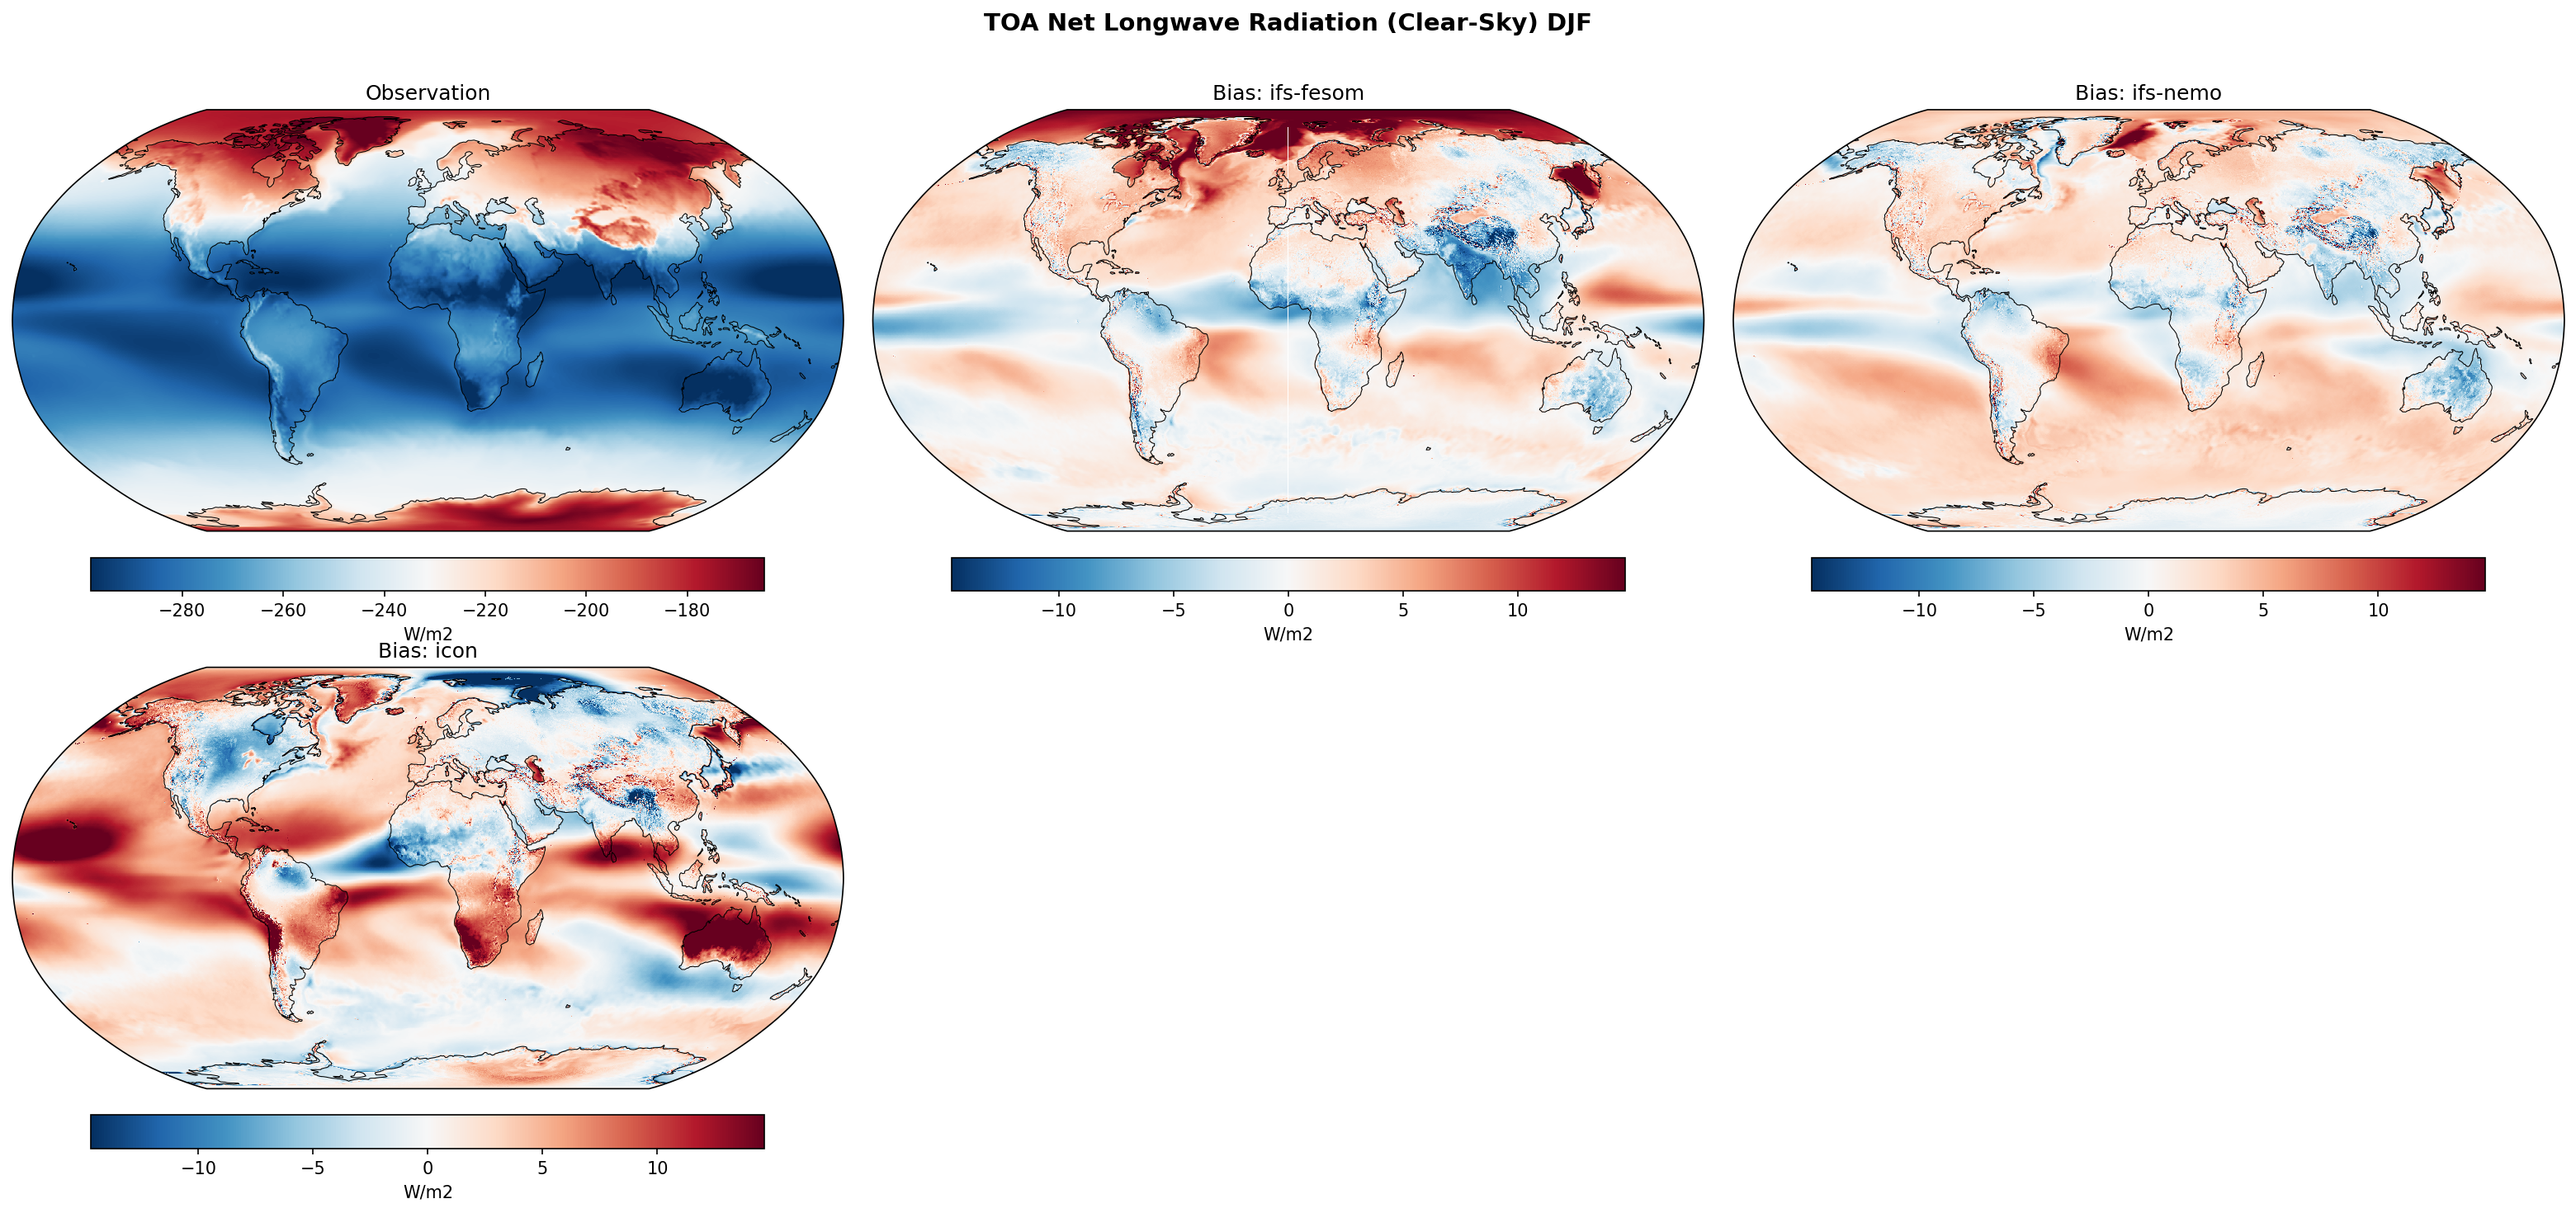
| Variables | avg_tnlwrfcs |
|---|---|
| Models | ifs-fesom, ifs-nemo, icon |
| Reference Dataset | ERA5 |
| Units | W/m2 |
| Period | 1990–2014 |
Summary high
This figure presents DJF climatological biases in Top of Atmosphere (TOA) Net Longwave Radiation under clear-sky conditions for three high-resolution models (IFS-FESOM, IFS-NEMO, ICON) evaluated against ERA5 reanalysis.
Key Findings
- IFS-FESOM and IFS-NEMO exhibit very similar bias patterns and generally low bias magnitudes globally, indicating the atmospheric model (IFS) dominates the clear-sky radiative response regardless of the ocean coupling.
- ICON displays significantly larger bias magnitudes globally, with strong positive biases (underestimated OLR) over most subtropical and mid-latitude oceans, and strong negative biases (overestimated OLR) over Northern Hemisphere high-latitude landmasses.
- All three models share pronounced negative biases over high-altitude topography, most notably the Himalayas/Tibetan Plateau and the Andes.
Spatial Patterns
The observation map shows the expected latitudinal gradient of clear-sky TOA net longwave radiation, with the most negative values (highest OLR) in the subtropics and least negative values at the poles. The IFS models show weak positive biases over the Arctic Ocean, the Southern Ocean, and mid-latitude storm tracks, with narrow bands of negative bias along the equatorial Pacific and ITCZ. ICON diverges strongly, showing widespread positive biases exceeding 10 W/m2 over subtropical marine stratocumulus regions and the Southern Ocean, while exhibiting deep negative biases over cold winter landmasses in Canada and Siberia.
Model Agreement
There is excellent agreement between the two IFS-based models, suggesting minimal sensitivity of clear-sky TOA longwave to the choice of ocean model (FESOM vs. NEMO) in these regions. However, there is substantial disagreement between the IFS models and ICON, highlighting structural differences in atmospheric radiation, humidity, or surface temperature parameterizations.
Physical Interpretation
Clear-sky TOA net longwave radiation (which is effectively negative OLR) is governed by surface temperature, atmospheric temperature profiles, and column water vapor. Positive biases (less negative net LW, indicating underestimated OLR) over subtropical oceans in ICON likely stem from either cold surface temperature biases or excessive atmospheric water vapor (an enhanced clear-sky greenhouse effect). Negative biases (overestimated OLR) over winter high-latitude landmasses in ICON suggest an warm surface bias or insufficient column moisture. The shared negative biases over the Himalayas across all models may reflect challenges in accurately simulating high-altitude snow cover, surface temperatures, or representing ERA5's specific topography.
Caveats
- ERA5 is a reanalysis, not a direct satellite observation like CERES; its clear-sky radiative fluxes depend heavily on the integrated IFS forecasting system's radiation scheme and moisture fields.
- Clear-sky diagnostics are subject to conditional sampling biases, as they represent the atmospheric state only when clouds are absent, which can differ systematically between the models and the reanalysis.
TOA Net Longwave Radiation (Clear-Sky) JJA Bias
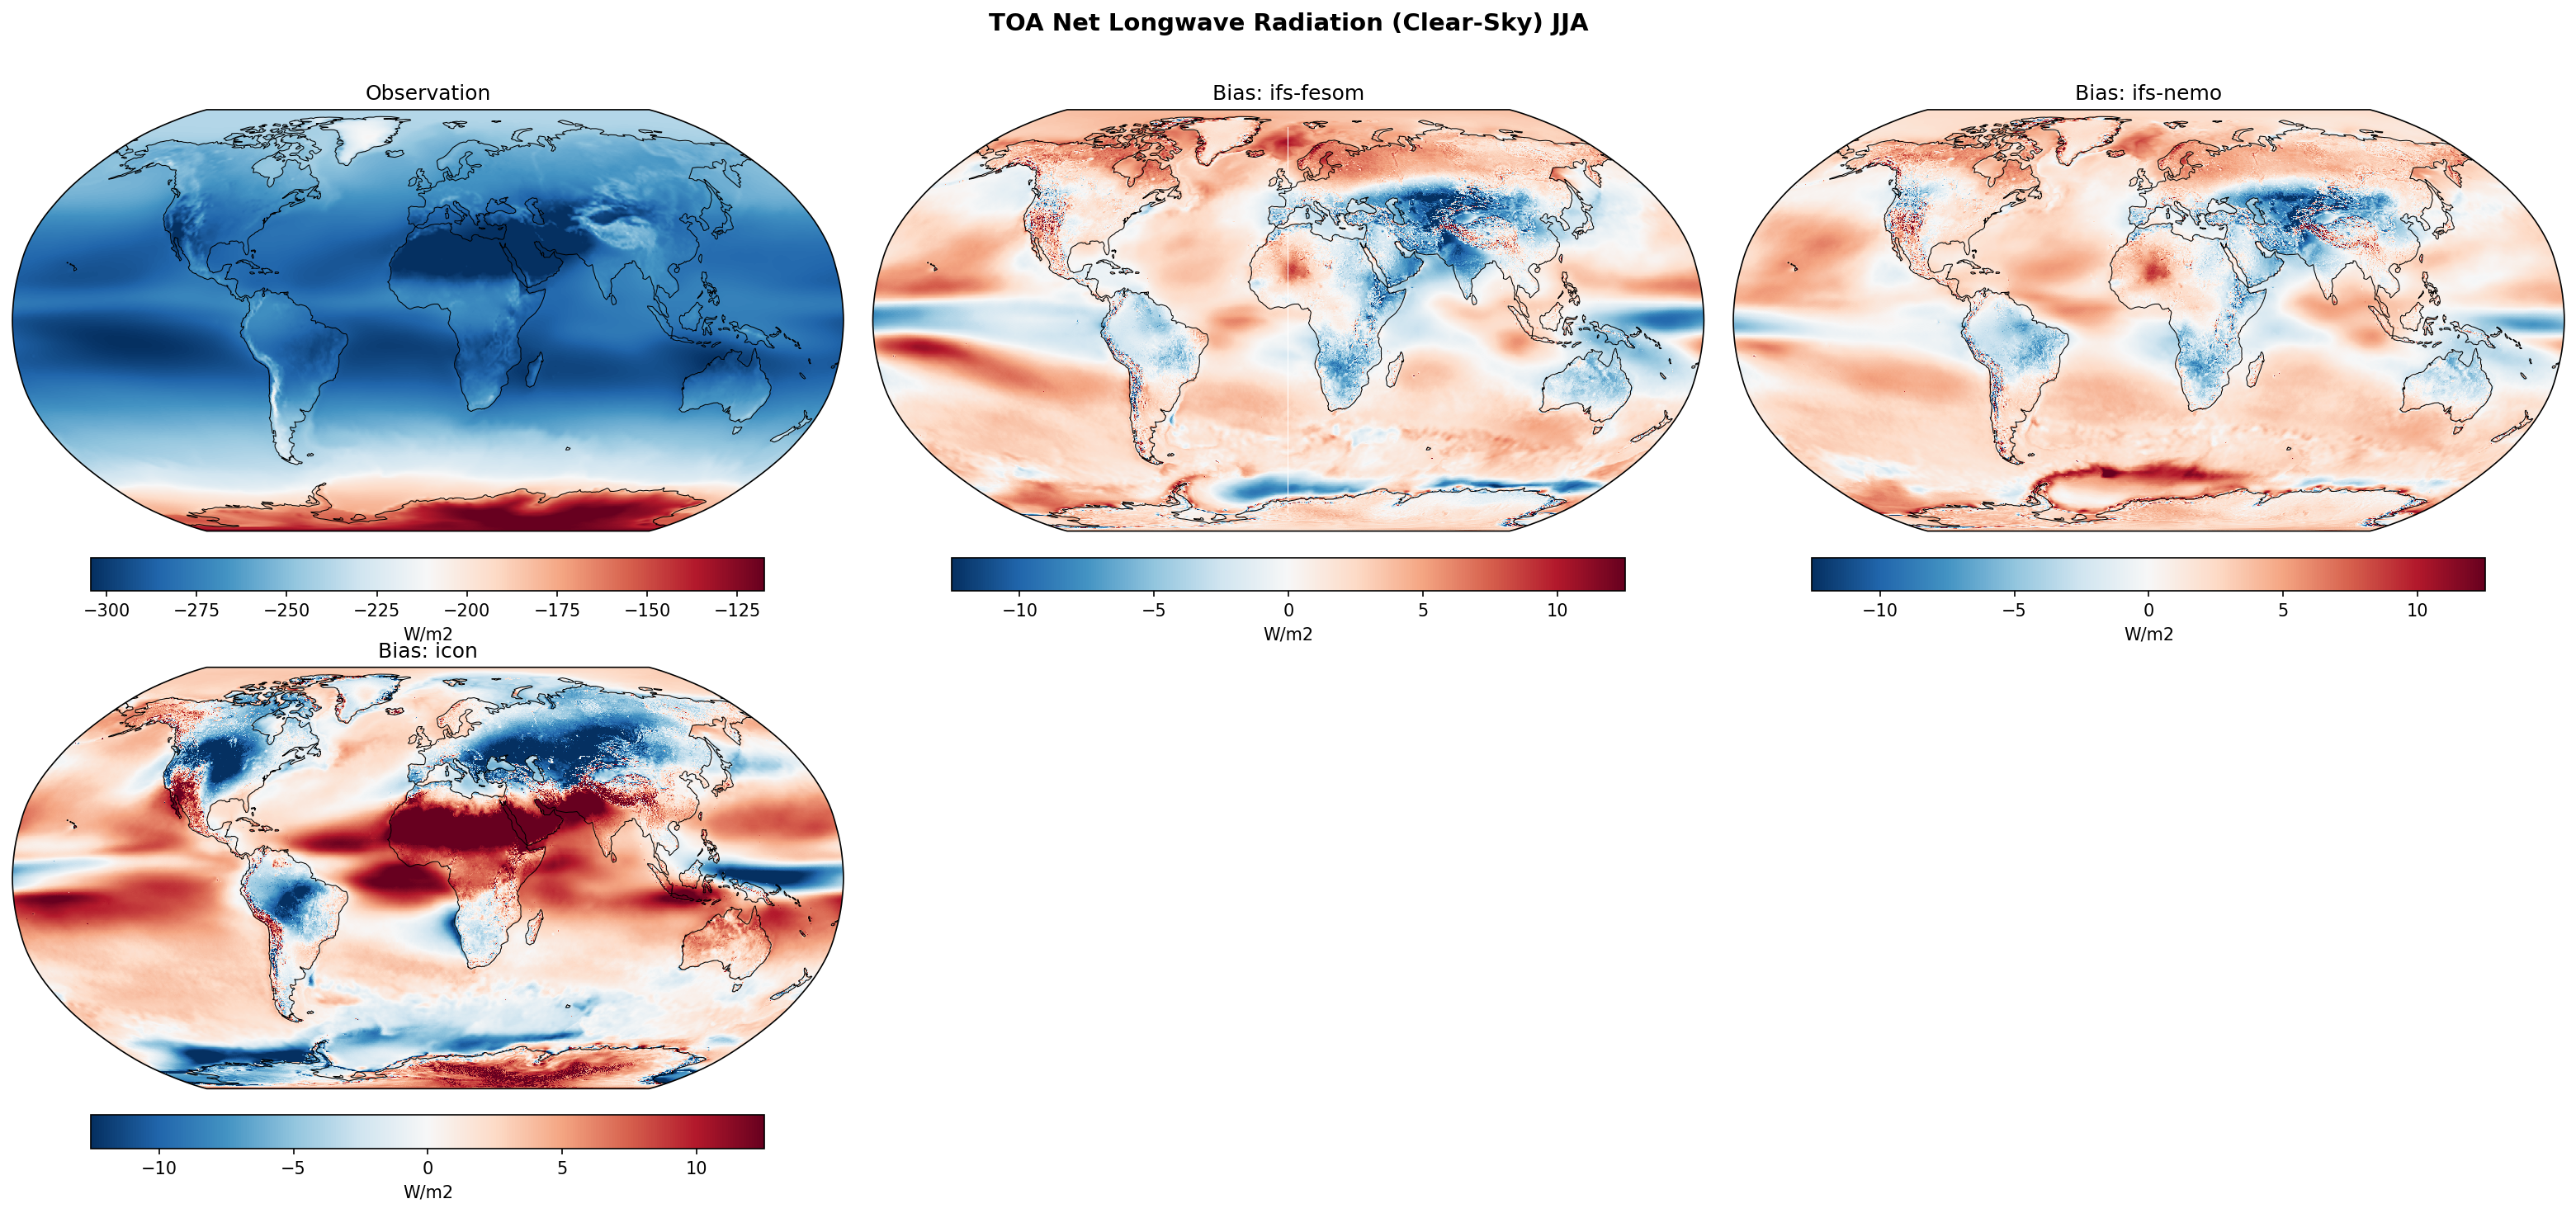
| Variables | avg_tnlwrfcs |
|---|---|
| Models | ifs-fesom, ifs-nemo, icon |
| Reference Dataset | ERA5 |
| Units | W/m2 |
| Period | 1990–2014 |
Summary high
The figure presents JJA climatology biases for clear-sky TOA net longwave radiation from three high-resolution models compared to ERA5, revealing distinct atmospheric model signatures and localized topographical effects.
Key Findings
- IFS-FESOM and IFS-NEMO share nearly identical bias patterns, indicating that the atmospheric model (IFS) dominates clear-sky longwave radiation errors, largely independent of the ocean model.
- ICON displays a distinctly different and larger-magnitude bias spatial structure, characterized by strong positive biases over subtropical deserts and tropical oceans, and negative biases over boreal landmasses.
- All three models exhibit localized negative biases (excessive outgoing radiation) over major topographic features, notably the Tibetan Plateau and the Andes.
Spatial Patterns
The IFS models show mostly moderate biases, featuring positive biases (insufficient outgoing radiation) over the Southern Ocean and eastern equatorial Pacific, alongside localized negative biases over high topography. In contrast, ICON exhibits pervasive, strong positive biases (>10 W/m2) across the Sahara, Middle East, and large swaths of the tropical oceans, contrasted by widespread negative biases across Northern Hemisphere high-latitude landmasses (Eurasia and North America).
Model Agreement
Agreement is exceptionally high between the two IFS-coupled models due to their shared atmospheric component. However, ICON diverges significantly from the IFS models in both the sign and geographical distribution of biases, highlighting fundamental differences in their atmospheric physics, land-surface interactions, or moisture transport.
Physical Interpretation
Clear-sky TOA longwave biases are primarily driven by errors in surface skin temperature and atmospheric column water vapor. Negative biases (e.g., over high topography in all models, or boreal land in ICON) indicate excessive emission to space, likely due to surface warm biases or dry atmospheric profiles. Conversely, positive biases (e.g., ICON over the Sahara, or IFS over the Pacific cold tongue) suggest cold surface biases or excessive atmospheric moisture that traps outgoing longwave radiation.
Caveats
- The reference dataset is ERA5, which relies on model assimilation for clear-sky radiative fluxes; direct comparisons with satellite-derived products like CERES EBAF would provide a more robust observational baseline.
- Clear-sky diagnostics are highly sensitive to how cloud-masking is defined and applied in both the models and the reanalysis product.
TOA Net Shortwave Radiation Annual Mean Bias
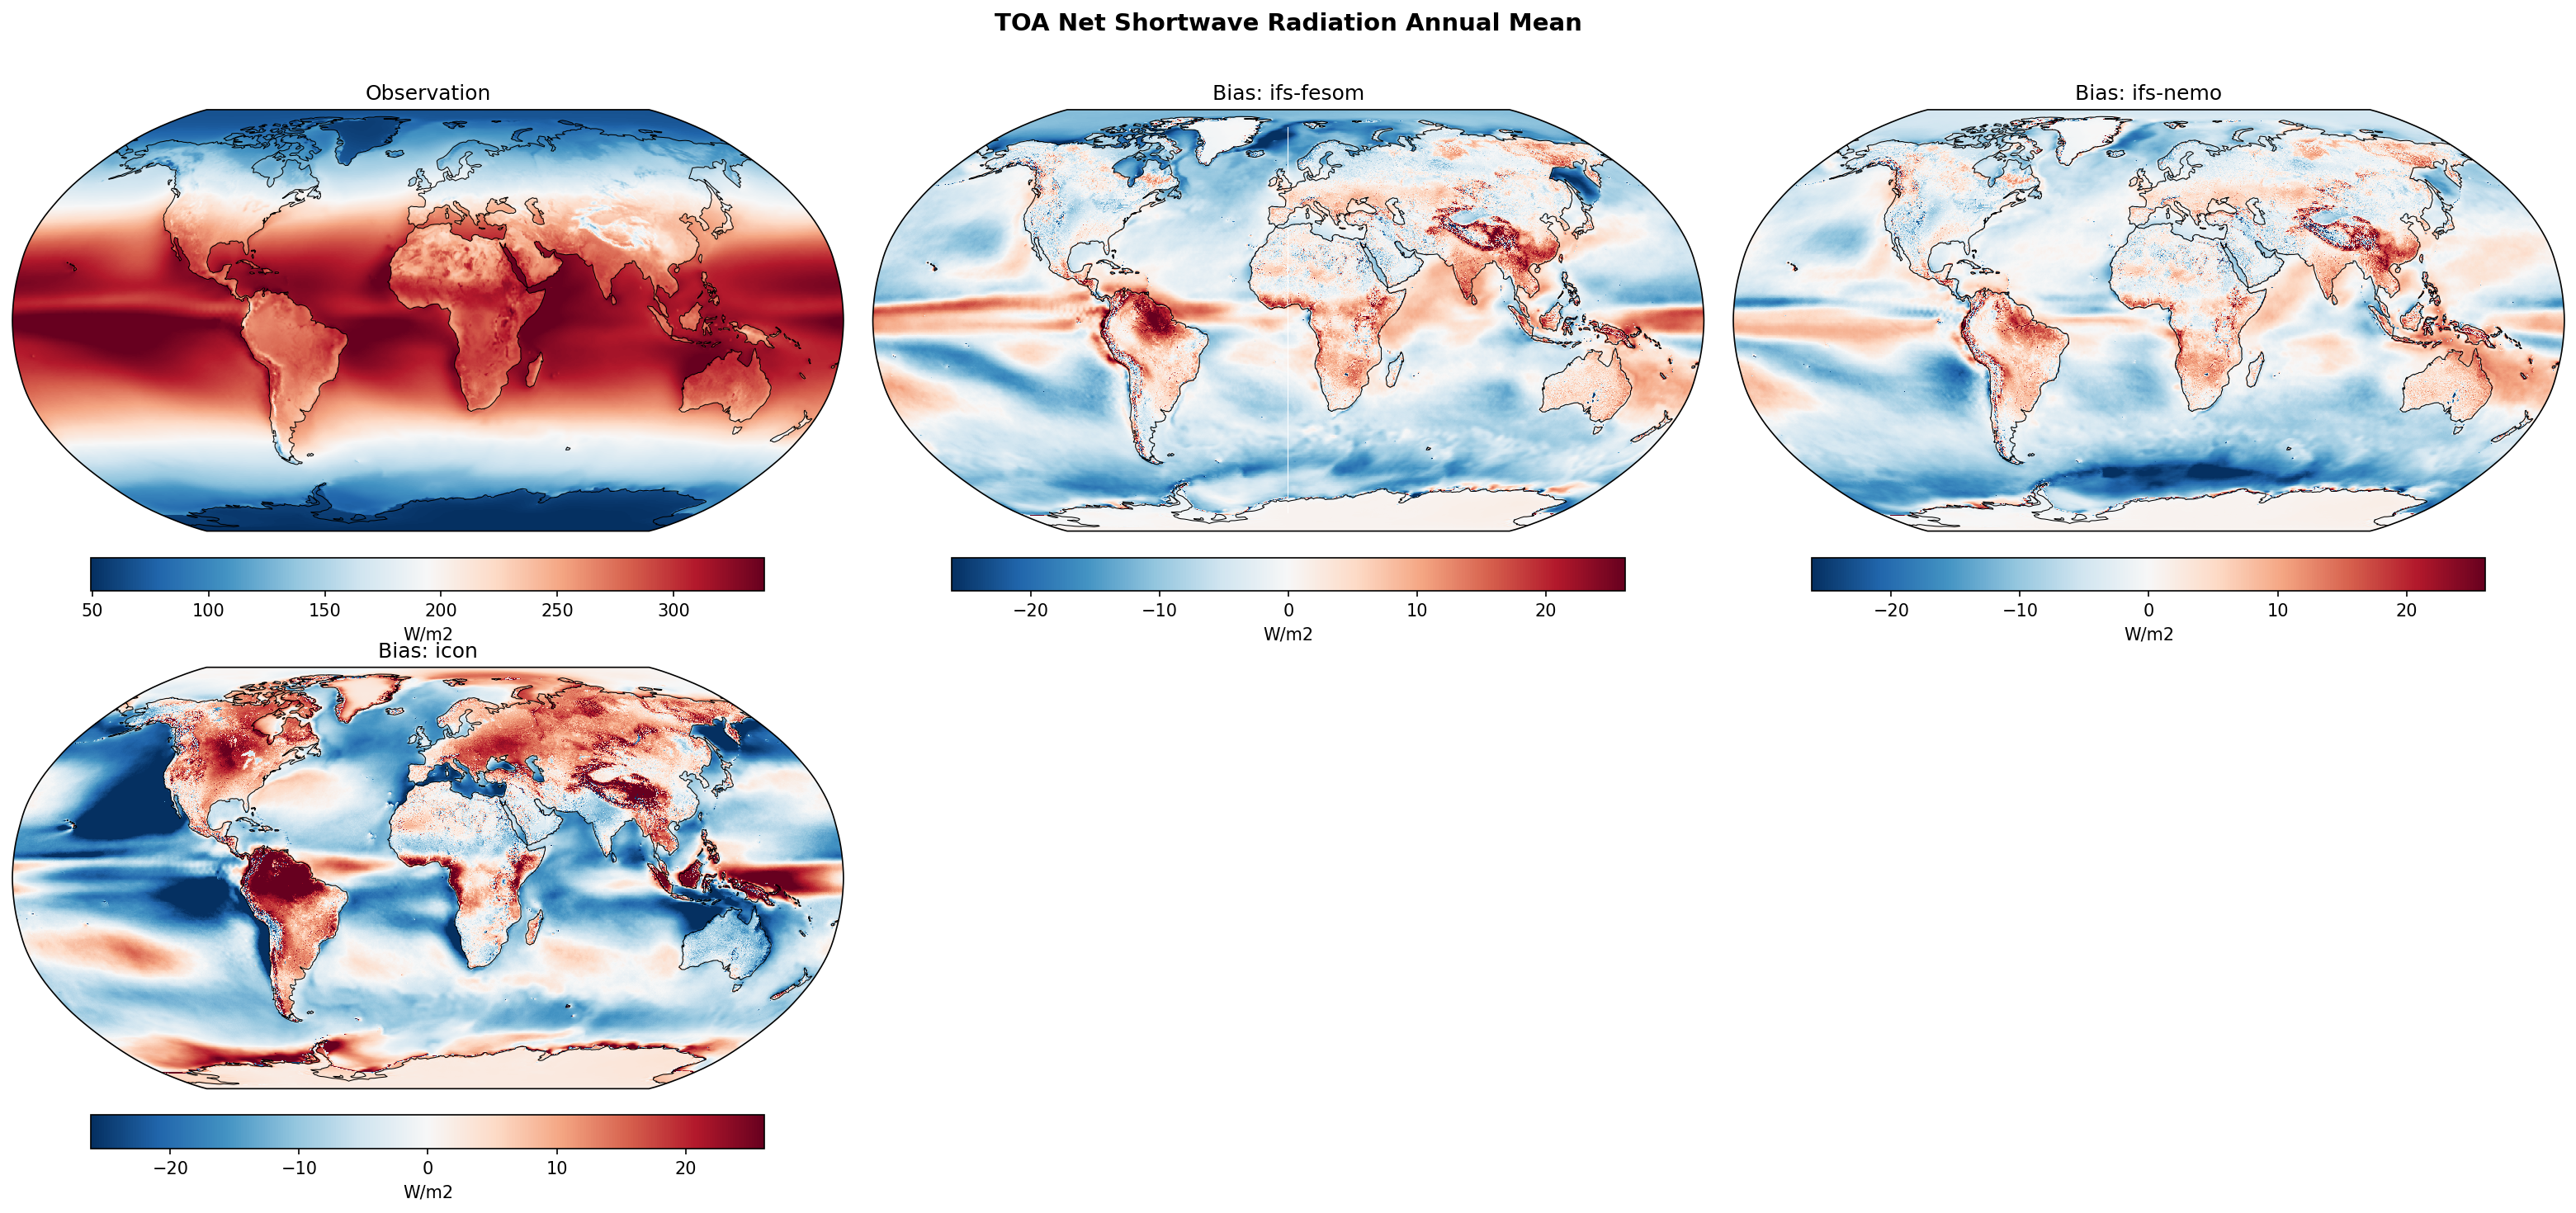
| Variables | avg_tnswrf |
|---|---|
| Models | ifs-fesom, ifs-nemo, icon |
| Reference Dataset | ERA5 |
| Units | W/m2 |
| Period | 1990–2014 |
| ifs-fesom | Global Mean Bias: -1.37 · Rmse: 8.27 |
| ifs-nemo | Global Mean Bias: -1.82 · Rmse: 7.90 |
| icon | Global Mean Bias: -3.22 · Rmse: 14.05 |
Summary high
This figure evaluates the annual mean Top of Atmosphere (TOA) Net Shortwave Radiation climatology from three high-resolution models against ERA5, revealing distinct biases related to cloud and surface albedo representation.
Key Findings
- The IFS-based models (ifs-fesom and ifs-nemo) exhibit moderate biases (RMSE ~8 W/m2) characterized by excessive reflection over marine stratocumulus regions and the Southern Ocean.
- ICON displays a severe, systematic land-sea bias dipole, with massive underestimation of TOA net SW over oceans and overestimation over most landmasses, resulting in a much higher RMSE (~14 W/m2).
- All three models share positive biases (excessive absorption) over major tropical rainforests (Amazon, Congo) and high-altitude regions like the Himalayas and Tibetan Plateau.
Spatial Patterns
IFS-FESOM and IFS-NEMO show distinct negative biases (blue) over the eastern boundary upwelling systems (SE Pacific, SE Atlantic, NE Pacific) and the Southern Ocean, alongside positive biases (red) over tropical landmasses and the equatorial Atlantic/Indian Oceans. ICON features widespread, intense negative biases across nearly all open ocean basins, sharply contrasting with severe positive biases over North America, Eurasia, and South America.
Model Agreement
IFS-FESOM and IFS-NEMO demonstrate high spatial agreement, reflecting their shared atmospheric component (IFS). In contrast, ICON strongly diverges from the IFS models, exhibiting a fundamentally different and significantly larger error structure dominated by a stark land-ocean contrast.
Physical Interpretation
Negative biases over oceans indicate excessive reflection of shortwave radiation, typically driven by an overestimation of marine low cloud fraction or optical depth. Positive biases over land and tropical forests suggest an underestimation of cloud cover (e.g., deep convection) or excessively low surface albedo. Positive biases over the Himalayas likely point to insufficient snow cover or inaccurate snow albedo parameterizations. ICON's extreme land-sea dipole suggests systemic issues in its cloud macroscopic properties or land-atmosphere coupling at this resolution.
Caveats
- ERA5 reanalysis relies on parameterized clouds and radiation, which contain inherent biases; evaluating TOA radiation against direct satellite observations like CERES EBAF would provide a more absolute baseline.
- Differences in prescribed aerosol climatologies between the models and ERA5 can significantly project onto clear-sky shortwave biases.
TOA Net Shortwave Radiation DJF Bias
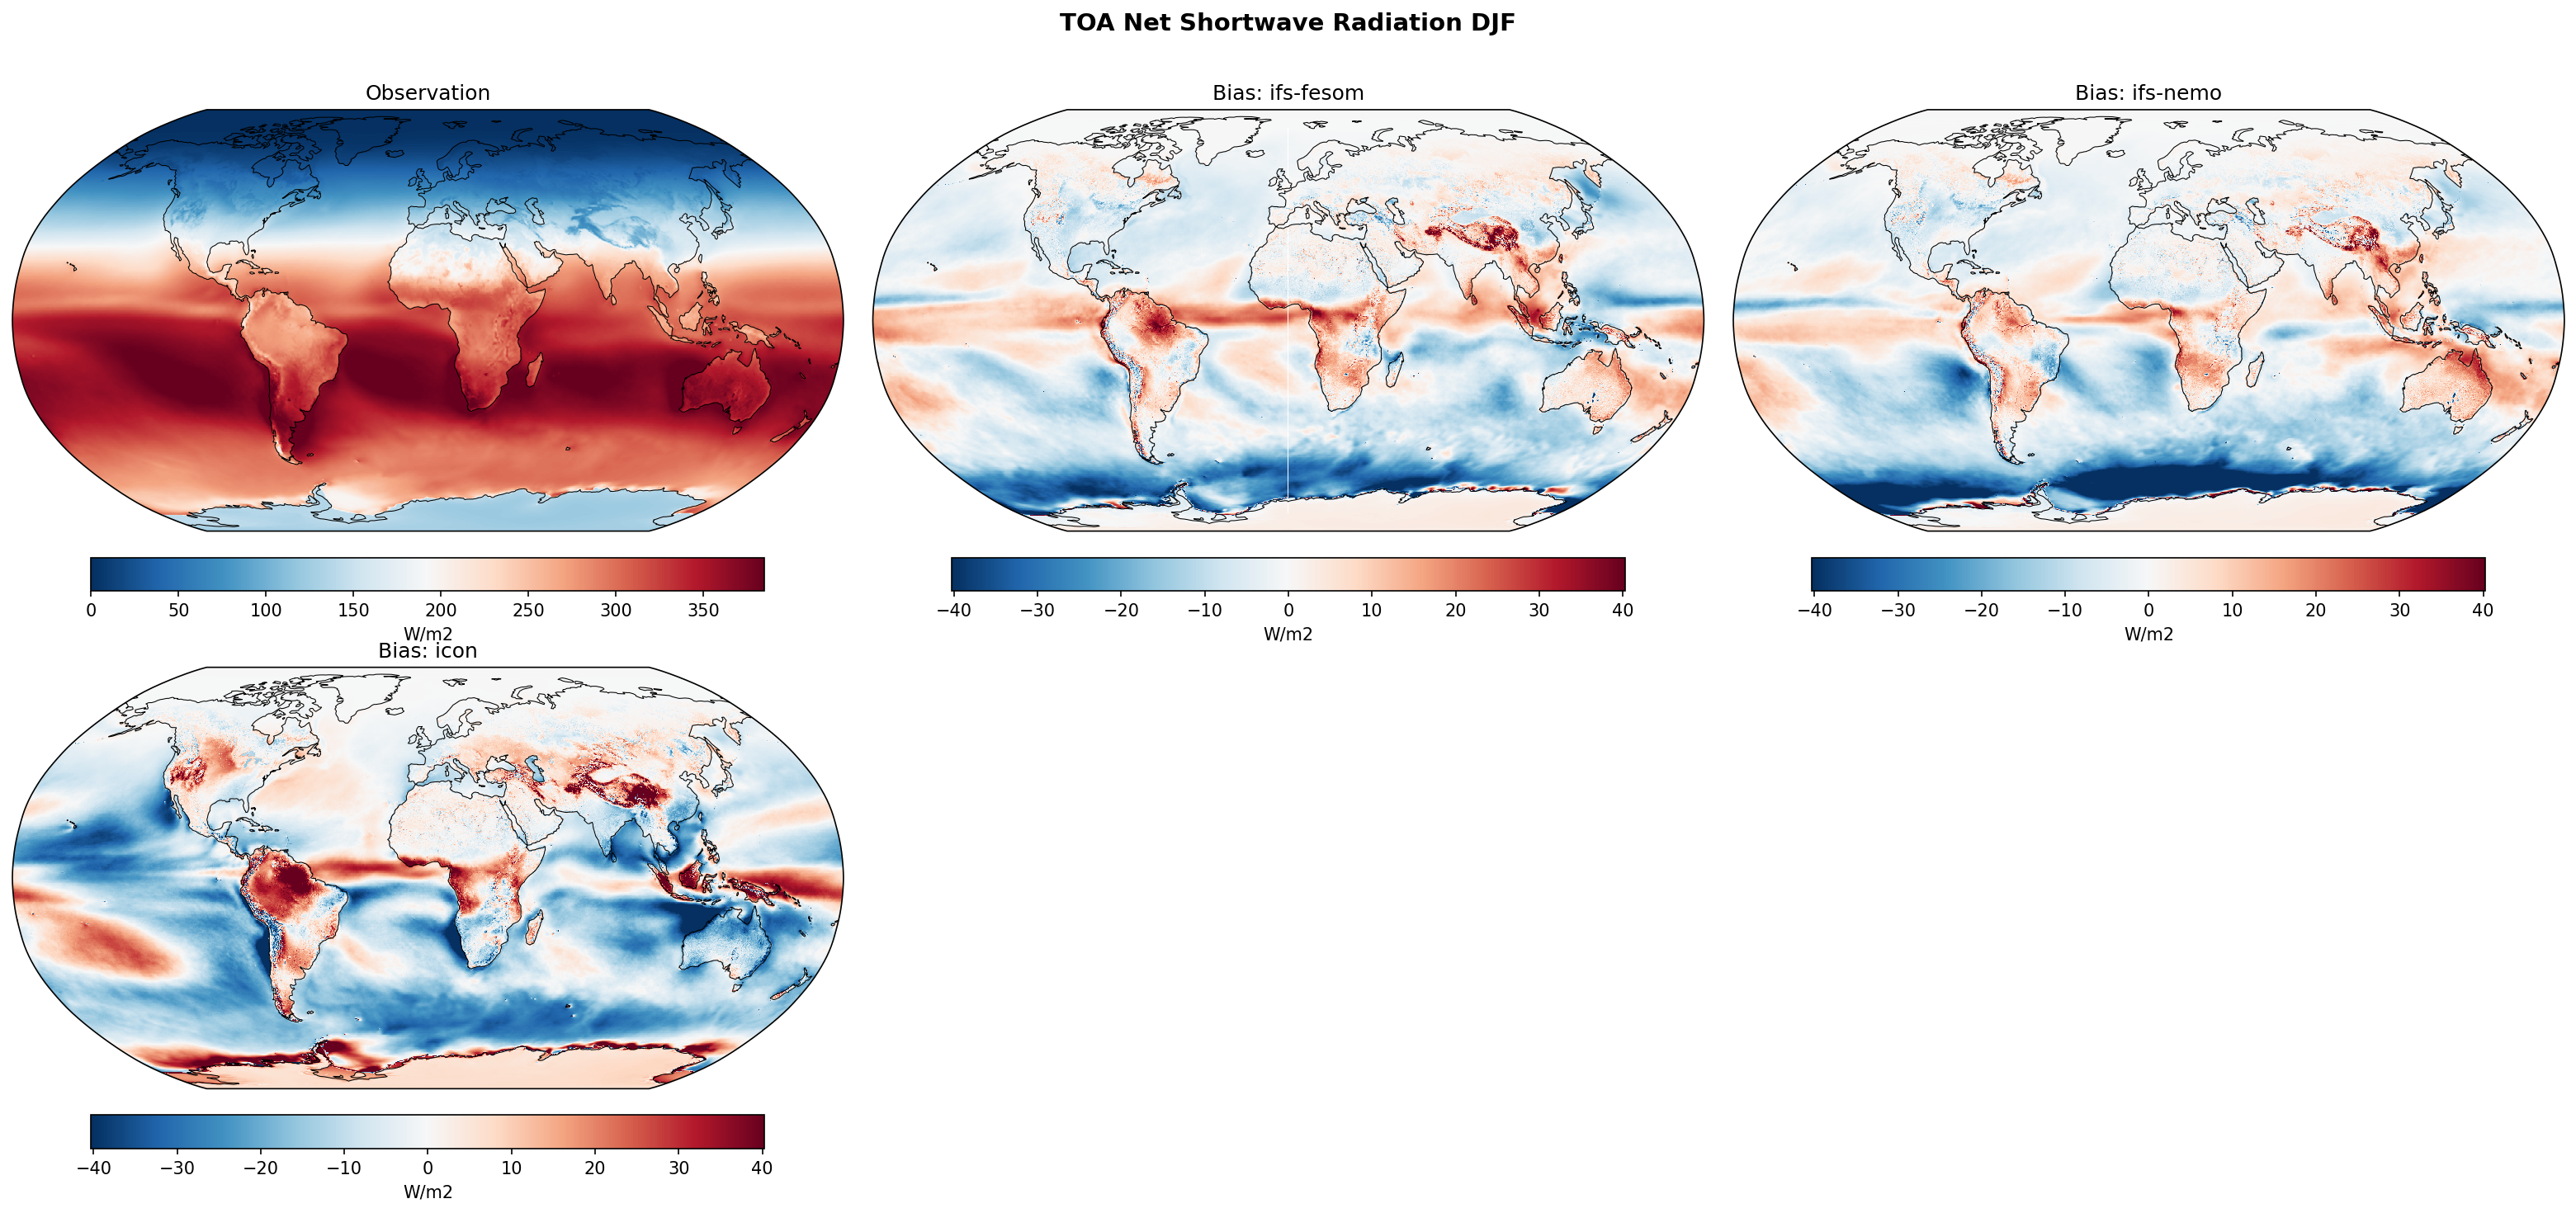
| Variables | avg_tnswrf |
|---|---|
| Models | ifs-fesom, ifs-nemo, icon |
| Reference Dataset | ERA5 |
| Units | W/m2 |
| Period | 1990–2014 |
Summary high
The figure evaluates DJF climatological biases in Top of Atmosphere (TOA) Net Shortwave Radiation for three high-resolution climate models against ERA5, highlighting systemic errors primarily driven by misrepresentations in cloud radiative effects.
Key Findings
- Systematic positive biases over marine stratocumulus regions and tropical landmasses indicate an underestimation of low cloud fraction or deep convective cloud shielding.
- A pronounced negative bias ring over the Southern Ocean (50-60°S) across all models implies excessive reflection, likely due to overly thick or extensive clouds.
- Strong localized positive biases over the Himalayas and Tibetan Plateau point to underestimated snow cover or surface albedo issues in complex terrain.
Spatial Patterns
Spatial bias patterns are dominated by a stark contrast between the tropics/subtropics and high latitudes. Positive biases (excessive solar absorption) peak in eastern boundary upwelling systems (SE Pacific, SE Atlantic) and over summer convective land regions (Amazon, Congo, Maritime Continent). Negative biases (excessive reflection) are concentrated in a continuous zonal band over the Southern Ocean and in the Northern Hemisphere storm tracks (North Pacific/Atlantic).
Model Agreement
IFS-FESOM and IFS-NEMO demonstrate high mutual agreement, reflecting their shared IFS atmospheric component. ICON shares the same broad spatial error patterns but exhibits significantly larger bias magnitudes, notably overestimating net shortwave radiation over tropical oceans and landmasses, while showing stronger negative biases in the extratropical oceans.
Physical Interpretation
Biases in TOA net shortwave are governed by planetary albedo (clouds and surface). Positive biases in marine stratocumulus zones suggest models struggle with boundary layer parameterizations, under-predicting low cloud cover. Over tropical landmasses during DJF, underrepresented convective cloud tops and anvils lead to excessive solar absorption. The negative Southern Ocean bias suggests models might be overcompensating for historical CMIP 'too few clouds' biases, resulting in overly reflective mixed-phase clouds, or potentially overestimating sea ice extent.
Caveats
- ERA5 is used as the observational reference; satellite-derived datasets like CERES-EBAF are generally considered the gold standard for evaluating TOA radiation budgets.
- Net shortwave biases represent a convolution of cloud fraction, cloud optical depth, and surface albedo errors, which cannot be explicitly disentangled without additional cloud and surface diagnostic fields.
TOA Net Shortwave Radiation JJA Bias
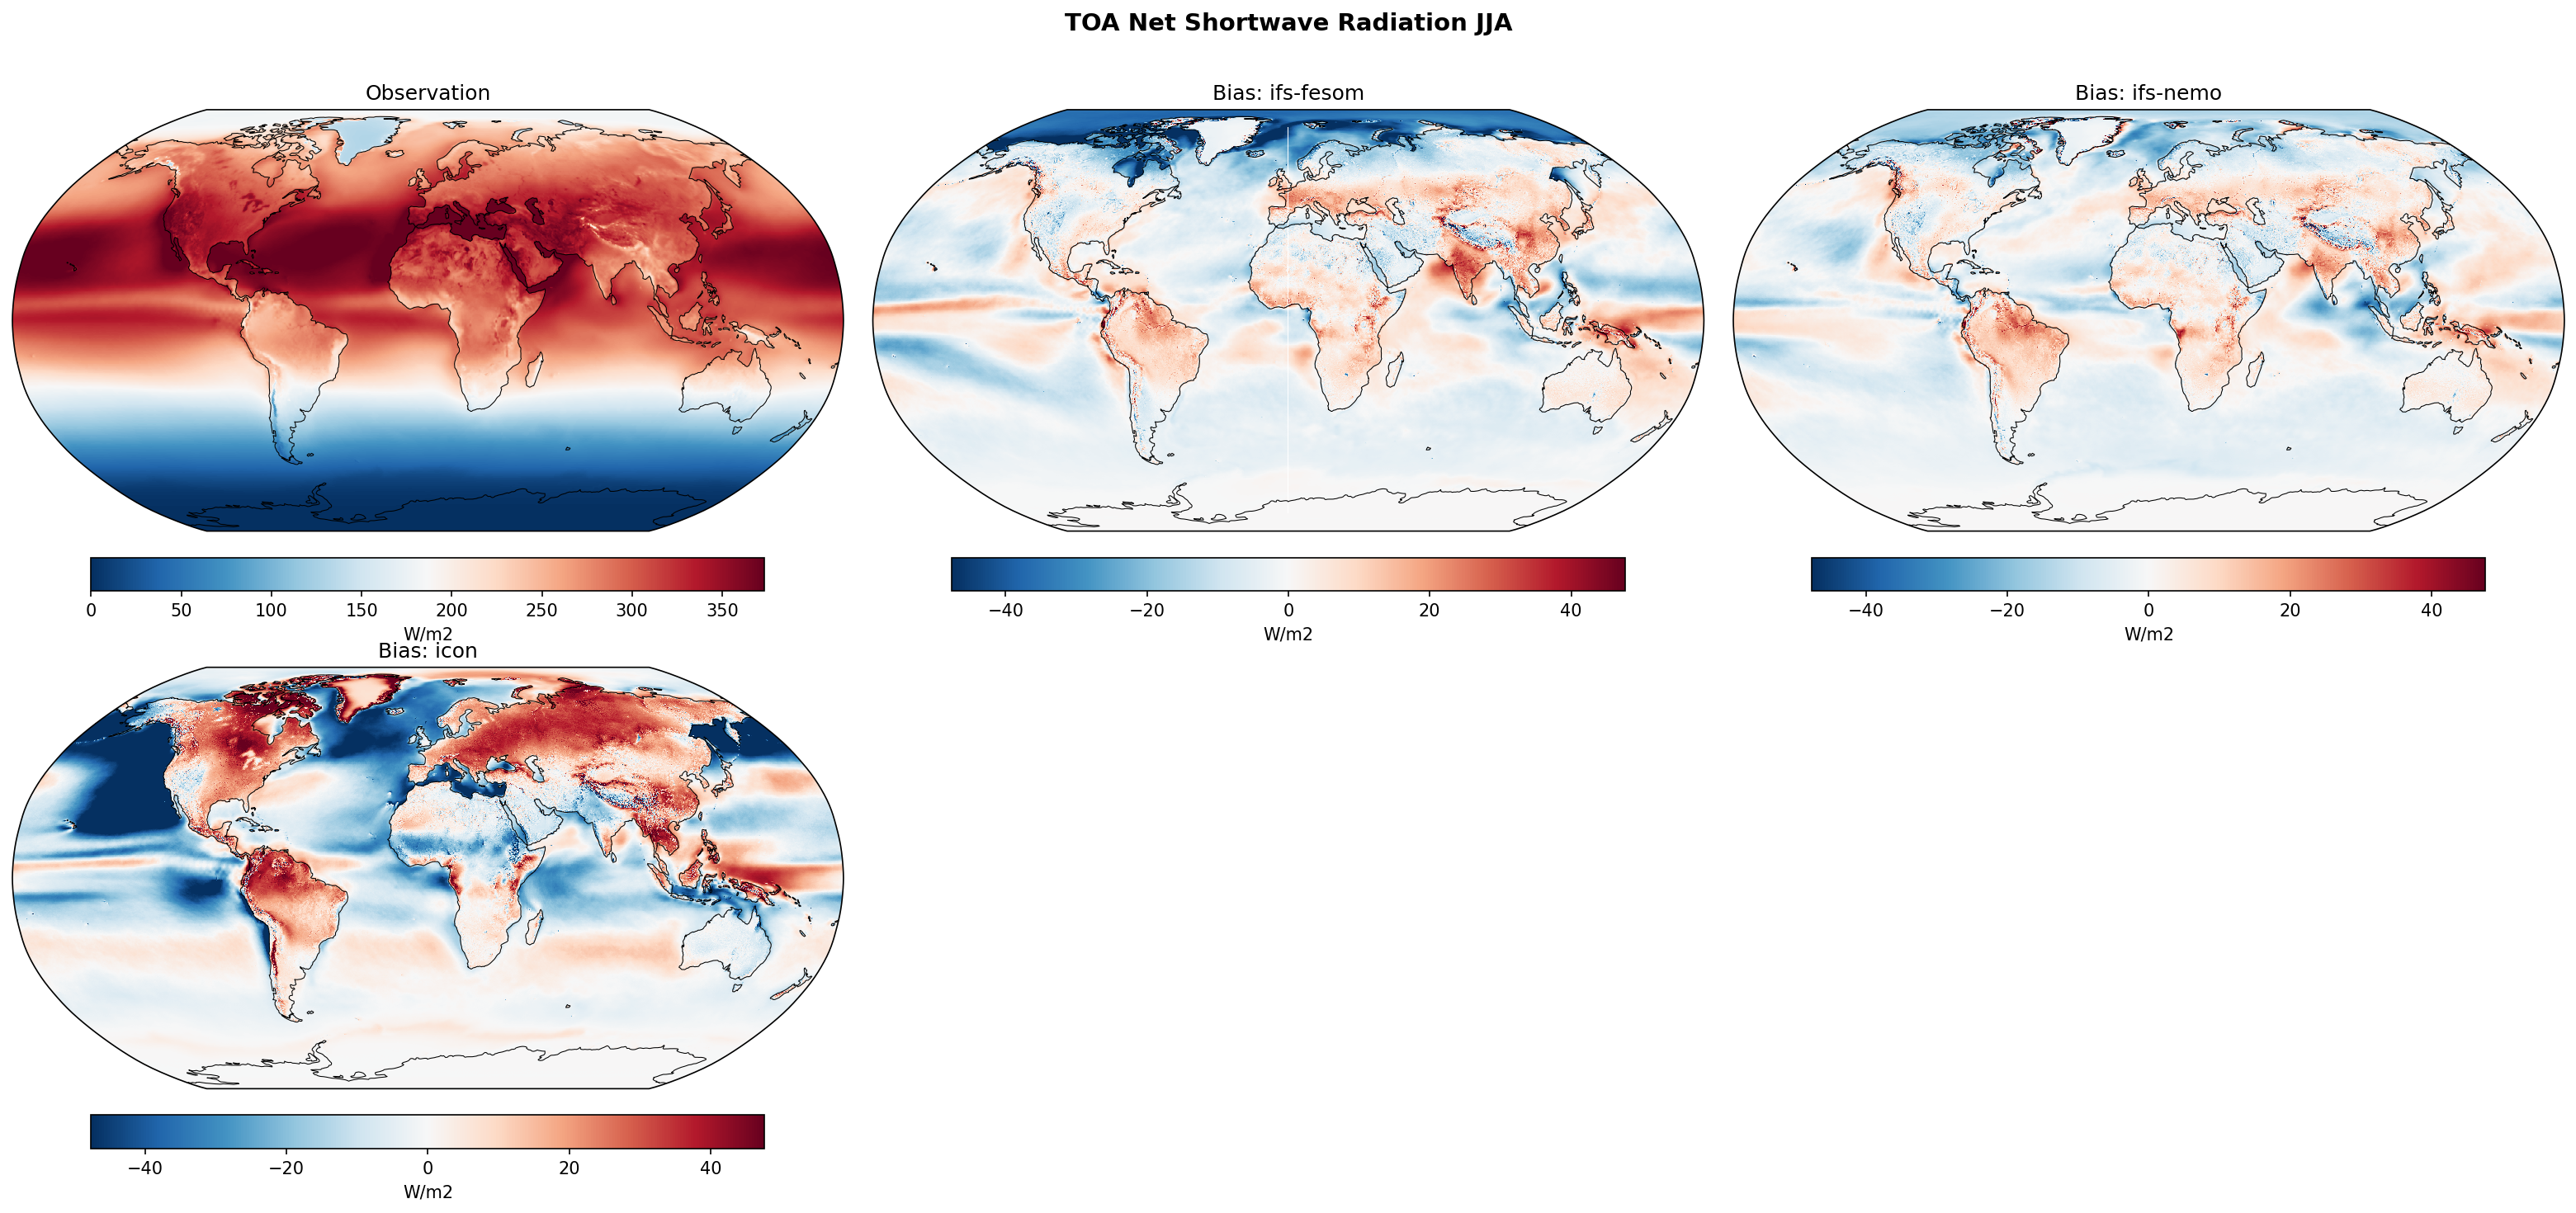
| Variables | avg_tnswrf |
|---|---|
| Models | ifs-fesom, ifs-nemo, icon |
| Reference Dataset | ERA5 |
| Units | W/m2 |
| Period | 1990–2014 |
Summary high
Global bias maps of JJA TOA Net Shortwave Radiation for three high-resolution models compared to ERA5, revealing distinct differences in model performance primarily driven by cloud radiative effects.
Key Findings
- IFS-FESOM and IFS-NEMO display similar, relatively modest bias patterns, indicating that the shared atmospheric component (IFS) dominates the TOA shortwave signal.
- ICON exhibits substantially larger biases globally, with severe positive biases over Northern Hemisphere landmasses and pronounced negative biases in tropical convective zones.
- All three models show positive biases over subtropical eastern boundary marine stratocumulus regions, reflecting a common challenge in simulating low-level clouds.
Spatial Patterns
ICON features widespread positive biases exceeding 40 W/m2 over North America, Europe, and Asia during the boreal summer, alongside strong positive biases over the Amazon and central Africa. Conversely, ICON shows deep negative biases along the ITCZ, the Southern Ocean, and the Arctic. The IFS models exhibit a much more muted bias pattern, primarily characterized by slight positive biases in marine stratocumulus decks (off Peru, Namibia, and California) and slight negative biases in the Arctic and equatorial Pacific.
Model Agreement
IFS-FESOM and IFS-NEMO agree closely with each other and show reasonable agreement with ERA5 observations. ICON diverges significantly from the IFS models and the observations, demonstrating much larger error magnitudes in both sign directions depending on the region.
Physical Interpretation
TOA net shortwave biases are heavily governed by cloud albedo and surface albedo. The strong positive biases in ICON over NH land and in all models over marine stratocumulus regions suggest an underestimation of cloud cover or optical thickness, leading to excessive absorption of solar radiation. The negative biases in the ITCZ and Southern Ocean (particularly in ICON) imply overly reflective clouds, likely due to excessive liquid water path or cloud fraction in deep convective and mid-latitude storm track regimes.
Caveats
- The baseline is ERA5 reanalysis, whose radiative fluxes are model-derived; using a direct satellite observational product like CERES-EBAF would provide a more definitive ground truth.
- This diagnostic only evaluates the JJA season; models may exhibit compensatory or entirely different bias patterns during DJF or transitional seasons.
TOA Net Shortwave Radiation (Clear-Sky) Annual Mean Bias
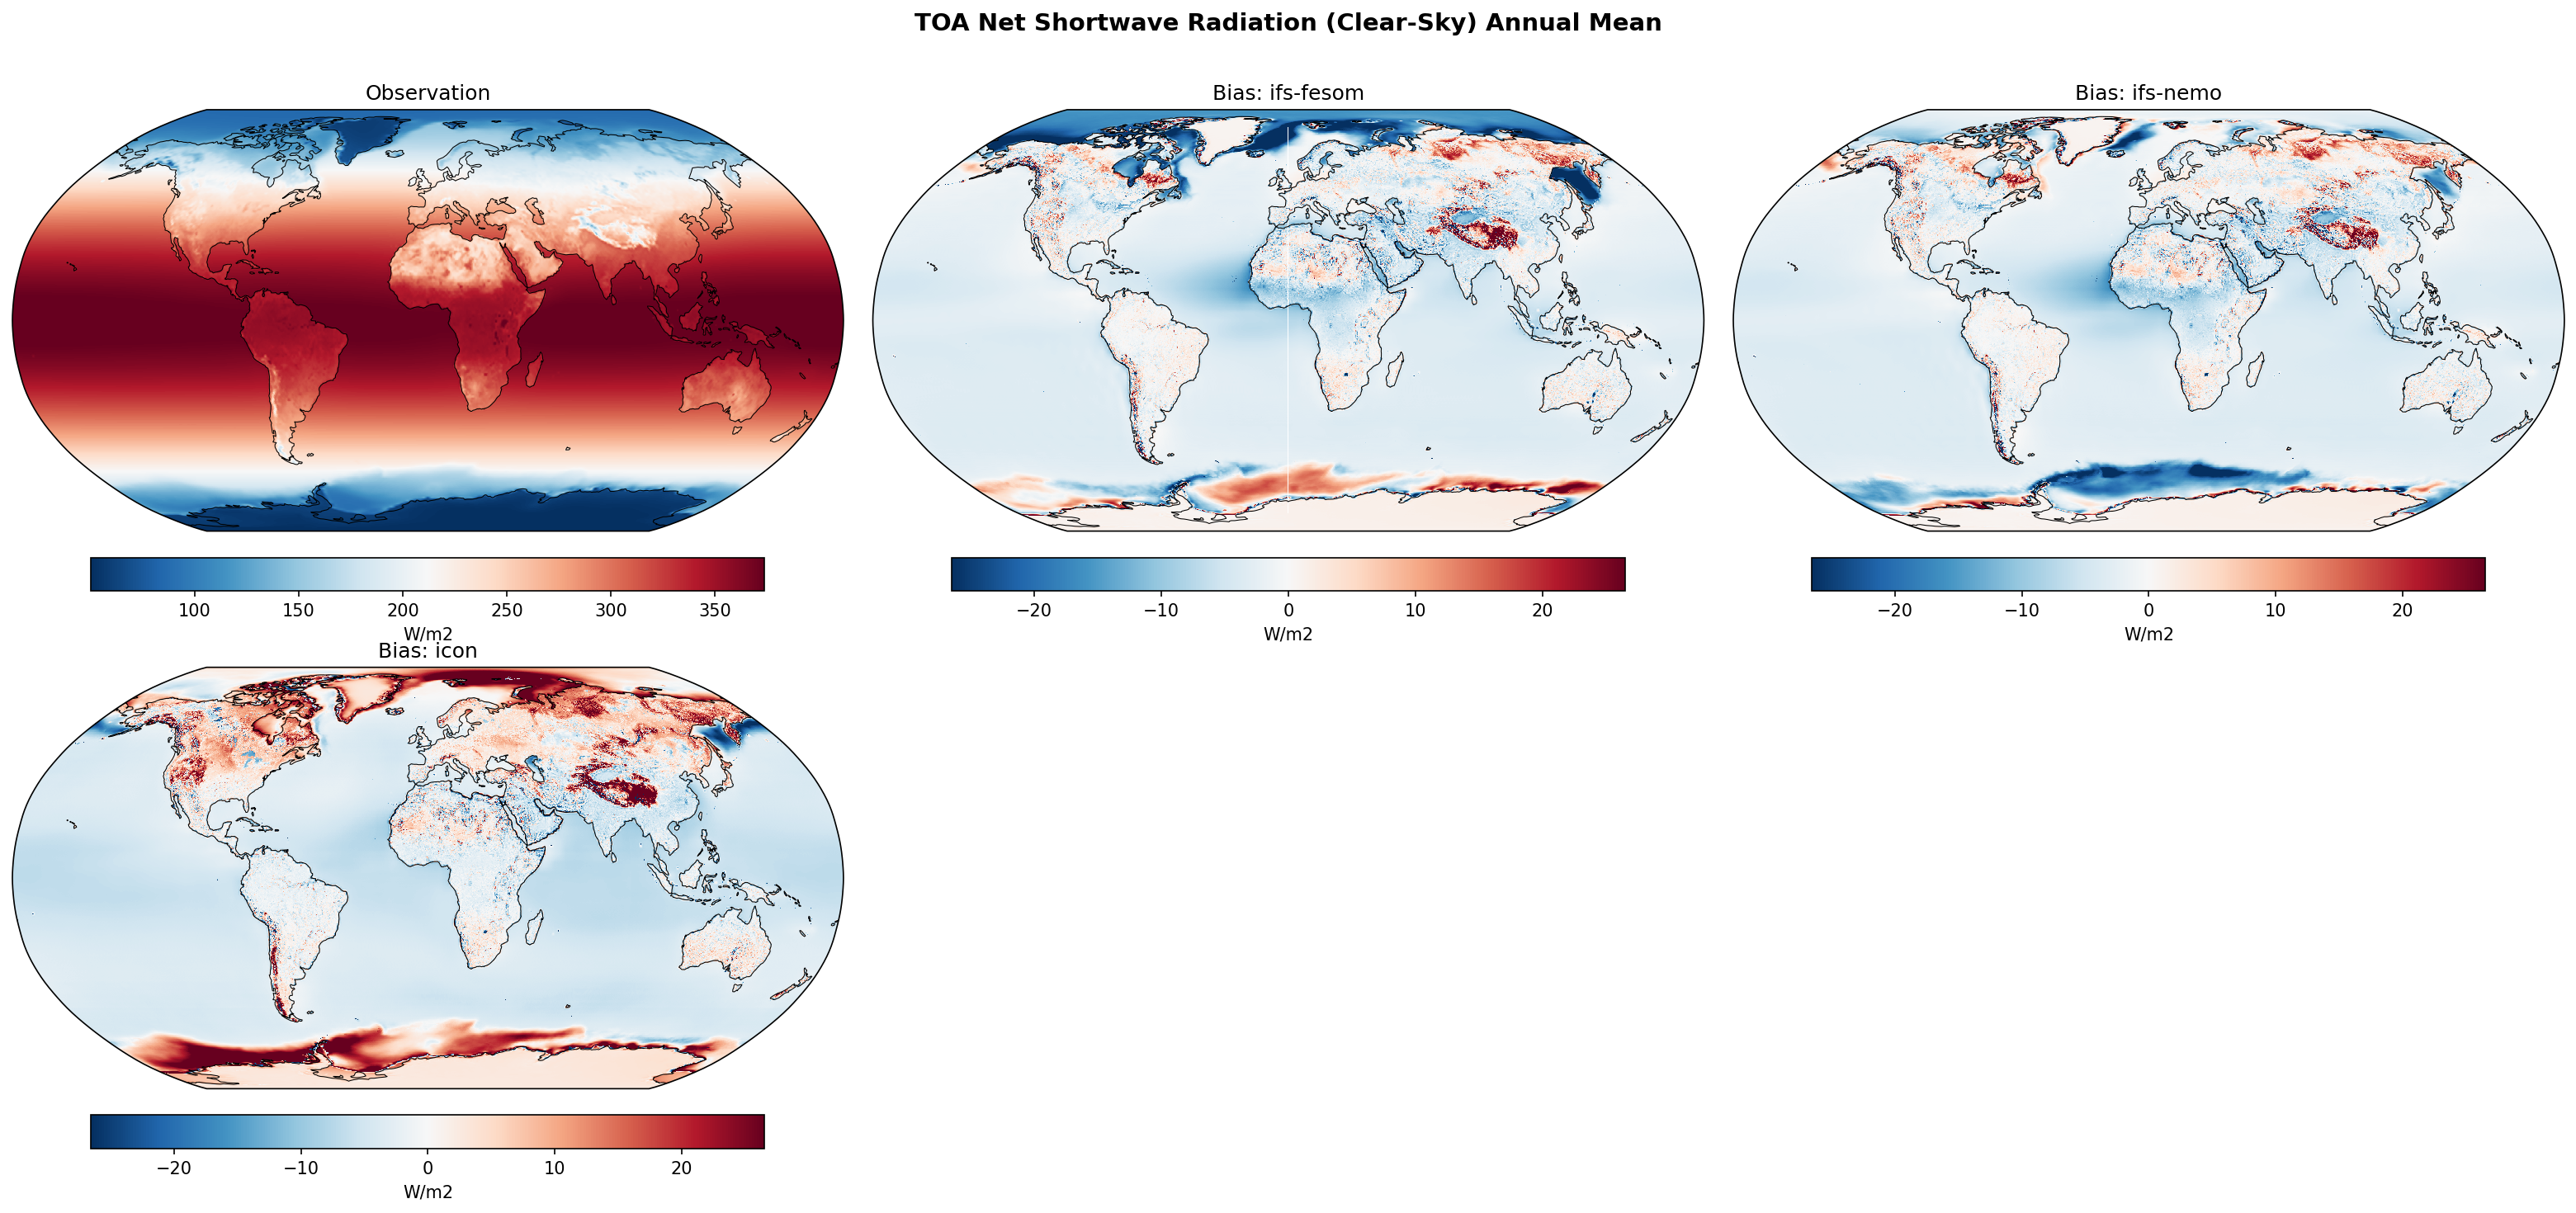
| Variables | avg_tnswrfcs |
|---|---|
| Models | ifs-fesom, ifs-nemo, icon |
| Reference Dataset | ERA5 |
| Units | W/m2 |
| Period | 1990–2014 |
| ifs-fesom | Global Mean Bias: -2.59 · Rmse: 6.99 |
| ifs-nemo | Global Mean Bias: -2.58 · Rmse: 6.31 |
| icon | Global Mean Bias: -1.31 · Rmse: 8.60 |
Summary high
The figure presents the annual mean bias of clear-sky Top-Of-Atmosphere (TOA) net shortwave radiation for three high-resolution models compared to observations, highlighting biases driven primarily by surface albedo and atmospheric aerosols.
Key Findings
- All three models exhibit a global mean negative bias (too much reflection), with IFS-FESOM and IFS-NEMO at ~ -3.0 W/m2 and ICON at -1.7 W/m2.
- Widespread negative biases are present over low- and mid-latitude oceans across all models, suggesting excessive aerosol scattering or an ocean surface that is parameterized as too reflective.
- Significant positive biases occur over snow- and ice-covered regions (Arctic, Tibetan Plateau, Rockies), indicating an underestimation of surface albedo due to missing snow or sea ice.
Spatial Patterns
A pervasive negative bias dominates the tropical and subtropical oceans, particularly in the equatorial Pacific and Atlantic. Over land, complex mixed biases are observed, with notable positive biases over the Himalayas, Tibetan Plateau, and northern high-latitude landmasses. In the polar regions, IFS-FESOM and ICON show strong positive biases along the sea-ice margins (both Arctic and Antarctic), whereas IFS-NEMO displays a distinct negative bias around the Antarctic coastline.
Model Agreement
The models agree well over the open ocean with consistent negative biases, but diverge significantly in polar regions. IFS-FESOM and ICON share positive biases over Antarctic sea ice, while IFS-NEMO shows a negative bias. ICON exhibits the lowest global mean bias but the highest RMSE (8.45 W/m2), reflecting larger, more heterogeneous regional errors, especially over land and the Arctic.
Physical Interpretation
Since these are clear-sky fluxes, biases are primarily controlled by surface albedo and atmospheric composition (aerosols and water vapor). The negative bias over dark oceans likely stems from excessive aerosol optical depth (e.g., sea salt or dust) or minor errors in the ocean albedo parameterization. Positive biases over mountains and high latitudes strongly suggest too little reflection, which points to deficits in snow cover extent, premature snowmelt, or insufficient sea-ice concentration/albedo.
Caveats
- Clear-sky radiation diagnostics are highly sensitive to the method used to define 'clear-sky' conditions in both the models and the observational retrieval.
- Observational uncertainties in polar surface albedo and aerosol distributions over oceans may contribute to the apparent biases.
TOA Net Shortwave Radiation (Clear-Sky) DJF Bias
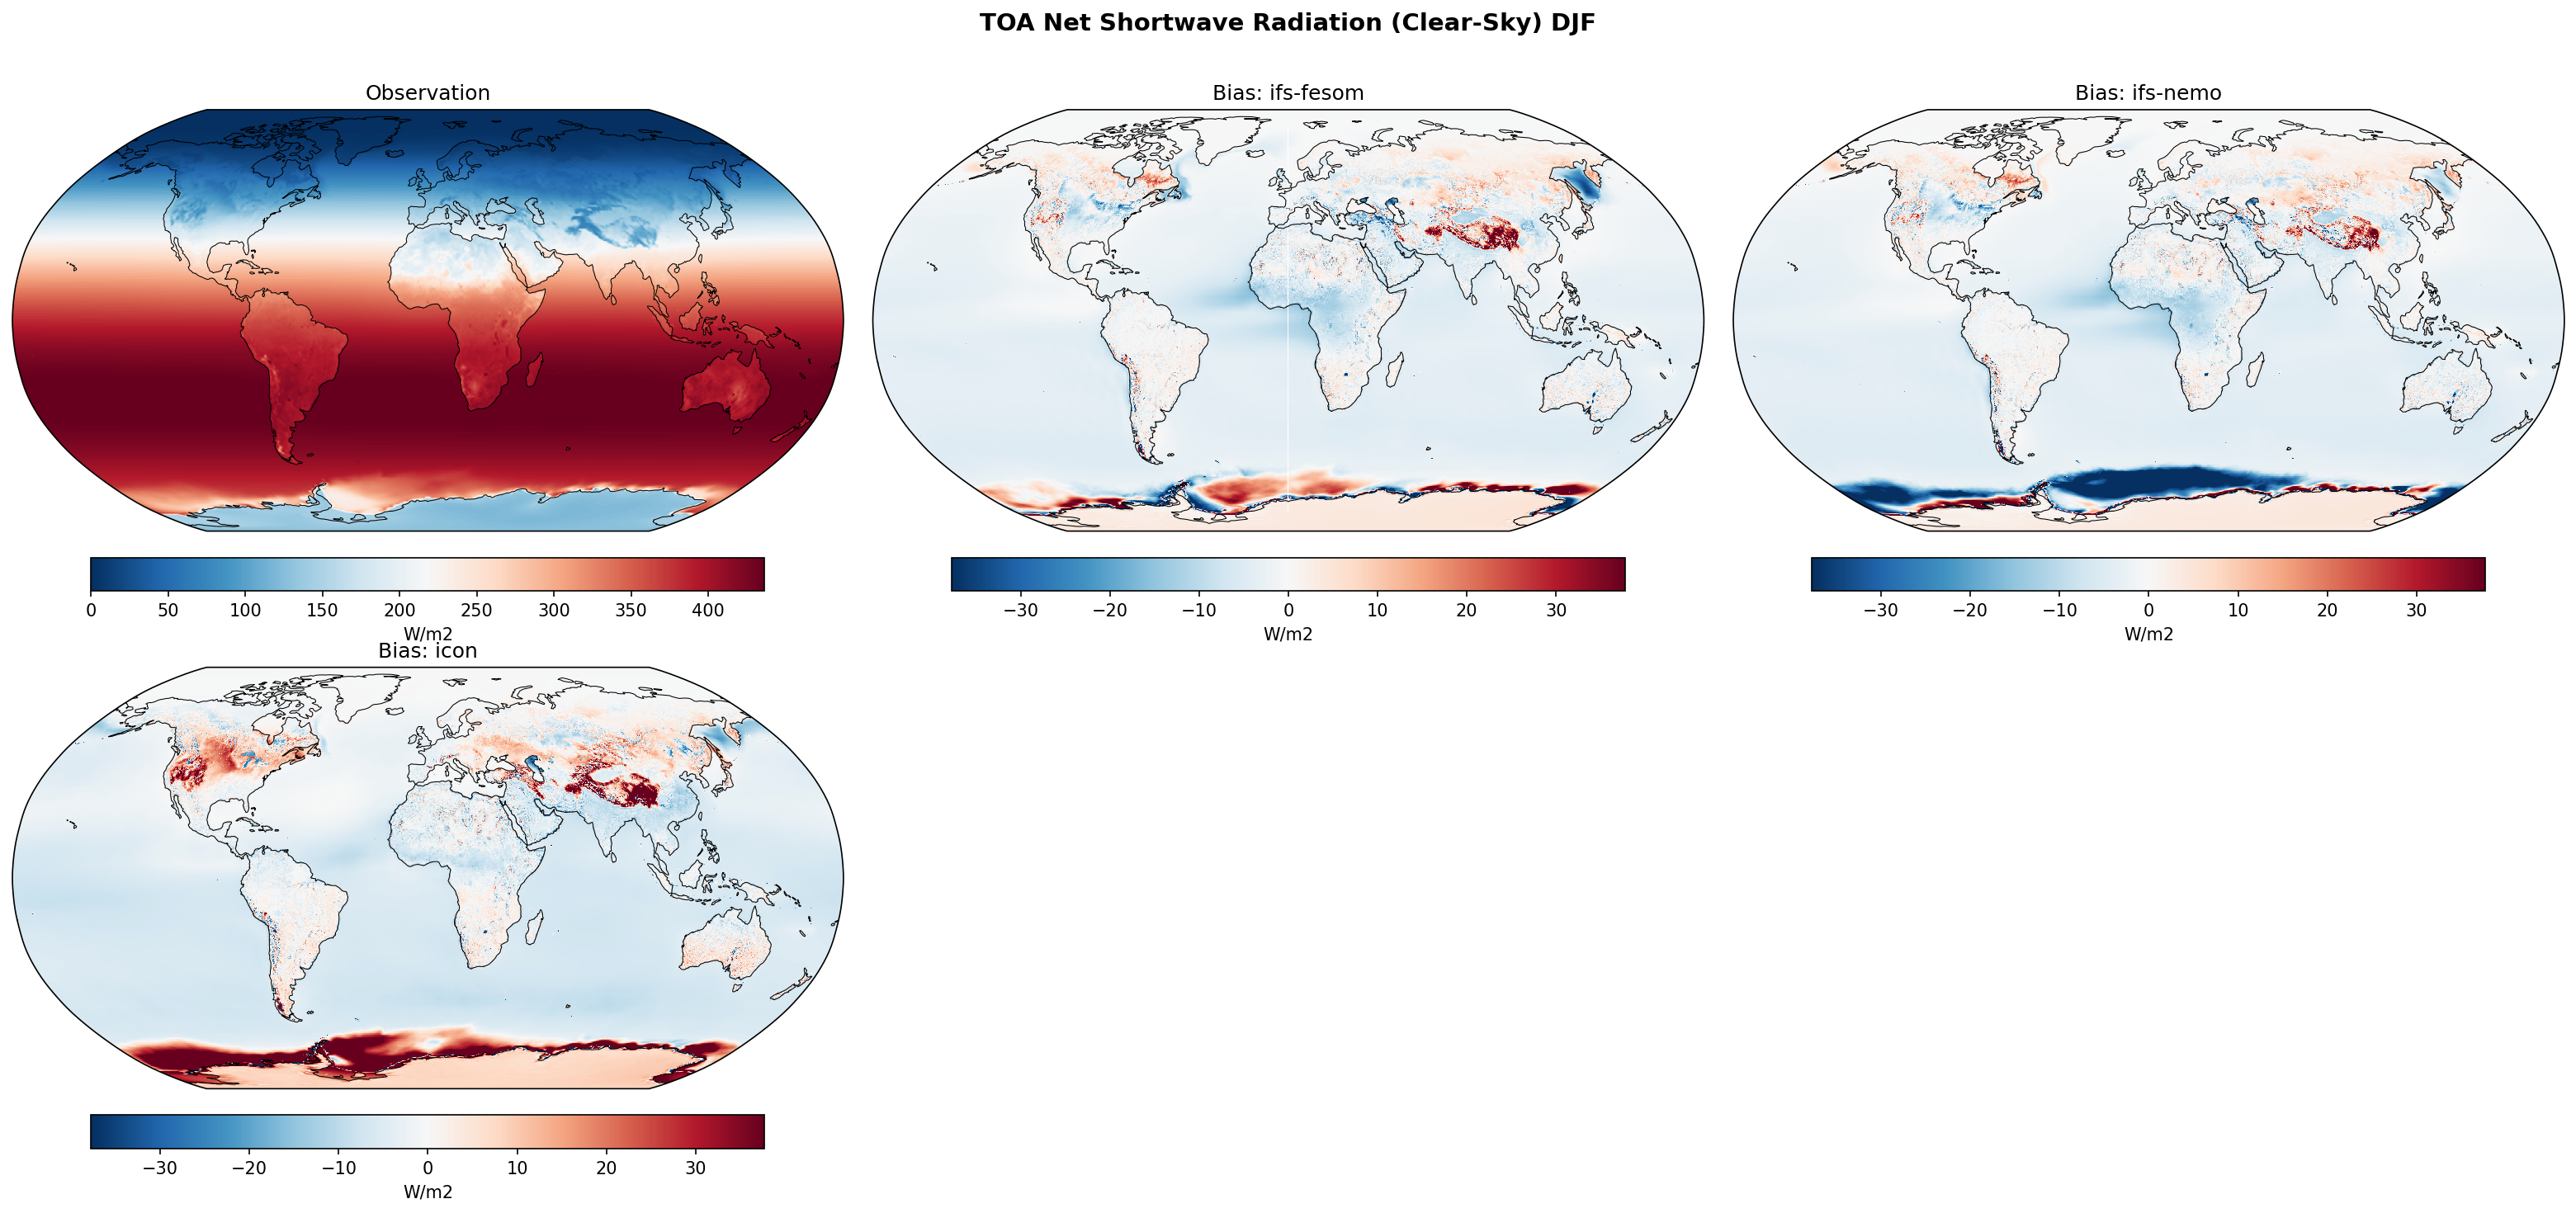
| Variables | avg_tnswrfcs |
|---|---|
| Models | ifs-fesom, ifs-nemo, icon |
| Reference Dataset | ERA5 |
| Units | W/m2 |
| Period | 1990–2014 |
Summary high
The figure evaluates the DJF climatological biases in Top of Atmosphere (TOA) clear-sky net shortwave radiation for three high-resolution models compared to ERA5, highlighting dominant biases over surface snow and sea-ice regions.
Key Findings
- All three models exhibit pronounced positive biases (excessive absorption) over Northern Hemisphere snow-covered regions, particularly North America, Siberia, and the Tibetan Plateau.
- Inter-model disagreement is strongest over the Southern Ocean sea ice zone, where ifs-nemo shows a massive negative bias, while ifs-fesom and icon display large positive biases.
- Over ice-free global oceans, all models share a consistent, albeit modest, negative bias (-5 to -15 W/m2), indicating slightly too much reflection.
Spatial Patterns
Large positive bias anomalies (>30 W/m2) are tightly confined to high-albedo terrestrial surfaces in the Northern Hemisphere (boreal forests, tundra, Himalayas). In the Southern Hemisphere summer, intense bias bands trace the Antarctic coastline and sea ice edge, varying sharply in sign between models. Equatorial and mid-latitude oceans feature weak, spatially uniform negative biases.
Model Agreement
Models agree well on the spatial structure and sign of biases over the global oceans and Northern Hemisphere land. However, they diverge completely around Antarctica; since ifs-fesom and ifs-nemo share the same atmosphere, this massive discrepancy is directly attributable to their distinct ocean/sea-ice components (FESOM vs. NEMO).
Physical Interpretation
Because the diagnostic isolates clear-sky conditions, TOA shortwave biases are overwhelmingly driven by surface albedo parameterizations and atmospheric aerosols. Positive biases over NH land suggest the models underestimate snow cover, underestimate snow albedo, or overestimate snow-masking by vegetation. Around Antarctica, the negative bias in ifs-nemo implies excessive summer sea ice extent or anomalously high sea ice albedo, whereas ifs-fesom and icon likely melt too much ice or possess sea ice that is too dark.
Caveats
- ERA5 clear-sky radiative fluxes rely on the reanalysis model's own surface albedo and aerosol assumptions, meaning observational uncertainty is elevated over complex terrain and polar regions.
- Differences in how clear-sky conditions are calculated or sampled (e.g., aerosol climatologies vs. prognostic aerosols) between the models and ERA5 can project onto these biases.
TOA Net Shortwave Radiation (Clear-Sky) JJA Bias
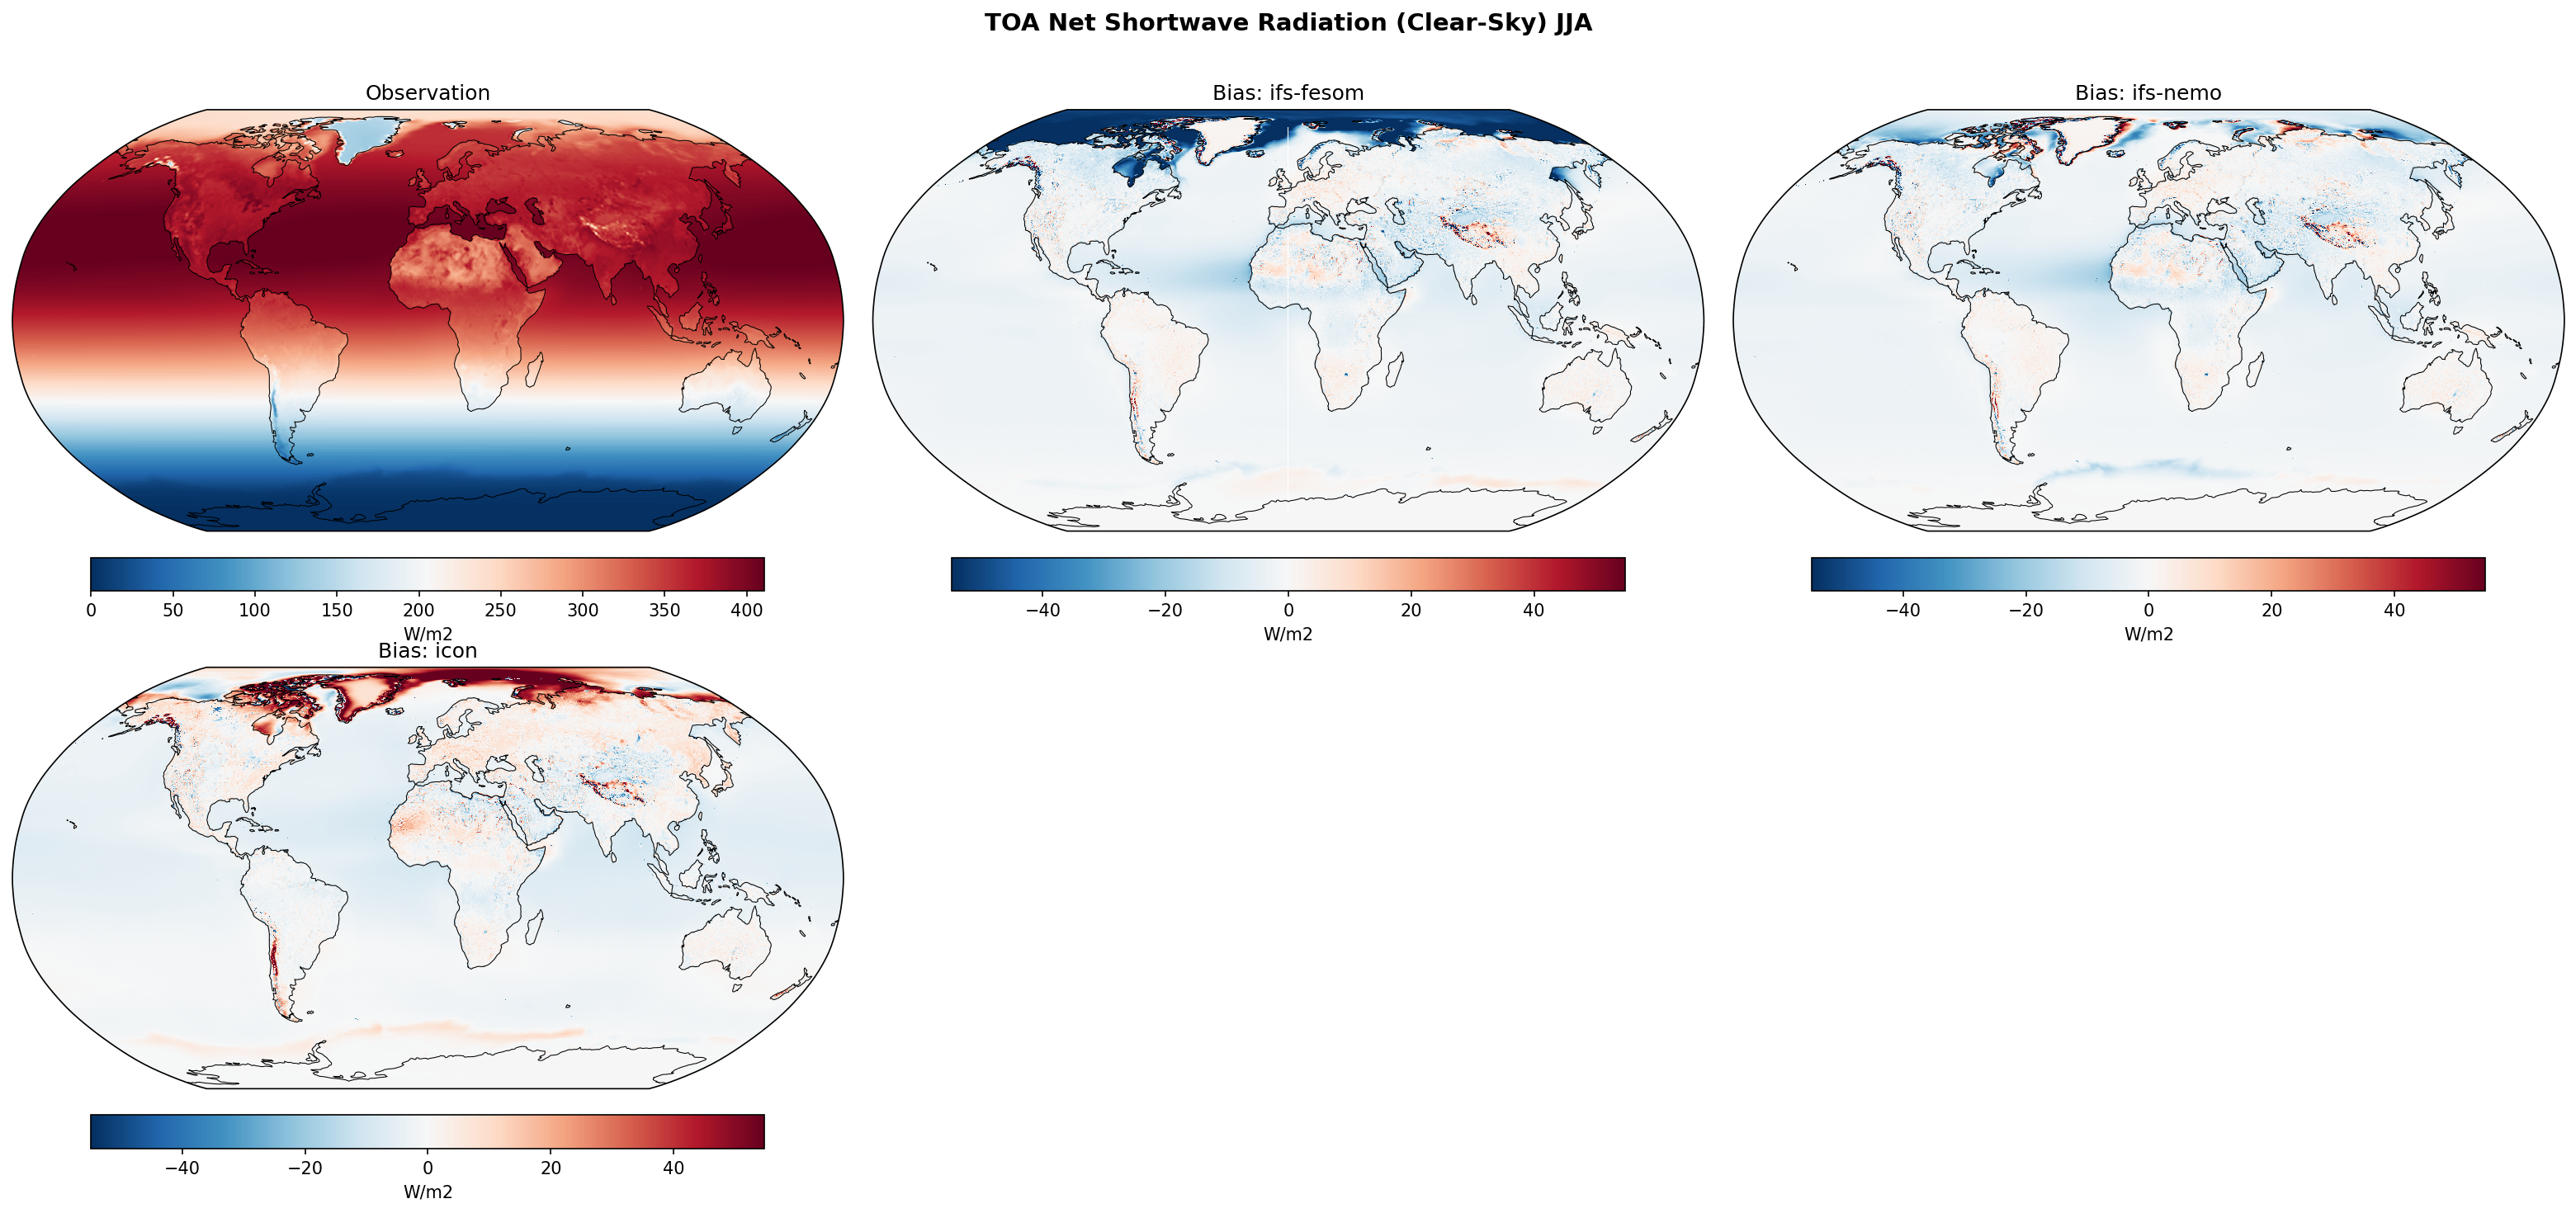
| Variables | avg_tnswrfcs |
|---|---|
| Models | ifs-fesom, ifs-nemo, icon |
| Reference Dataset | ERA5 |
| Units | W/m2 |
| Period | 1990–2014 |
Summary high
Global bias maps of JJA TOA Net Shortwave Radiation (Clear-Sky) reveal contrasting model performance in polar regions, with IFS models showing negative biases and ICON showing positive biases over the Arctic.
Key Findings
- IFS-FESOM and IFS-NEMO exhibit strong negative biases over the Arctic Ocean, implying overestimated sea ice or snow albedo.
- ICON displays a contrasting strong positive bias over the Arctic and Greenland, suggesting underestimated surface albedo or insufficient summer snow/ice cover.
- All three models share a ubiquitous, slight negative bias over the global oceans, potentially pointing to common issues in clear-sky aerosol scattering or ocean albedo parameterizations.
Spatial Patterns
The most prominent biases are localized in the Northern Hemisphere high latitudes, corresponding to maximum JJA insolation. IFS-FESOM and IFS-NEMO show widespread negative biases (exceeding -40 W/m2) across the Arctic basin. Conversely, ICON exhibits strong positive biases (>40 W/m2) over the Arctic Ocean and the Greenland ice sheet. Over the global oceans between 60°S and 60°N, all models show a homogenous, weak negative bias. Small positive biases are visible over arid regions like the Sahara in the IFS models, and over the Himalayas/Andes in ICON.
Model Agreement
Models demonstrate broad agreement over low- and mid-latitude oceans, consistently exhibiting small negative biases. However, there is stark inter-model disagreement in the Arctic and over Greenland, where the IFS-coupled models deviate negatively from ERA5, while ICON deviates positively.
Physical Interpretation
Clear-sky TOA net shortwave radiation is predominantly governed by surface albedo and atmospheric scattering (e.g., by aerosols) in the absence of clouds. In JJA, the severe negative biases in IFS models over the Arctic indicate surface albedos that are too high, likely due to excessive sea-ice concentration or delayed snowmelt on ice. The strong positive biases in ICON imply premature snowmelt or insufficient sea ice, leading to anomalously low surface albedo and excessive shortwave absorption. The pervasive weak negative bias over ice-free oceans across all models could be driven by an overestimation of atmospheric scattering, possibly due to high aerosol optical depths.
Caveats
- Clear-sky diagnostics depend heavily on accurate cloud-masking algorithms; differences between model and ERA5 clear-sky definitions can introduce artifacts, particularly in the highly cloudy summer Arctic.
- ERA5 is used as the observational reference, but its representation of sea-ice and snow albedo contains uncertainties and may differ from direct satellite-derived radiative fluxes such as CERES.
Total Precipitation Rate Annual Mean Bias
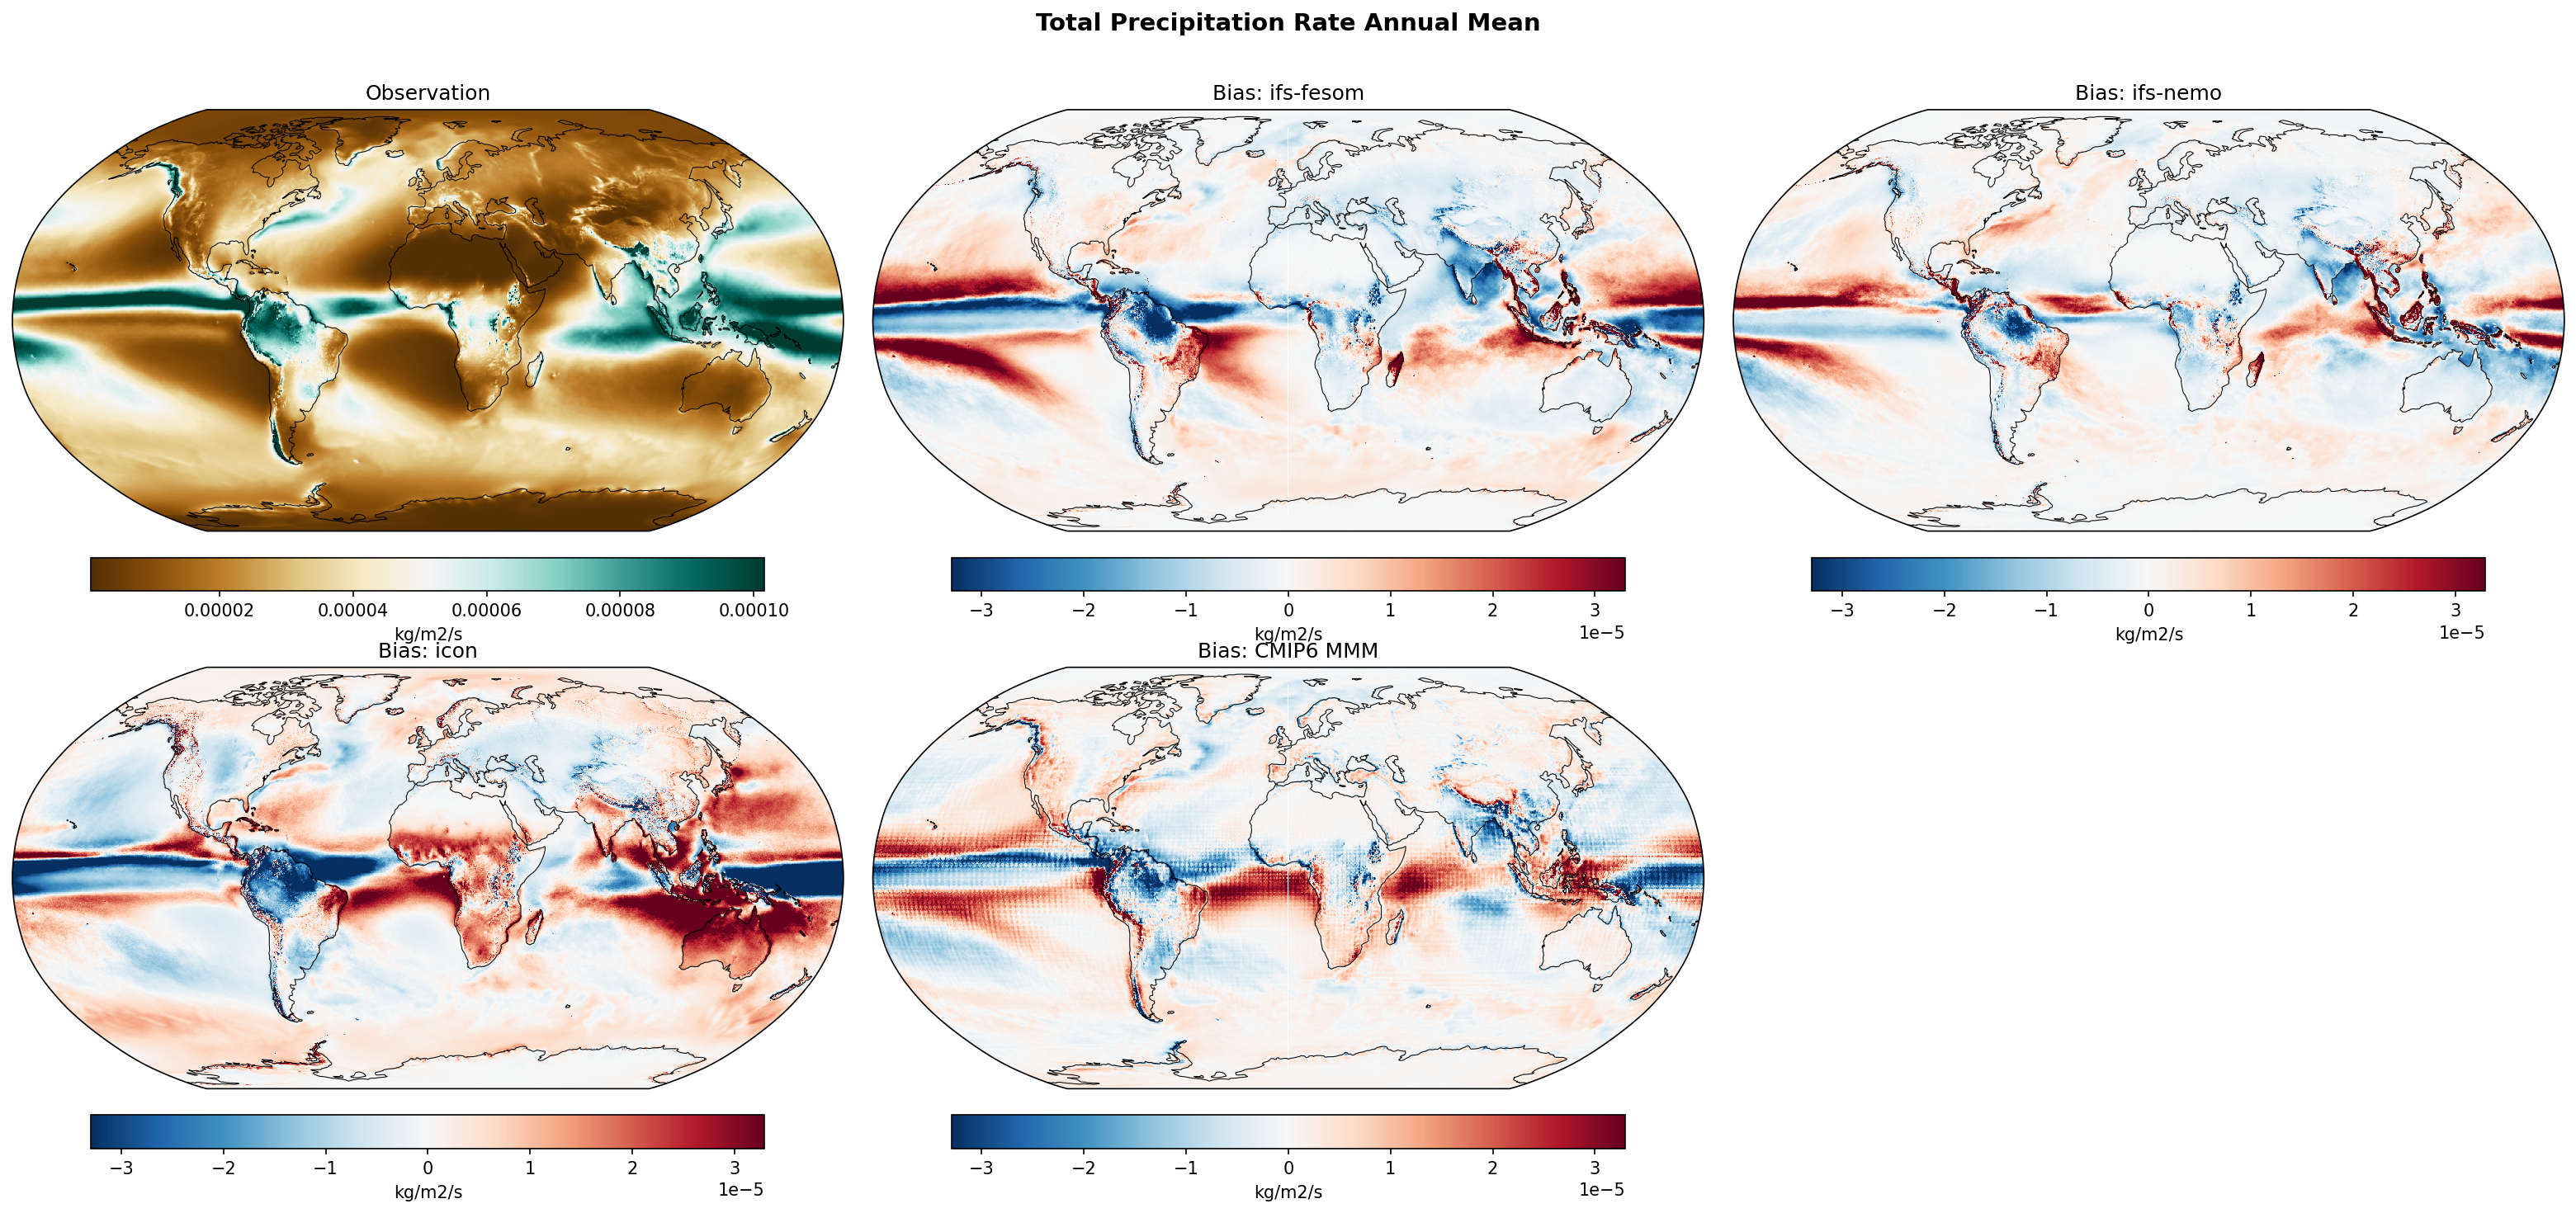
| Variables | avg_tprate |
|---|---|
| Models | ifs-fesom, ifs-nemo, icon, CMIP6 MMM, MPI-ESM1-2-LR/r1i1p1f1, GISS-E2-1-G/r1i1p1f2, IPSL-CM6A-LR/r1i1p1f1, ACCESS-ESM1-5/r1i1p1f1, EC-Earth3/r1i1p1f1, CNRM-CM6-1/r1i1p1f2, AWI-CM-1-1-MR/r1i1p1f1, CNRM-ESM2-1/r1i1p1f2, FGOALS-g3/r1i1p1f1, INM-CM5-0/r1i1p1f1, MRI-ESM2-0/r1i1p1f1 |
| Reference Dataset | ERA5 |
| Units | kg/m2/s |
| Period | 1990–2014 |
| ifs-fesom | Global Mean Bias: 0.00 · Rmse: 0.00 |
| ifs-nemo | Global Mean Bias: 0.00 · Rmse: 0.00 |
| icon | Global Mean Bias: 0.00 · Rmse: 0.00 |
| CMIP6 MMM | Global Mean Bias: 0.00 · Rmse: 0.00 |
| MPI-ESM1-2-LR/r1i1p1f1 | Global Mean Bias: -0.00 · Rmse: 0.00 |
| GISS-E2-1-G/r1i1p1f2 | Global Mean Bias: 0.00 · Rmse: 0.00 |
| IPSL-CM6A-LR/r1i1p1f1 | Global Mean Bias: 0.00 · Rmse: 0.00 |
| ACCESS-ESM1-5/r1i1p1f1 | Global Mean Bias: 0.00 · Rmse: 0.00 |
| EC-Earth3/r1i1p1f1 | Global Mean Bias: 0.00 · Rmse: 0.00 |
| CNRM-CM6-1/r1i1p1f2 | Global Mean Bias: 0.00 · Rmse: 0.00 |
| AWI-CM-1-1-MR/r1i1p1f1 | Global Mean Bias: -0.00 · Rmse: 0.00 |
| CNRM-ESM2-1/r1i1p1f2 | Global Mean Bias: 0.00 · Rmse: 0.00 |
| FGOALS-g3/r1i1p1f1 | Global Mean Bias: -0.00 · Rmse: 0.00 |
| INM-CM5-0/r1i1p1f1 | Global Mean Bias: 0.00 · Rmse: 0.00 |
| MRI-ESM2-0/r1i1p1f1 | Global Mean Bias: 0.00 · Rmse: 0.00 |
Summary high
The figure illustrates the annual mean total precipitation rate biases for three high-resolution DestinE models and the CMIP6 multi-model mean compared to ERA5, revealing pervasive tropical rainfall biases including the classic double ITCZ problem and land drying.
Key Findings
- All models exhibit a double ITCZ bias, but the magnitude varies drastically: it is exceptionally severe in ICON, prominent in IFS-FESOM, and most subdued in IFS-NEMO.
- Significant dry biases are present over major tropical landmasses, particularly the Amazon and Congo basins, across all three DestinE models.
- IFS-NEMO performs best among the high-resolution models, exhibiting the lowest RMSE (1.03e-5 kg/m2/s) and global mean bias, comparing favorably to the CMIP6 MMM.
- High-resolution models (especially IFS-FESOM and ICON) show pronounced fine-scale wet biases over steep orography, such as the Andes, Himalayas, and coastal ranges.
Spatial Patterns
A striking spatial pattern is the strong positive bias flanking the equator in the Pacific and Atlantic oceans paired with a negative bias directly on the equator, characteristic of the double ITCZ syndrome. Over land, extensive negative biases cover the Amazon and central Africa. Wet biases are concentrated over the Maritime Continent, the western Indian Ocean, and sharply aligned with major mountain ranges.
Model Agreement
Models generally agree on the sign of large-scale biases (e.g., equatorial Pacific drying, Amazon drying) but diverge significantly in magnitude. ICON stands out with an excessively strong double ITCZ and tropical dry biases. IFS-NEMO shows the best agreement with ERA5. CMIP6 MMM shares the broad tropical bias patterns but lacks the fine-scale orographic wet biases explicitly resolved by the ~5km DestinE models.
Physical Interpretation
The double ITCZ and equatorial dry biases are strongly linked to coupled ocean-atmosphere interactions, specifically excessive equatorial cold tongue SST biases and overly active convection off the equator. The dry biases over the Amazon and Congo suggest deficiencies in land-atmosphere coupling, evapotranspiration, or large-scale moisture convergence. The highly localized wet biases over mountain ranges in the 5km models reflect strong dynamically forced ascent interacting with precipitation schemes that may be overly sensitive at these newly resolved scales.
Caveats
- ERA5 precipitation is a model-derived product rather than a direct satellite or rain gauge observation, meaning 'biases' partly reflect differences between the DestinE model physics and the ECMWF model physics used in ERA5.
- The high-resolution models may still be undergoing tuning for their convective and boundary layer parameterizations, which strongly control tropical precipitation distribution.
Total Precipitation Rate DJF Bias
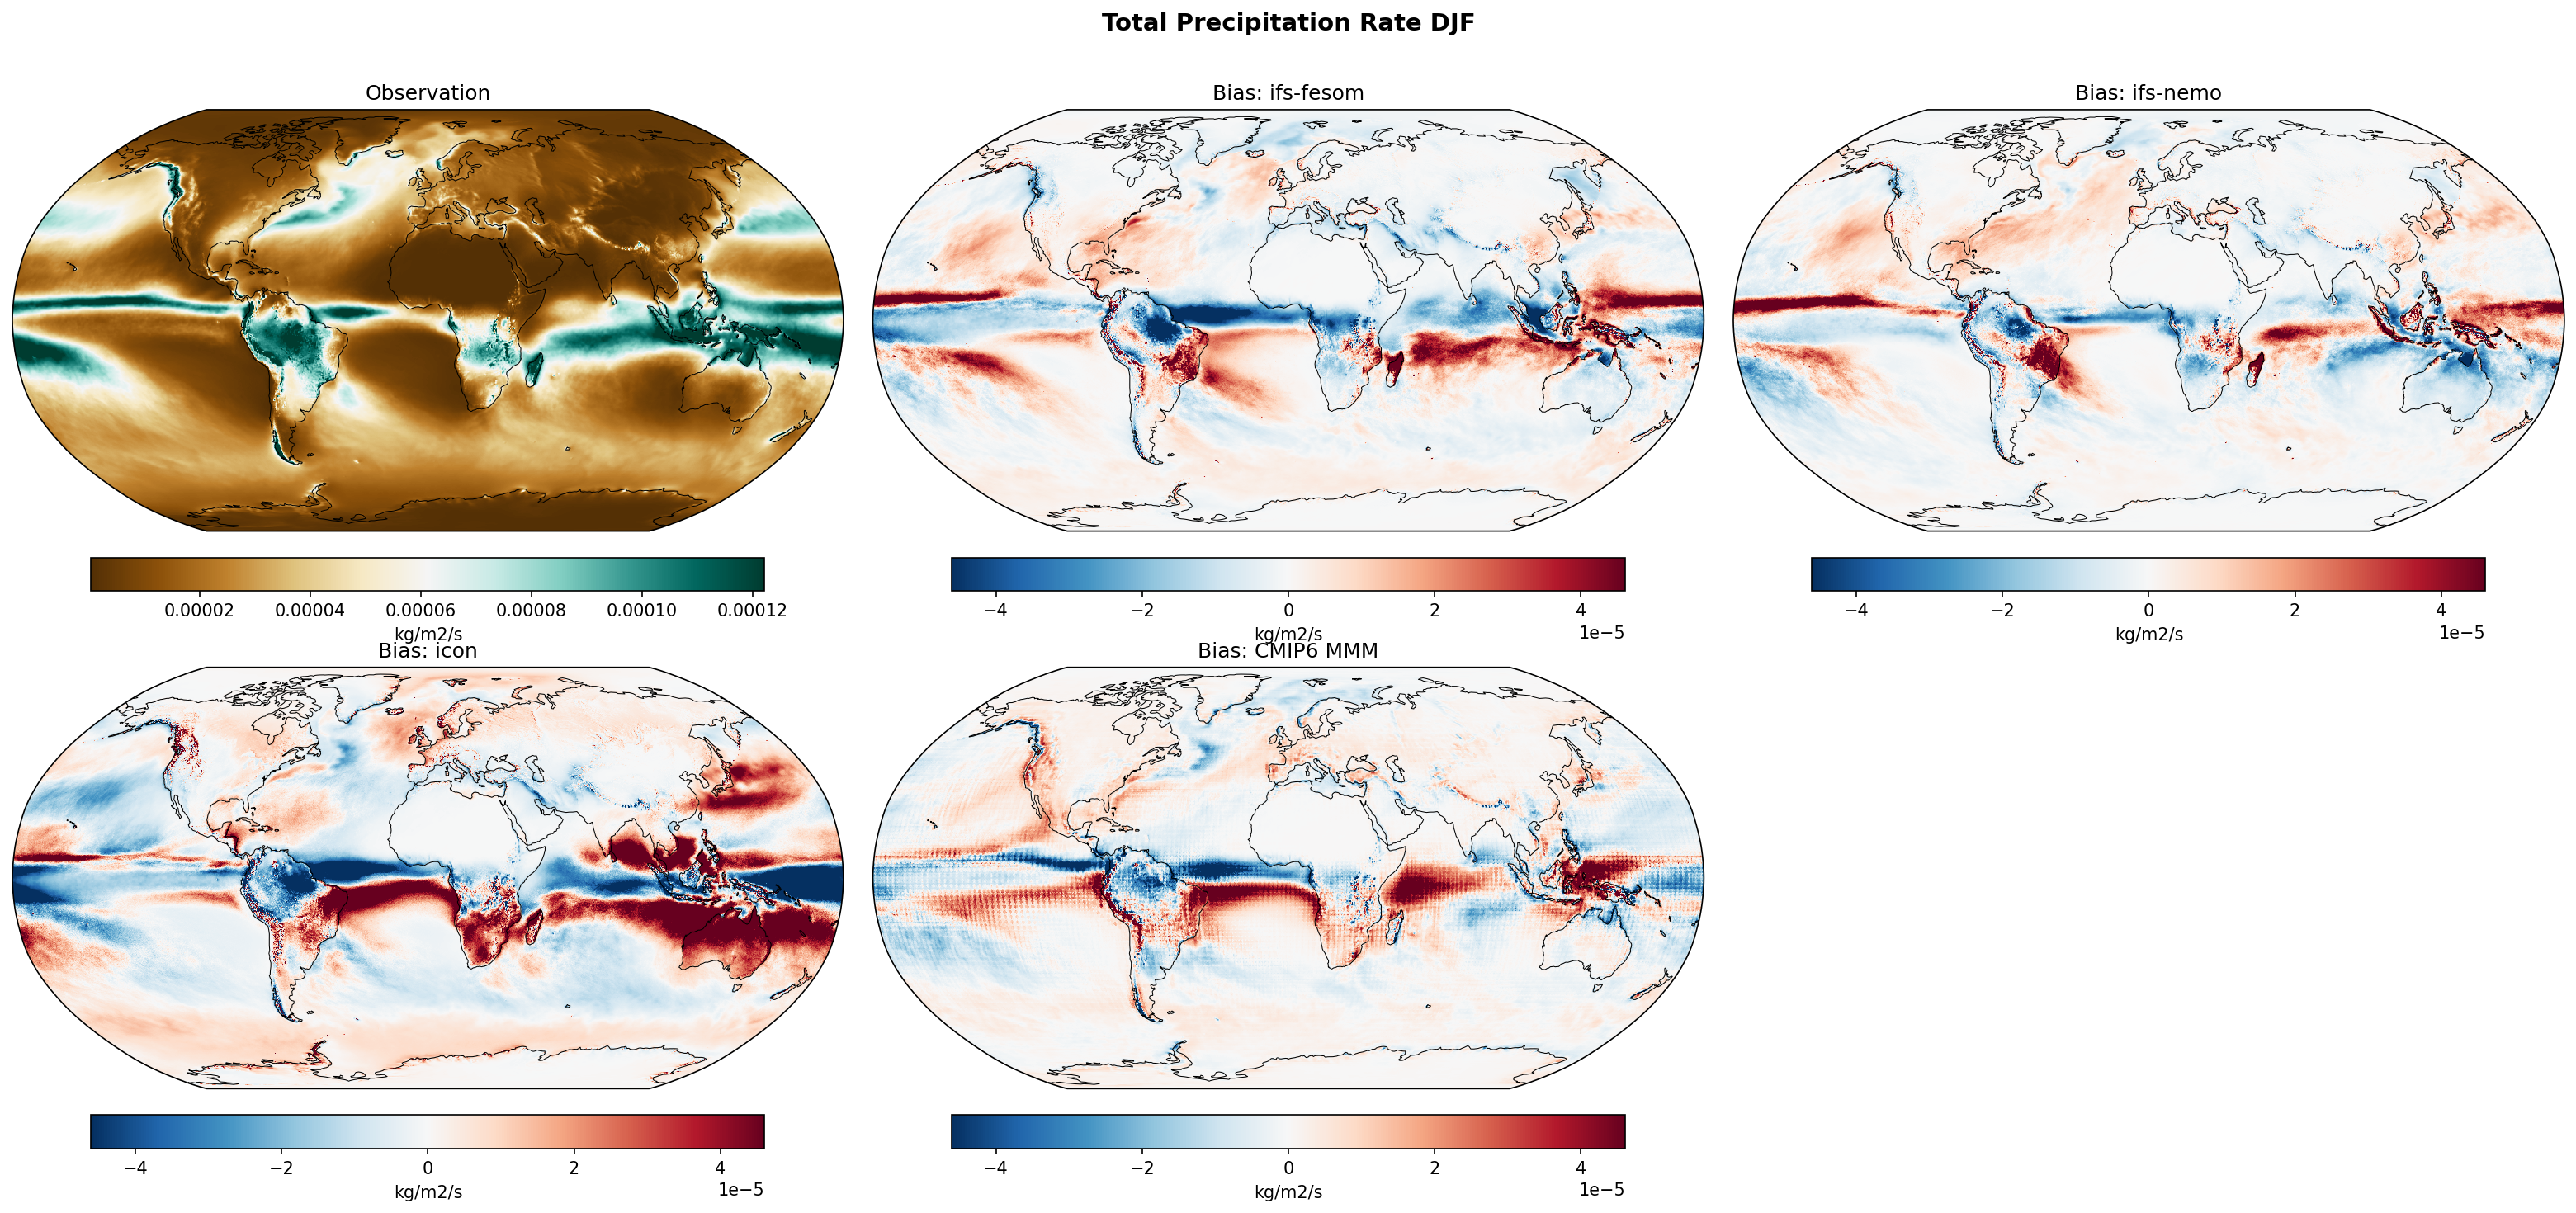
| Variables | avg_tprate |
|---|---|
| Models | ifs-fesom, ifs-nemo, icon, CMIP6 MMM, MPI-ESM1-2-LR/r1i1p1f1, GISS-E2-1-G/r1i1p1f2, IPSL-CM6A-LR/r1i1p1f1, ACCESS-ESM1-5/r1i1p1f1, EC-Earth3/r1i1p1f1, CNRM-CM6-1/r1i1p1f2, AWI-CM-1-1-MR/r1i1p1f1, CNRM-ESM2-1/r1i1p1f2, FGOALS-g3/r1i1p1f1, INM-CM5-0/r1i1p1f1, MRI-ESM2-0/r1i1p1f1 |
| Reference Dataset | ERA5 |
| Units | kg/m2/s |
| Period | 1990–2014 |
| CMIP6 MMM | Global Mean Bias: 0.00 · Rmse: None |
| MPI-ESM1-2-LR/r1i1p1f1 | Global Mean Bias: -0.00 · Rmse: None |
| GISS-E2-1-G/r1i1p1f2 | Global Mean Bias: 0.00 · Rmse: None |
| IPSL-CM6A-LR/r1i1p1f1 | Global Mean Bias: 0.00 · Rmse: None |
| ACCESS-ESM1-5/r1i1p1f1 | Global Mean Bias: 0.00 · Rmse: None |
| EC-Earth3/r1i1p1f1 | Global Mean Bias: 0.00 · Rmse: None |
| CNRM-CM6-1/r1i1p1f2 | Global Mean Bias: 0.00 · Rmse: None |
| AWI-CM-1-1-MR/r1i1p1f1 | Global Mean Bias: 0.00 · Rmse: None |
| CNRM-ESM2-1/r1i1p1f2 | Global Mean Bias: 0.00 · Rmse: None |
| FGOALS-g3/r1i1p1f1 | Global Mean Bias: -0.00 · Rmse: None |
| INM-CM5-0/r1i1p1f1 | Global Mean Bias: 0.00 · Rmse: None |
| MRI-ESM2-0/r1i1p1f1 | Global Mean Bias: 0.00 · Rmse: None |
Summary high
Global bias maps of DJF total precipitation rate reveal that high-resolution DestinE models continue to exhibit long-standing tropical biases, such as the double ITCZ and Amazonian drying, akin to the CMIP6 multi-model mean.
Key Findings
- All models exhibit a pronounced 'double ITCZ' bias in the tropical Pacific, characterized by an erroneous wet band south of the equator and a dry bias along the equator.
- A pervasive dry bias over the Amazon basin and central Africa is present in all models, with the ICON model showing the most severe deficit.
- Despite their ~5 km resolution, DestinE models share the same large-scale tropical precipitation error structures as the ~100 km CMIP6 MMM, indicating resolution alone does not fix these issues.
Spatial Patterns
Bias patterns are heavily concentrated in the tropics. A classic double ITCZ signature is evident in the Pacific (wet bias south of the equator, dry bias along the equator). There are distinct wet biases over the Maritime Continent, Western Indian Ocean, and the South Pacific Convergence Zone (SPCZ). Conversely, major tropical landmasses—specifically the Amazon and Congo basins—exhibit prominent dry biases. Mid-latitude storm track biases are comparatively muted.
Model Agreement
IFS-FESOM and IFS-NEMO display nearly identical bias patterns, reflecting their shared IFS atmospheric component. ICON shows the same broad structural errors but with significantly larger magnitudes in the deep tropics (e.g., extreme Amazon drying and Indian Ocean wetting). All high-resolution models generally agree with the CMIP6 MMM on the sign and location of major tropical errors.
Physical Interpretation
The persistence of the double ITCZ and Amazon dry biases across resolutions points to systemic deficiencies in parameterized deep convection, boundary layer processes, and land-atmosphere coupling, rather than resolved fluid dynamics. The Pacific errors are likely linked to coupled ocean-atmosphere dynamics, such as an overly strong equatorial cold tongue or deficient stratocumulus decks off South America triggering spurious convection southward.
Caveats
- ERA5 precipitation is a model-derived reanalysis product rather than direct observation (e.g., satellite/gauge), meaning the 'truth' reference itself has uncertainties in tropical convective regions.
- The color scale saturates in the deep tropics, particularly for the ICON model, which obscures the peak magnitude of the largest localized biases.
Total Precipitation Rate JJA Bias
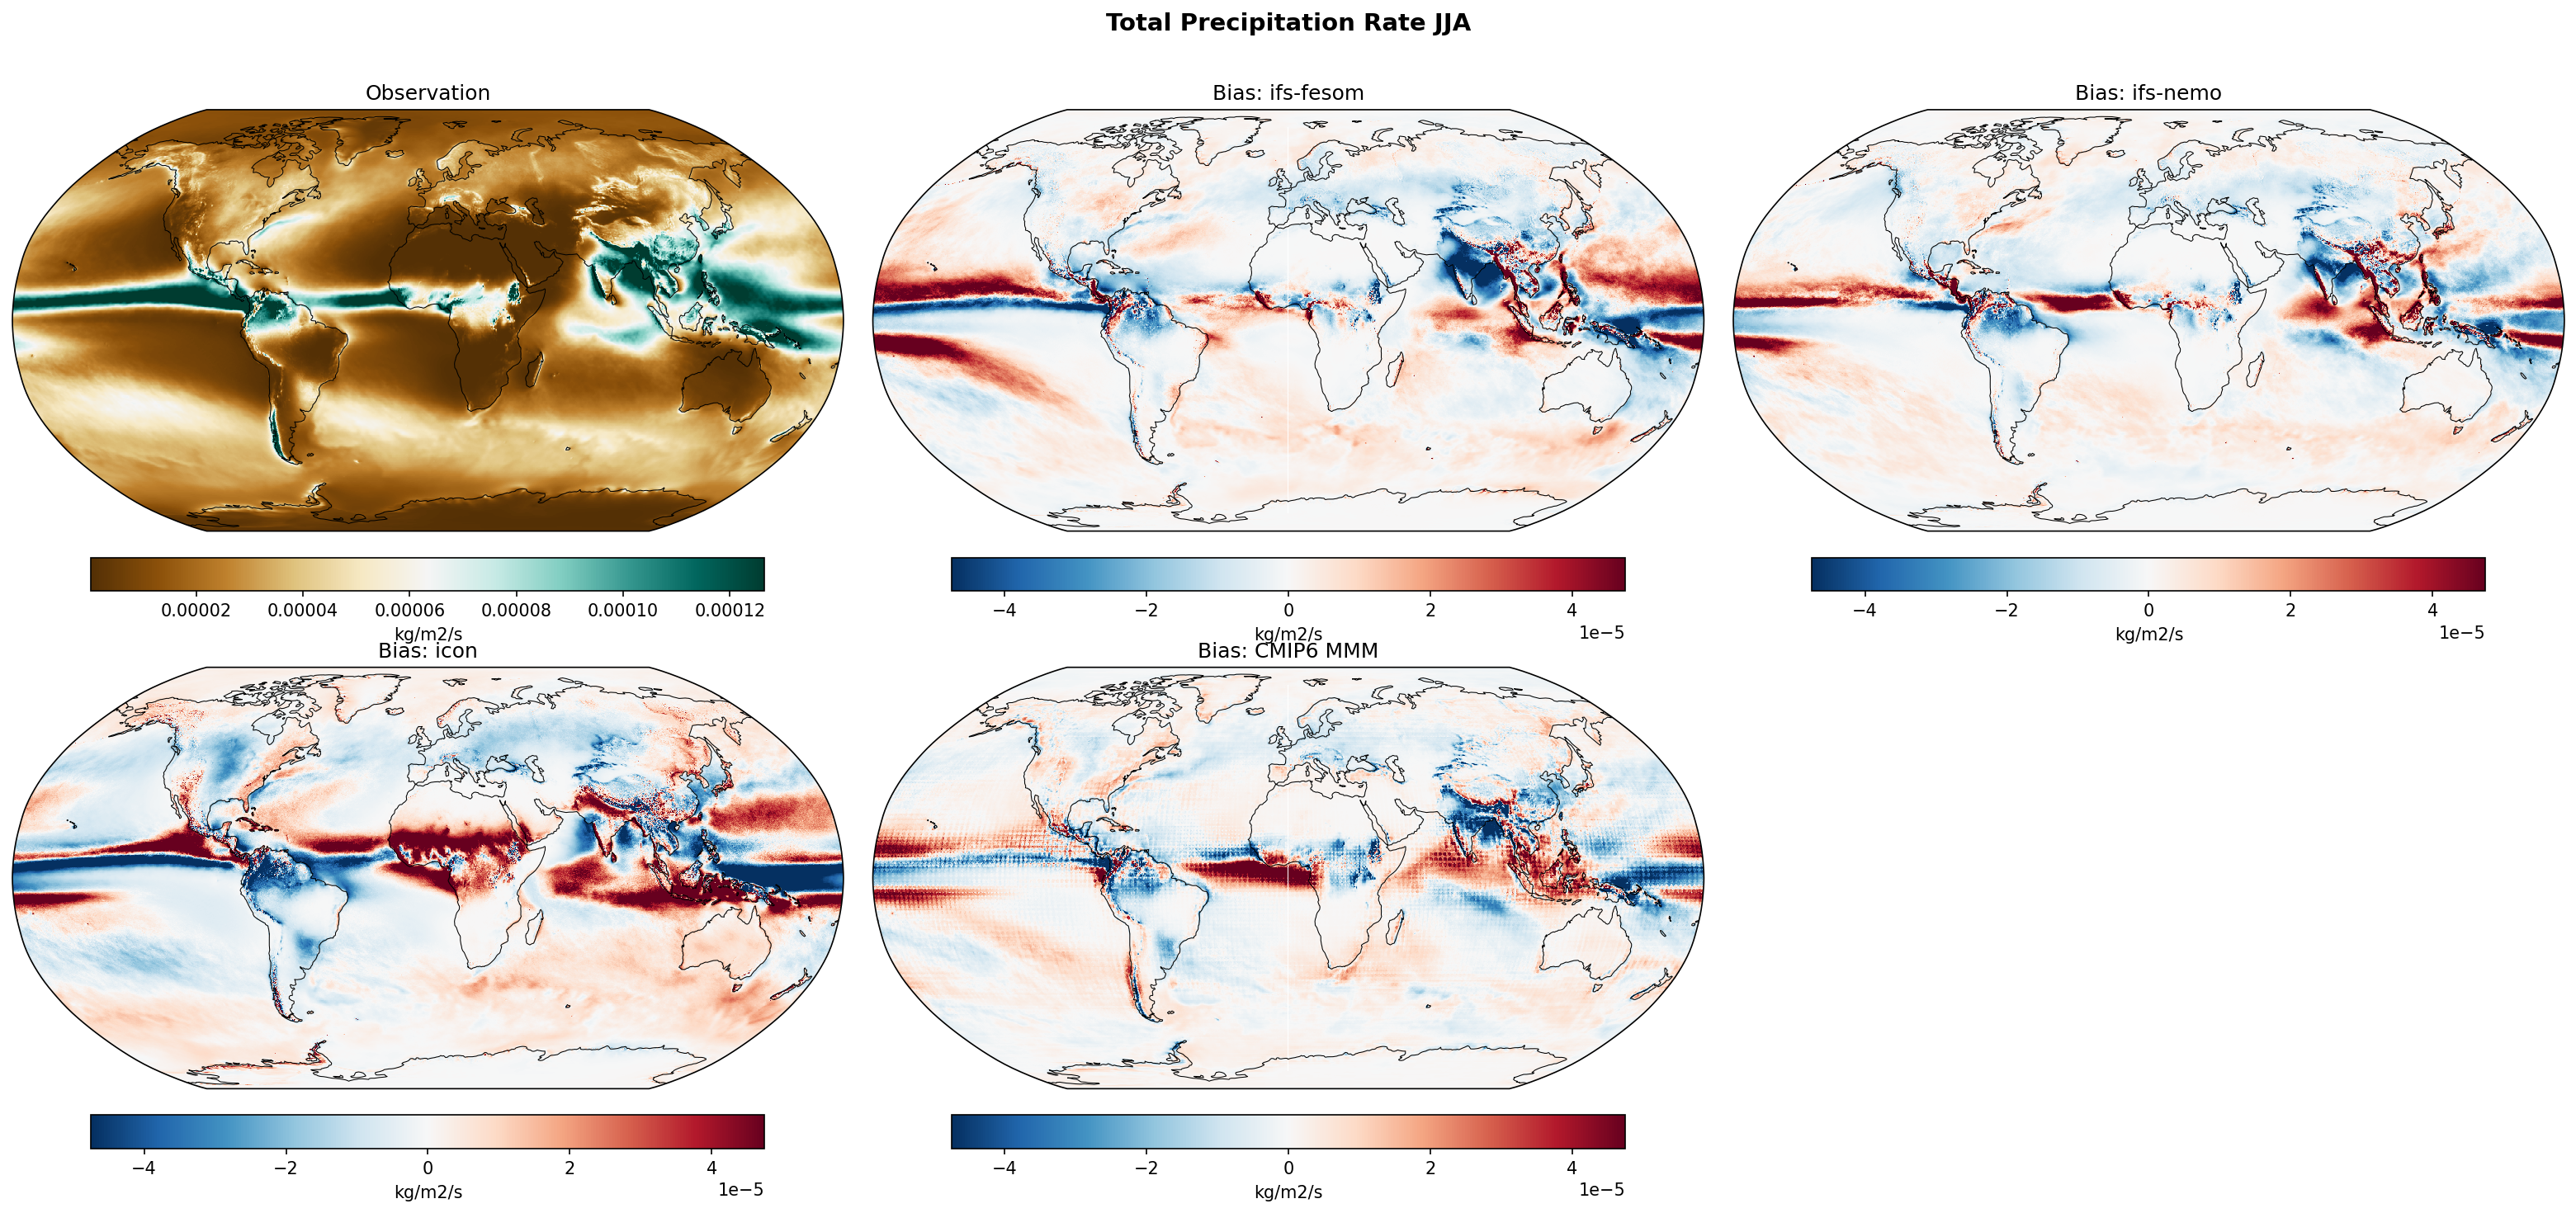
| Variables | avg_tprate |
|---|---|
| Models | ifs-fesom, ifs-nemo, icon, CMIP6 MMM, MPI-ESM1-2-LR/r1i1p1f1, GISS-E2-1-G/r1i1p1f2, IPSL-CM6A-LR/r1i1p1f1, ACCESS-ESM1-5/r1i1p1f1, EC-Earth3/r1i1p1f1, CNRM-CM6-1/r1i1p1f2, AWI-CM-1-1-MR/r1i1p1f1, CNRM-ESM2-1/r1i1p1f2, FGOALS-g3/r1i1p1f1, INM-CM5-0/r1i1p1f1, MRI-ESM2-0/r1i1p1f1 |
| Reference Dataset | ERA5 |
| Units | kg/m2/s |
| Period | 1990–2014 |
| CMIP6 MMM | Global Mean Bias: 0.00 · Rmse: None |
| MPI-ESM1-2-LR/r1i1p1f1 | Global Mean Bias: -0.00 · Rmse: None |
| GISS-E2-1-G/r1i1p1f2 | Global Mean Bias: -0.00 · Rmse: None |
| IPSL-CM6A-LR/r1i1p1f1 | Global Mean Bias: 0.00 · Rmse: None |
| ACCESS-ESM1-5/r1i1p1f1 | Global Mean Bias: 0.00 · Rmse: None |
| EC-Earth3/r1i1p1f1 | Global Mean Bias: -0.00 · Rmse: None |
| CNRM-CM6-1/r1i1p1f2 | Global Mean Bias: -0.00 · Rmse: None |
| AWI-CM-1-1-MR/r1i1p1f1 | Global Mean Bias: -0.00 · Rmse: None |
| CNRM-ESM2-1/r1i1p1f2 | Global Mean Bias: 0.00 · Rmse: None |
| FGOALS-g3/r1i1p1f1 | Global Mean Bias: -0.00 · Rmse: None |
| INM-CM5-0/r1i1p1f1 | Global Mean Bias: 0.00 · Rmse: None |
| MRI-ESM2-0/r1i1p1f1 | Global Mean Bias: 0.00 · Rmse: None |
Summary high
The figure evaluates JJA total precipitation rate biases for three high-resolution DestinE models and the CMIP6 multi-model mean against ERA5, highlighting persistent systematic errors in the tropical ITCZ and Asian monsoon regions.
Key Findings
- All models exhibit a prominent dry bias over the Indian subcontinent and a wet bias over the equatorial Indian Ocean, struggling to correctly position the Asian Summer Monsoon precipitation.
- A classic 'double ITCZ' signature is present in the Pacific across all models, characterized by excessive precipitation south of the equator and deficits along the primary northern ITCZ core.
- ICON displays substantially larger positive precipitation biases (up to ~4e-5 kg/m2/s) over tropical landmasses, particularly Africa, and the broader Indian Ocean compared to the IFS-based models and the CMIP6 MMM.
Spatial Patterns
Biases are predominantly concentrated in the tropics. A distinct north-south dipole is visible in the Pacific ITCZ, with negative biases in the northern hemisphere and strong positive biases in the southern hemisphere. A similar dipole exists in the Indian sector (dry India/Bay of Bengal, wet equatorial Indian Ocean). Mid-latitude biases are comparatively weak, though ICON shows slight positive biases in the Southern Ocean storm tracks.
Model Agreement
IFS-FESOM and IFS-NEMO show remarkably similar bias patterns and magnitudes, indicating that the atmospheric component (IFS) dominates the coupled precipitation errors. ICON diverges with much stronger, widespread tropical overestimates. Notably, all high-resolution models share the broad structural errors present in the ~100 km CMIP6 MMM, suggesting increased resolution alone does not cure these fundamental convective and coupled biases.
Physical Interpretation
The dry India/wet equatorial Indian Ocean bias is a common coupled model deficiency, often driven by inaccurate cross-equatorial monsoon flow, local Indian Ocean SST biases, and errors in convective parameterization. The Pacific precipitation dipole reflects the persistent 'double ITCZ' syndrome, frequently linked to overly warm SSTs in the southeastern Pacific due to insufficient stratocumulus cloud cover. ICON's pronounced wet biases over tropical land (e.g., the Sahel) may result from overly sensitive convective triggering or overly active land-atmosphere moisture recycling.
Caveats
- ERA5 precipitation is a model-derived forecast product rather than a direct observation; its tropical precipitation can have substantial uncertainties compared to satellite-merged products like GPCP.
- Comparing ~5 km grid-scale precipitation features directly to the coarser (~30 km) ERA5 reanalysis may penalize the high-resolution models for simulating localized convective extremes that are smoothed out in the reference dataset.