Radiation Radiation Budget
Synthesis
Related diagnostics
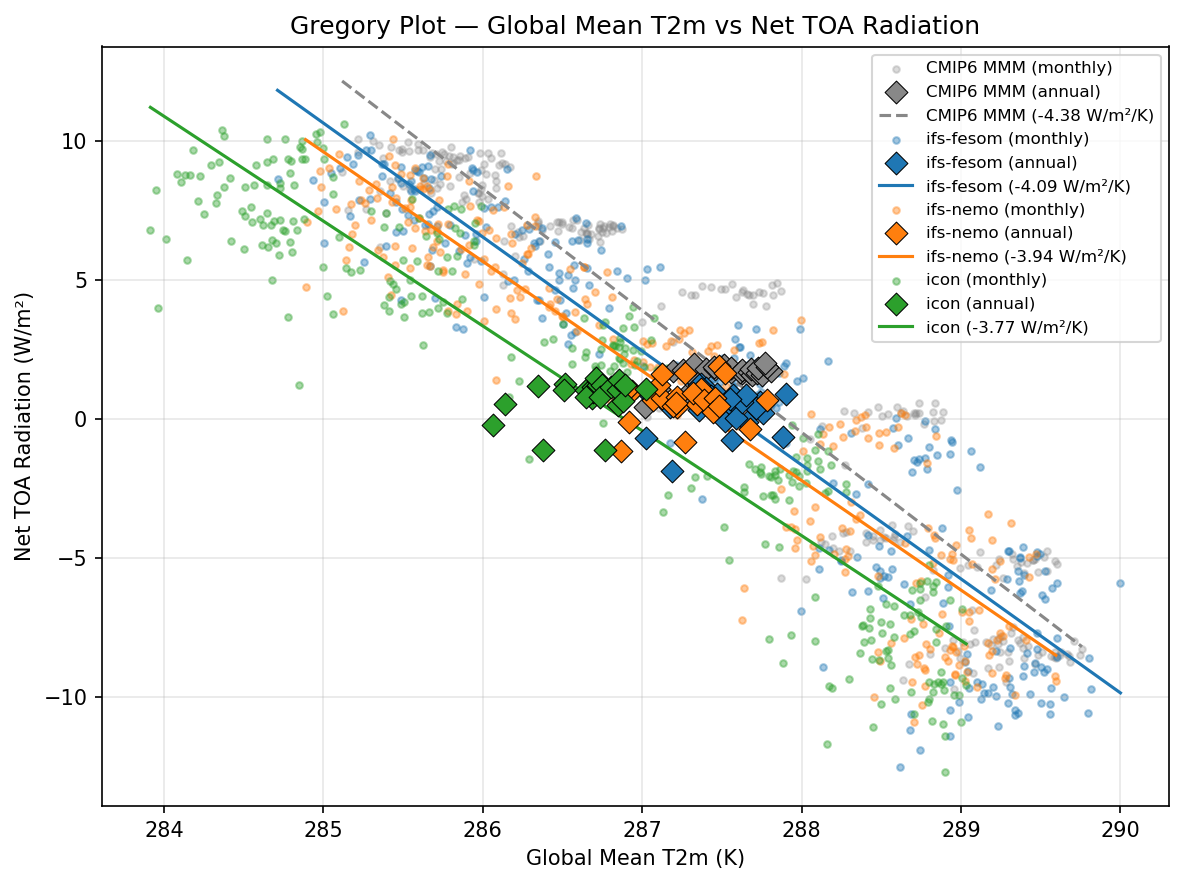
Gregory Plot
| Variables | tas, rst, rlt |
|---|---|
| Models | ifs-fesom, ifs-nemo, icon |
| Reference Dataset | CERES_EBAF + ERA5 |
| Units | K |
| Period | 1990–2014 |
| Method | Net TOA = TOA net SW + TOA net LW. Obs uses CERES EBAF for TOA + ERA5 for T2m. |
Summary high
This Gregory plot illustrates the relationship between global mean 2m temperature and net top-of-atmosphere (TOA) radiation, highlighting the seasonal and interannual radiative response (effective feedback parameter) across the models.
Key Findings
- ICON exhibits a distinct global mean cold bias of approximately 1 K compared to the IFS-based models and the CMIP6 multi-model mean.
- The radiative response to temperature variations (regression slope) is weaker (less negative) in the high-resolution models (-3.77 to -4.09 W/m²/K) compared to the CMIP6 MMM (-4.38 W/m²/K).
- IFS-FESOM and IFS-NEMO show strong agreement in both mean state and feedback parameter, closely mirroring the CMIP6 MMM's mean state.
- Annual mean net TOA radiation across all models is slightly positive, consistent with the expected planetary energy imbalance due to historical forcing.
Spatial Patterns
As a global mean phase-space plot, the data points span a wide temperature range (~6 K) driven primarily by the seasonal cycle, with monthly net TOA radiation varying by ±10 W/m². Annual means form distinct, tighter clusters.
Model Agreement
IFS-FESOM and IFS-NEMO agree well with each other and the CMIP6 MMM in terms of mean temperature (~287.5-288 K). ICON diverges significantly, clustering at a colder mean state (~286.5 K). All three high-resolution models have slightly weaker feedback slopes than the CMIP6 MMM.
Physical Interpretation
Because the plot uses historical seasonal and interannual data rather than an abrupt-4xCO2 forcing, the regression slope primarily captures the short-term seasonal climate feedback parameter. The less negative slopes in DestinE models suggest a weaker net radiative restoring force in response to temperature changes. ICON's offset to colder temperatures indicates a cooler mean climate state, likely driven by differences in cloud albedo or ocean heat uptake.
Caveats
- Deriving feedback parameters from historical monthly variability primarily captures seasonal and short-term responses, which differ fundamentally from long-term equilibrium climate sensitivity.
- Observational data (CERES/ERA5) are not explicitly visualized in the legend or plot, limiting direct validation of the model slopes against the real world.
Global Mean Radiation Budget
| Variables | rst, rlt, rstcs, rltcs, rss, rls, rsscs, rlscs, rsds, rlds, tas |
|---|---|
| Models | ifs-fesom, ifs-nemo, icon, CERES, CMIP6 MMM |
| Reference Dataset | CERES_EBAF |
| Units | W/m2 |
| Period | 1990–2014 |
Summary high
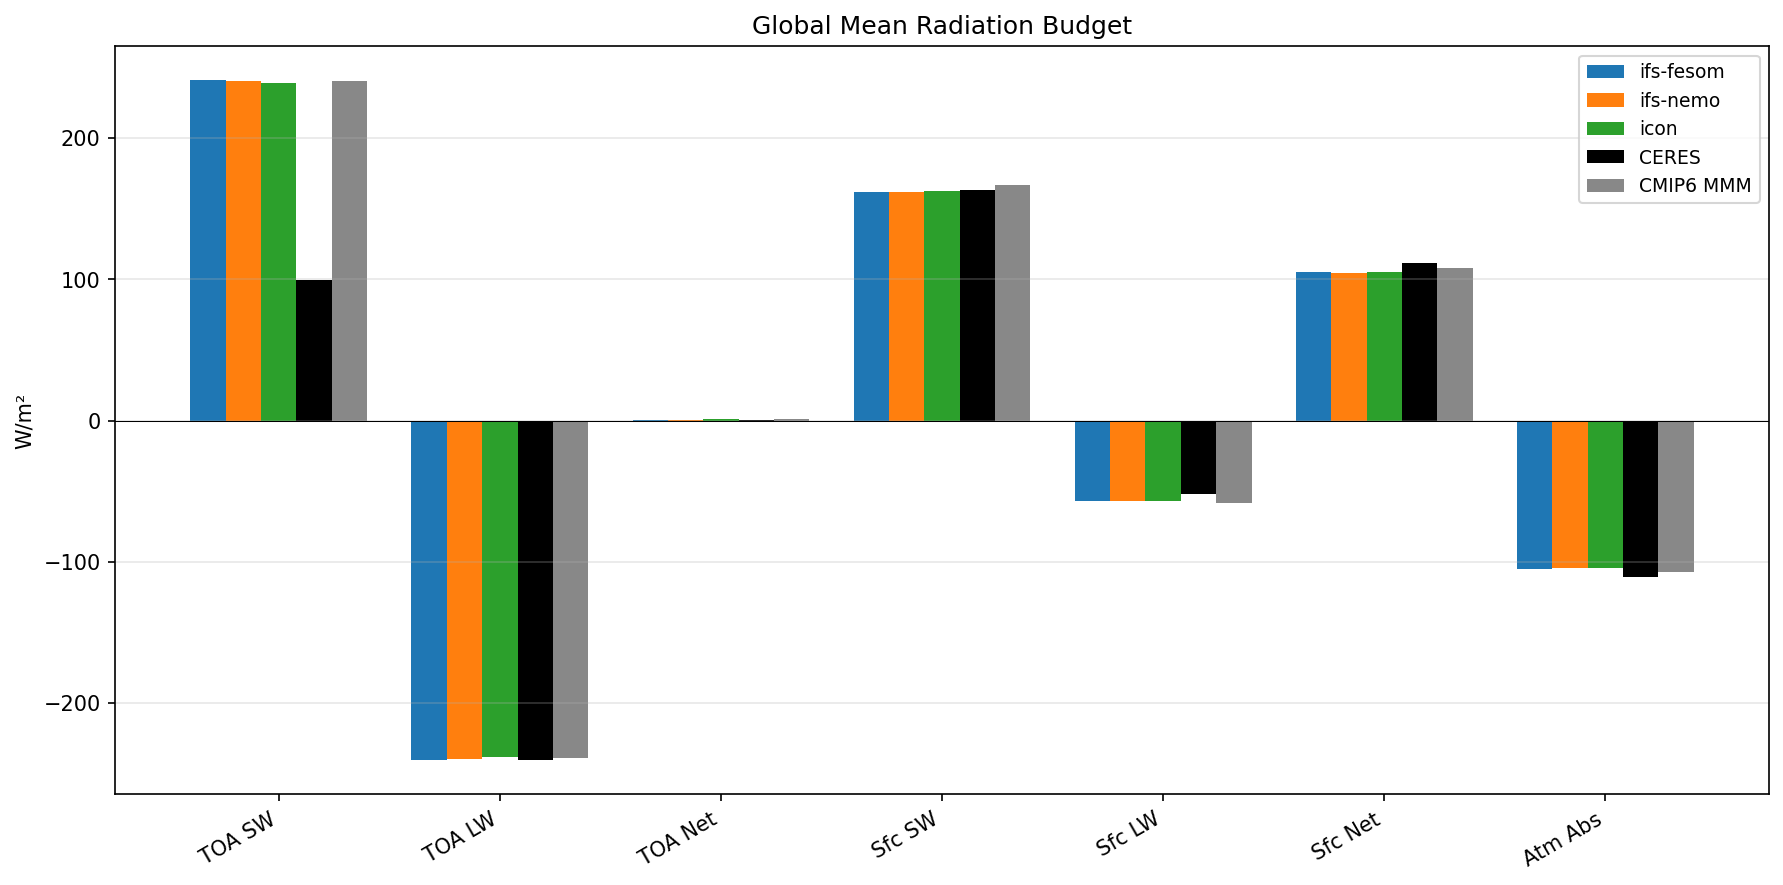
Grouped bar chart comparing global mean radiation budget components (TOA, Surface, and Atmospheric Absorption) across three high-resolution DestinE models, CMIP6 MMM, and CERES observations.
Key Findings
- The three DestinE models (IFS-FESOM, IFS-NEMO, ICON) show nearly identical global mean radiation budgets, indicating highly consistent global energetic tuning at high resolution.
- A clear plotting artifact exists in the CERES TOA SW bar, which displays a value consistent with reflected shortwave radiation (~100 W/m2) rather than net shortwave radiation (~240 W/m2) shown by the models.
- Models simulate slightly stronger net surface longwave cooling (~ -60 W/m2) compared to CERES (~ -55 W/m2), leading to a small underestimation of net surface radiation and reduced atmospheric radiative cooling.
Spatial Patterns
As a global mean diagnostic, spatial patterns are not resolved. However, across the budget components, shortwave fluxes are highly consistent between models and the CMIP6 MMM, while surface longwave fluxes exhibit the primary model-observation discrepancy.
Model Agreement
There is remarkably high inter-model agreement among the DestinE models, with virtually no distinguishable differences in their global means. The models also align closely with the CMIP6 multi-model mean baseline.
Physical Interpretation
The overestimation of net surface longwave cooling (more negative Sfc LW) in the models compared to CERES suggests a potential underestimation of downward longwave radiation. This physically points toward common model biases such as insufficient low-level cloud cover or boundary layer moisture. Consequently, to maintain energetic balance, the atmosphere exhibits slightly less net radiative cooling (less negative Atm Abs) than observed.
Caveats
- The CERES TOA SW bar erroneously plots reflected shortwave instead of net shortwave, preventing a valid visual comparison with the models for that specific component.
- Global mean budget values often mask significant compensating regional biases, such as errors in stratocumulus decks canceling out biases in deep convective regions.
Radiation Imbalance Time Series
| Variables | rst, rlt |
|---|---|
| Models | ifs-fesom, ifs-nemo, icon, CERES, CMIP6 MMM |
| Reference Dataset | CERES_EBAF |
| Units | W/m2 |
| Period | 1990–2014 |
Summary high
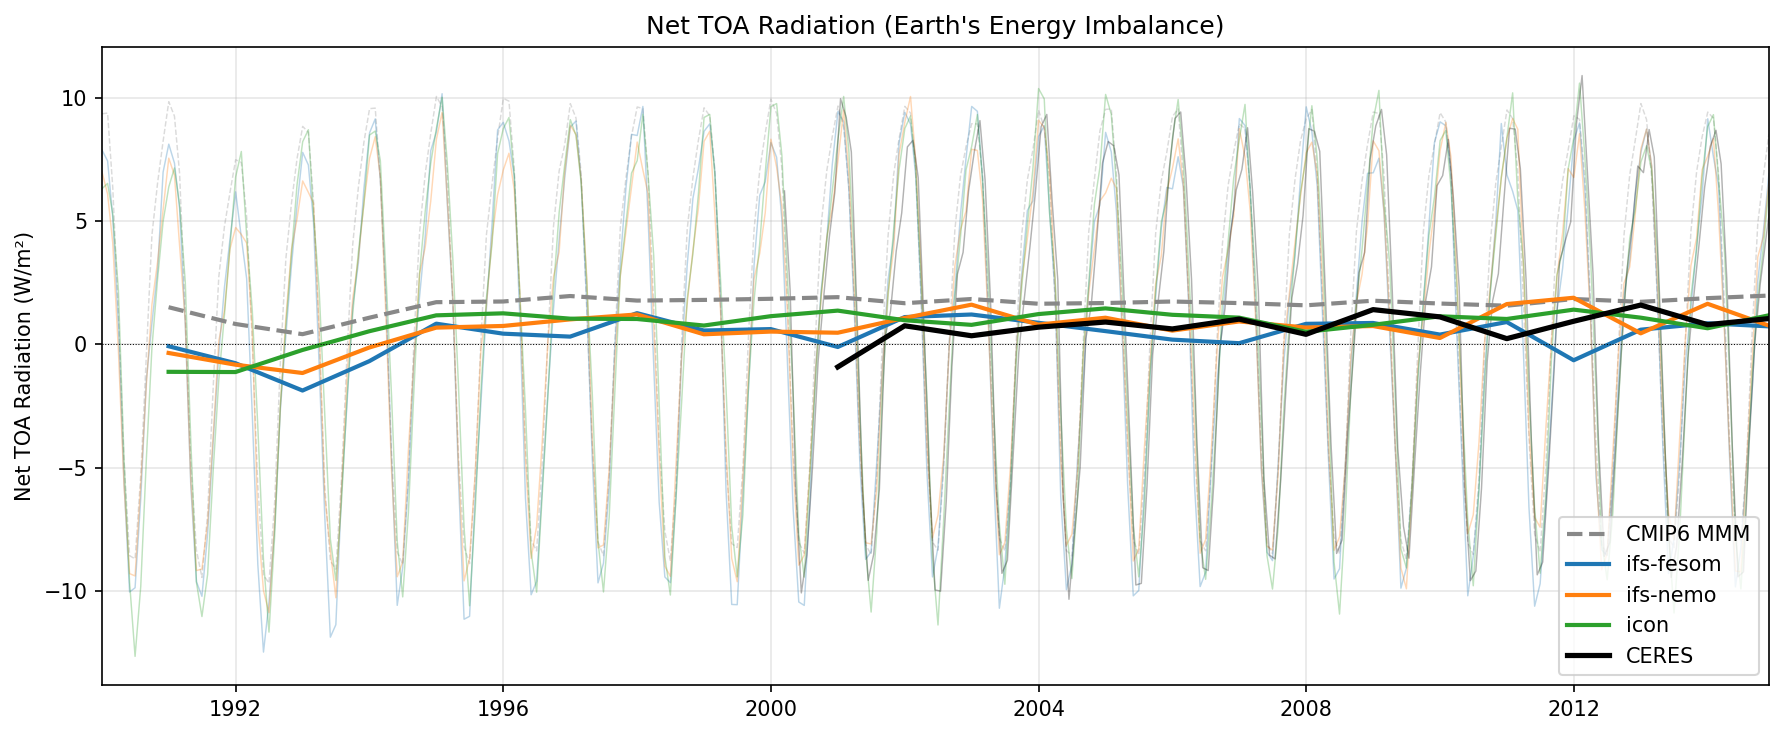
The figure displays the global-mean time series of Net Top-of-Atmosphere (TOA) radiation (Earth's energy imbalance) from 1990 to 2014, comparing high-resolution DestinE models with CERES observations and the CMIP6 multi-model mean.
Key Findings
- High-resolution DestinE models (IFS-FESOM, IFS-NEMO, ICON) accurately capture the observed annual mean Earth energy imbalance (~0.5-1.0 W/m²) post-2000.
- The CMIP6 multi-model mean exhibits a systematic positive bias of approximately 1.0 W/m² relative to both CERES observations and the DestinE models.
- All models successfully reproduce the large amplitude (~20 W/m² peak-to-peak) and phase of the monthly seasonal cycle in net TOA radiation.
- A transient negative energy imbalance is evident in the early 1990s across the models, reflecting the radiative response to the Mt. Pinatubo eruption.
Spatial Patterns
The temporal evolution is dominated by a robust seasonal cycle, peaking with net energy gain during the austral summer and net loss during the boreal summer, driven by the Earth's orbital eccentricity and the hemispheric asymmetry in land-ocean fractions and albedo. The annual mean reveals a secular positive energy imbalance overlaid with transient volcanic cooling in the early 1990s.
Model Agreement
The DestinE models exhibit strong agreement with CERES observations during the overlapping period (post-2000), significantly outperforming the CMIP6 MMM, which overestimates the imbalance. Inter-model agreement among the high-resolution models is high, though IFS-FESOM displays slightly larger interannual variability than ICON and IFS-NEMO.
Physical Interpretation
The positive annual mean indicates Earth's energy imbalance driven by anthropogenic greenhouse gas accumulation. The marked improvement in the high-resolution DestinE models relative to the CMIP6 MMM suggests that explicitly resolving finer scales (~5 km) yields better representations of critical radiative processes, likely through improved cloud microphysics, convection, and surface albedo feedbacks. The 1991-1993 dip corresponds to increased shortwave reflection by stratospheric sulfate aerosols from Mt. Pinatubo.
Caveats
- CERES observational data is only available from 2000 onwards, precluding direct validation of the models' simulated response to the 1991 Pinatubo eruption.
- The CMIP6 MMM represents an ensemble average that smooths internal variability, whereas the DestinE lines represent single realizations, complicating the comparison of interannual variability.
Surface Net Radiation Annual Bias
| Variables | rst, rlt, rstcs, rltcs, rss, rls, rsscs, rlscs, rsds, rlds, tas |
|---|---|
| Models | ifs-fesom, ifs-nemo, icon, CMIP6 MMM |
| Reference Dataset | CERES_EBAF |
| Units | W/m2 |
| Period | 1990–2014 |
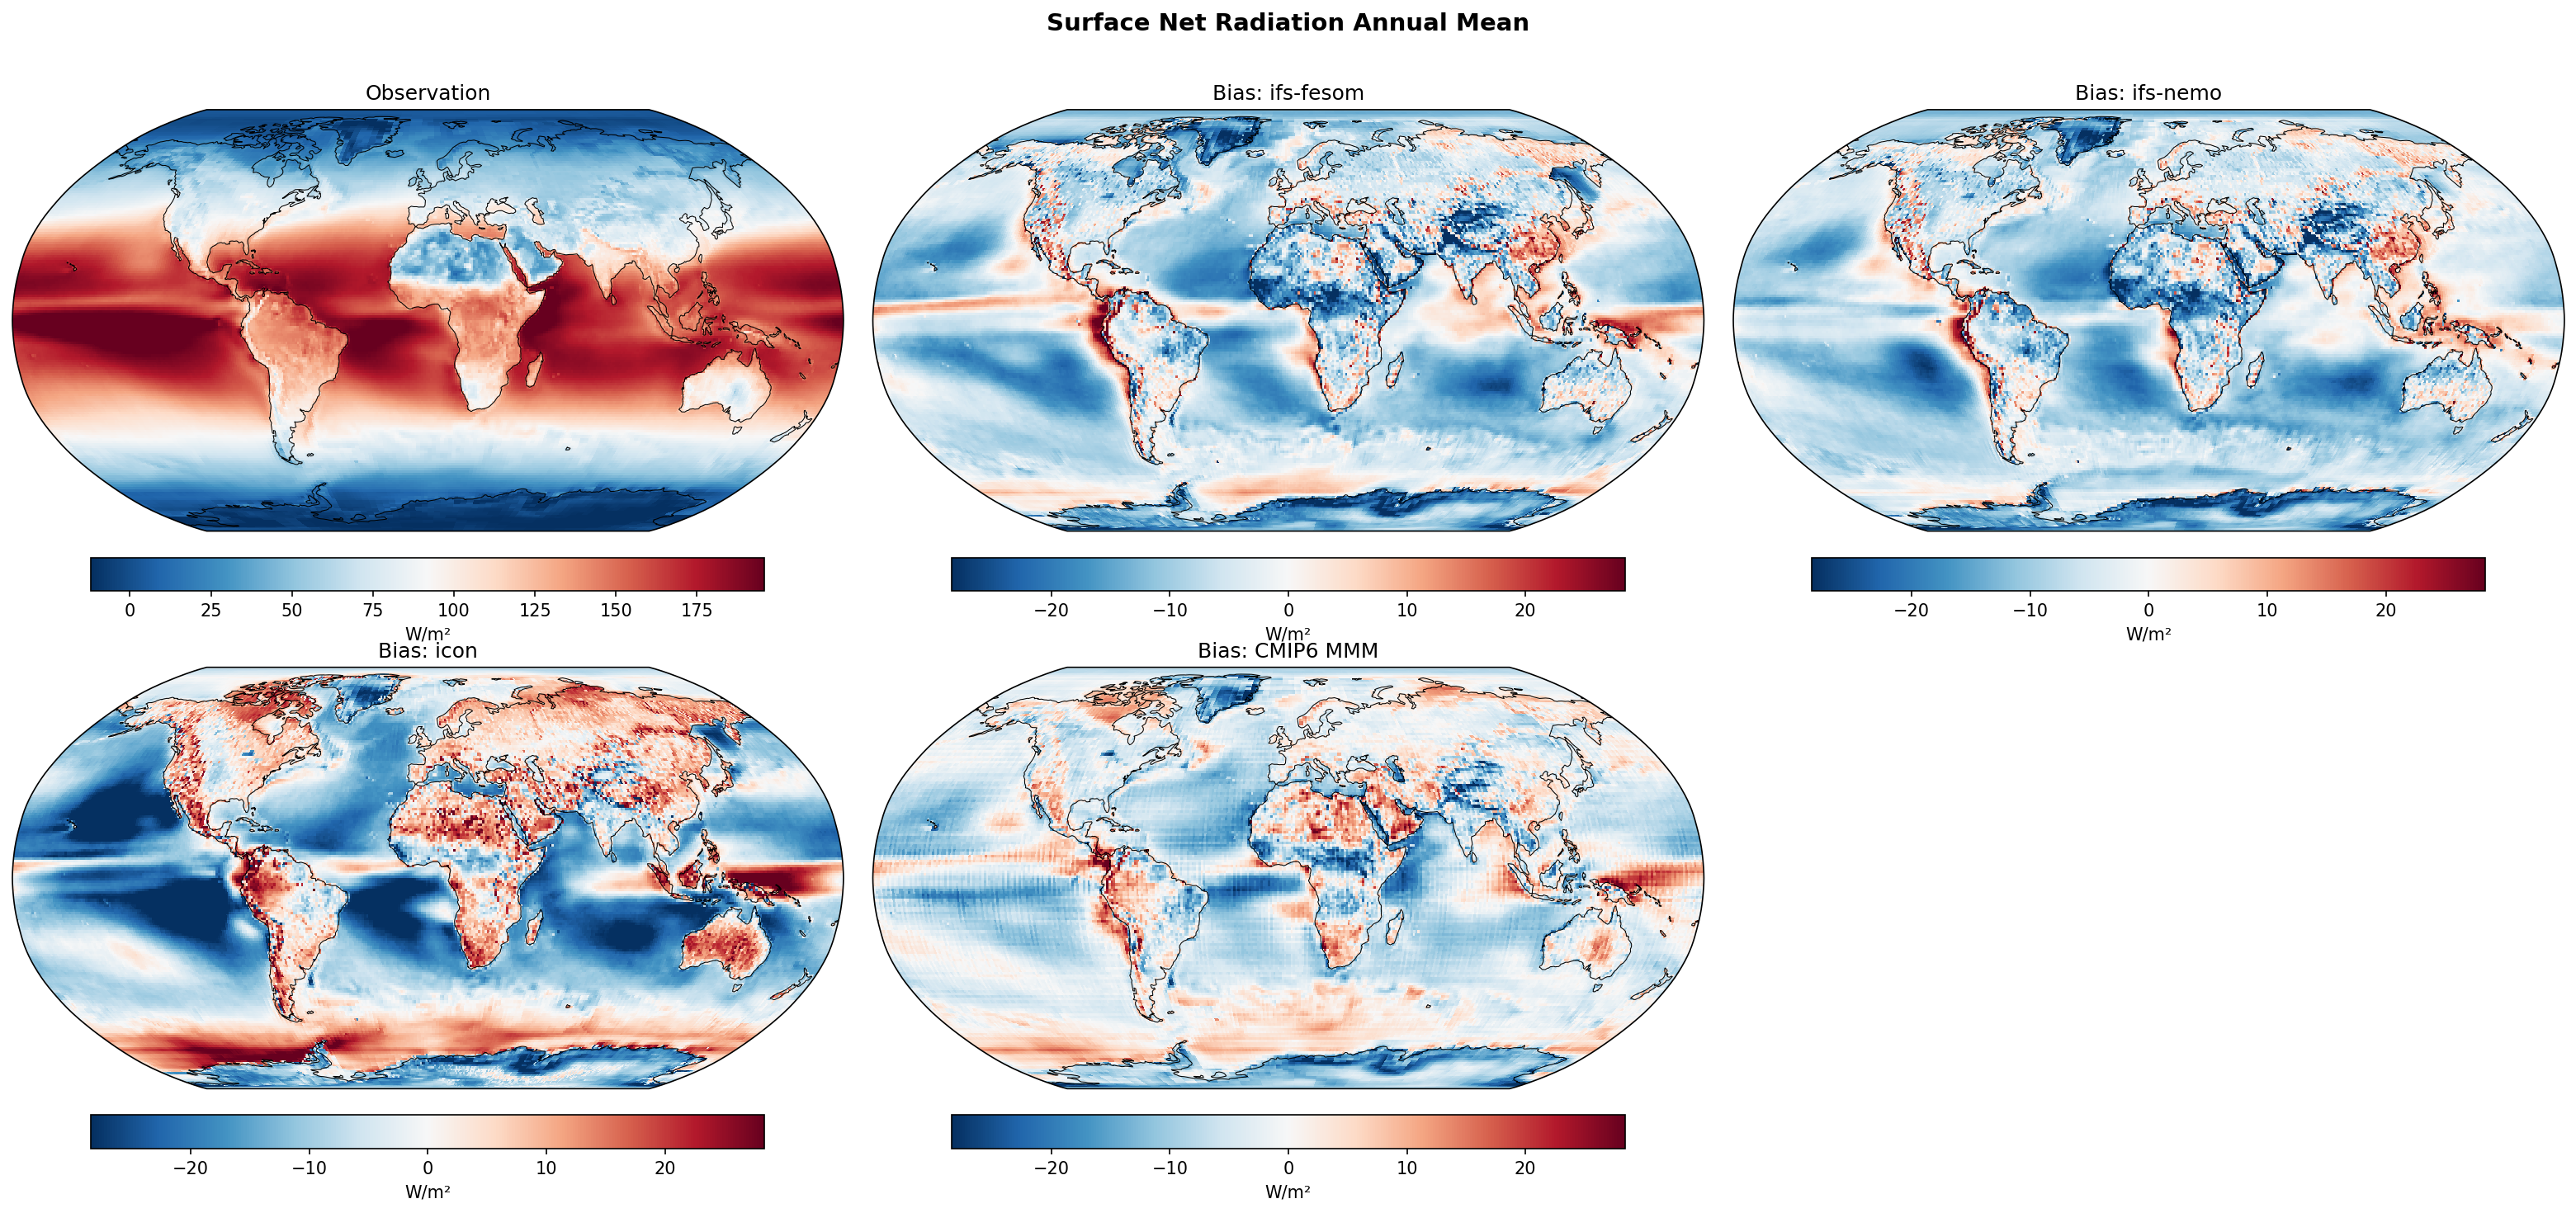
| ifs-fesom | Global Mean Bias: -6.06 · Rmse: 11.19 |
| ifs-nemo | Global Mean Bias: -6.60 · Rmse: 10.89 |
| icon | Global Mean Bias: -5.92 · Rmse: 15.55 |
| CMIP6 MMM | Global Mean Bias: -3.08 |
Summary high
The figure presents the annual mean Surface Net Radiation climatology from CERES-EBAF observations and the corresponding biases for three high-resolution DestinE models (IFS-FESOM, IFS-NEMO, ICON) and the CMIP6 multi-model mean.
Key Findings
- All three high-resolution models exhibit a global mean negative bias in surface net radiation (-5.9 to -6.6 W/m2), indicating an overall deficit in energy reaching or remaining at the surface compared to observations.
- IFS-FESOM and IFS-NEMO display nearly identical spatial bias patterns (RMSE ~10.9-11.2 W/m2), demonstrating that surface radiation biases are dominated by their shared atmospheric component (IFS).
- ICON shows the highest spatial RMSE (15.55 W/m2), characterized by severe negative biases across the global oceans and widespread positive biases over major landmasses.
- All models, including the CMIP6 MMM, show pronounced positive biases in Eastern Boundary Upwelling Systems (e.g., off the coasts of Peru, Namibia, and California).
Spatial Patterns
Observations show maximum net surface radiation over tropical oceans and minima over highly reflective deserts (e.g., Sahara) and polar regions. Bias maps reveal that IFS-FESOM and IFS-NEMO have moderate negative biases over most oceans, interrupted by strong positive biases (>20 W/m2) in subtropical eastern ocean basins. ICON exhibits a much more polarized land-sea contrast, with intense negative biases pervasive across the Pacific, Atlantic, and Indian oceans, contrasted by widespread positive biases over North America, Eurasia, and Australia. The CMIP6 MMM shows a more muted bias field, though it still exhibits the Eastern Boundary positive biases and features a distinct positive bias band over the Southern Ocean, which is largely absent or negative in the high-resolution models.
Model Agreement
IFS-FESOM and IFS-NEMO agree very closely with each other due to their shared atmosphere. ICON diverges significantly from the IFS-based models, particularly in its strong land-sea bias dipole and higher spatial RMSE. The DestinE models individually show higher regional bias magnitudes than the CMIP6 MMM, although this is largely expected as the MMM benefits from multi-model error cancellation.
Physical Interpretation
The robust positive biases off the western coasts of South America, Africa, and North America are indicative of the classic 'stratocumulus problem' in climate modeling; under-representation of marine stratocumulus clouds allows excessive downwelling shortwave radiation to reach the surface. The widespread negative oceanic biases, particularly strong in ICON, suggest an overestimation of cloud fraction or cloud optical depth in trade cumulus and deep convective regions, or biases in clear-sky downwelling longwave fluxes. ICON's strong positive biases over land may stem from an underestimation of continental cloud cover or erroneously low surface albedo specifications.
Caveats
- The CMIP6 MMM's lower global mean bias (-3.17 W/m2) is partially an artifact of error cancellation among its constituent models, making it an imperfect baseline for evaluating individual model performance.
- Surface radiation in CERES-EBAF is derived from top-of-atmosphere fluxes and relies on radiative transfer algorithms and reanalysis atmospheric states, introducing observational uncertainty, particularly over highly reflective surfaces like snow and ice.
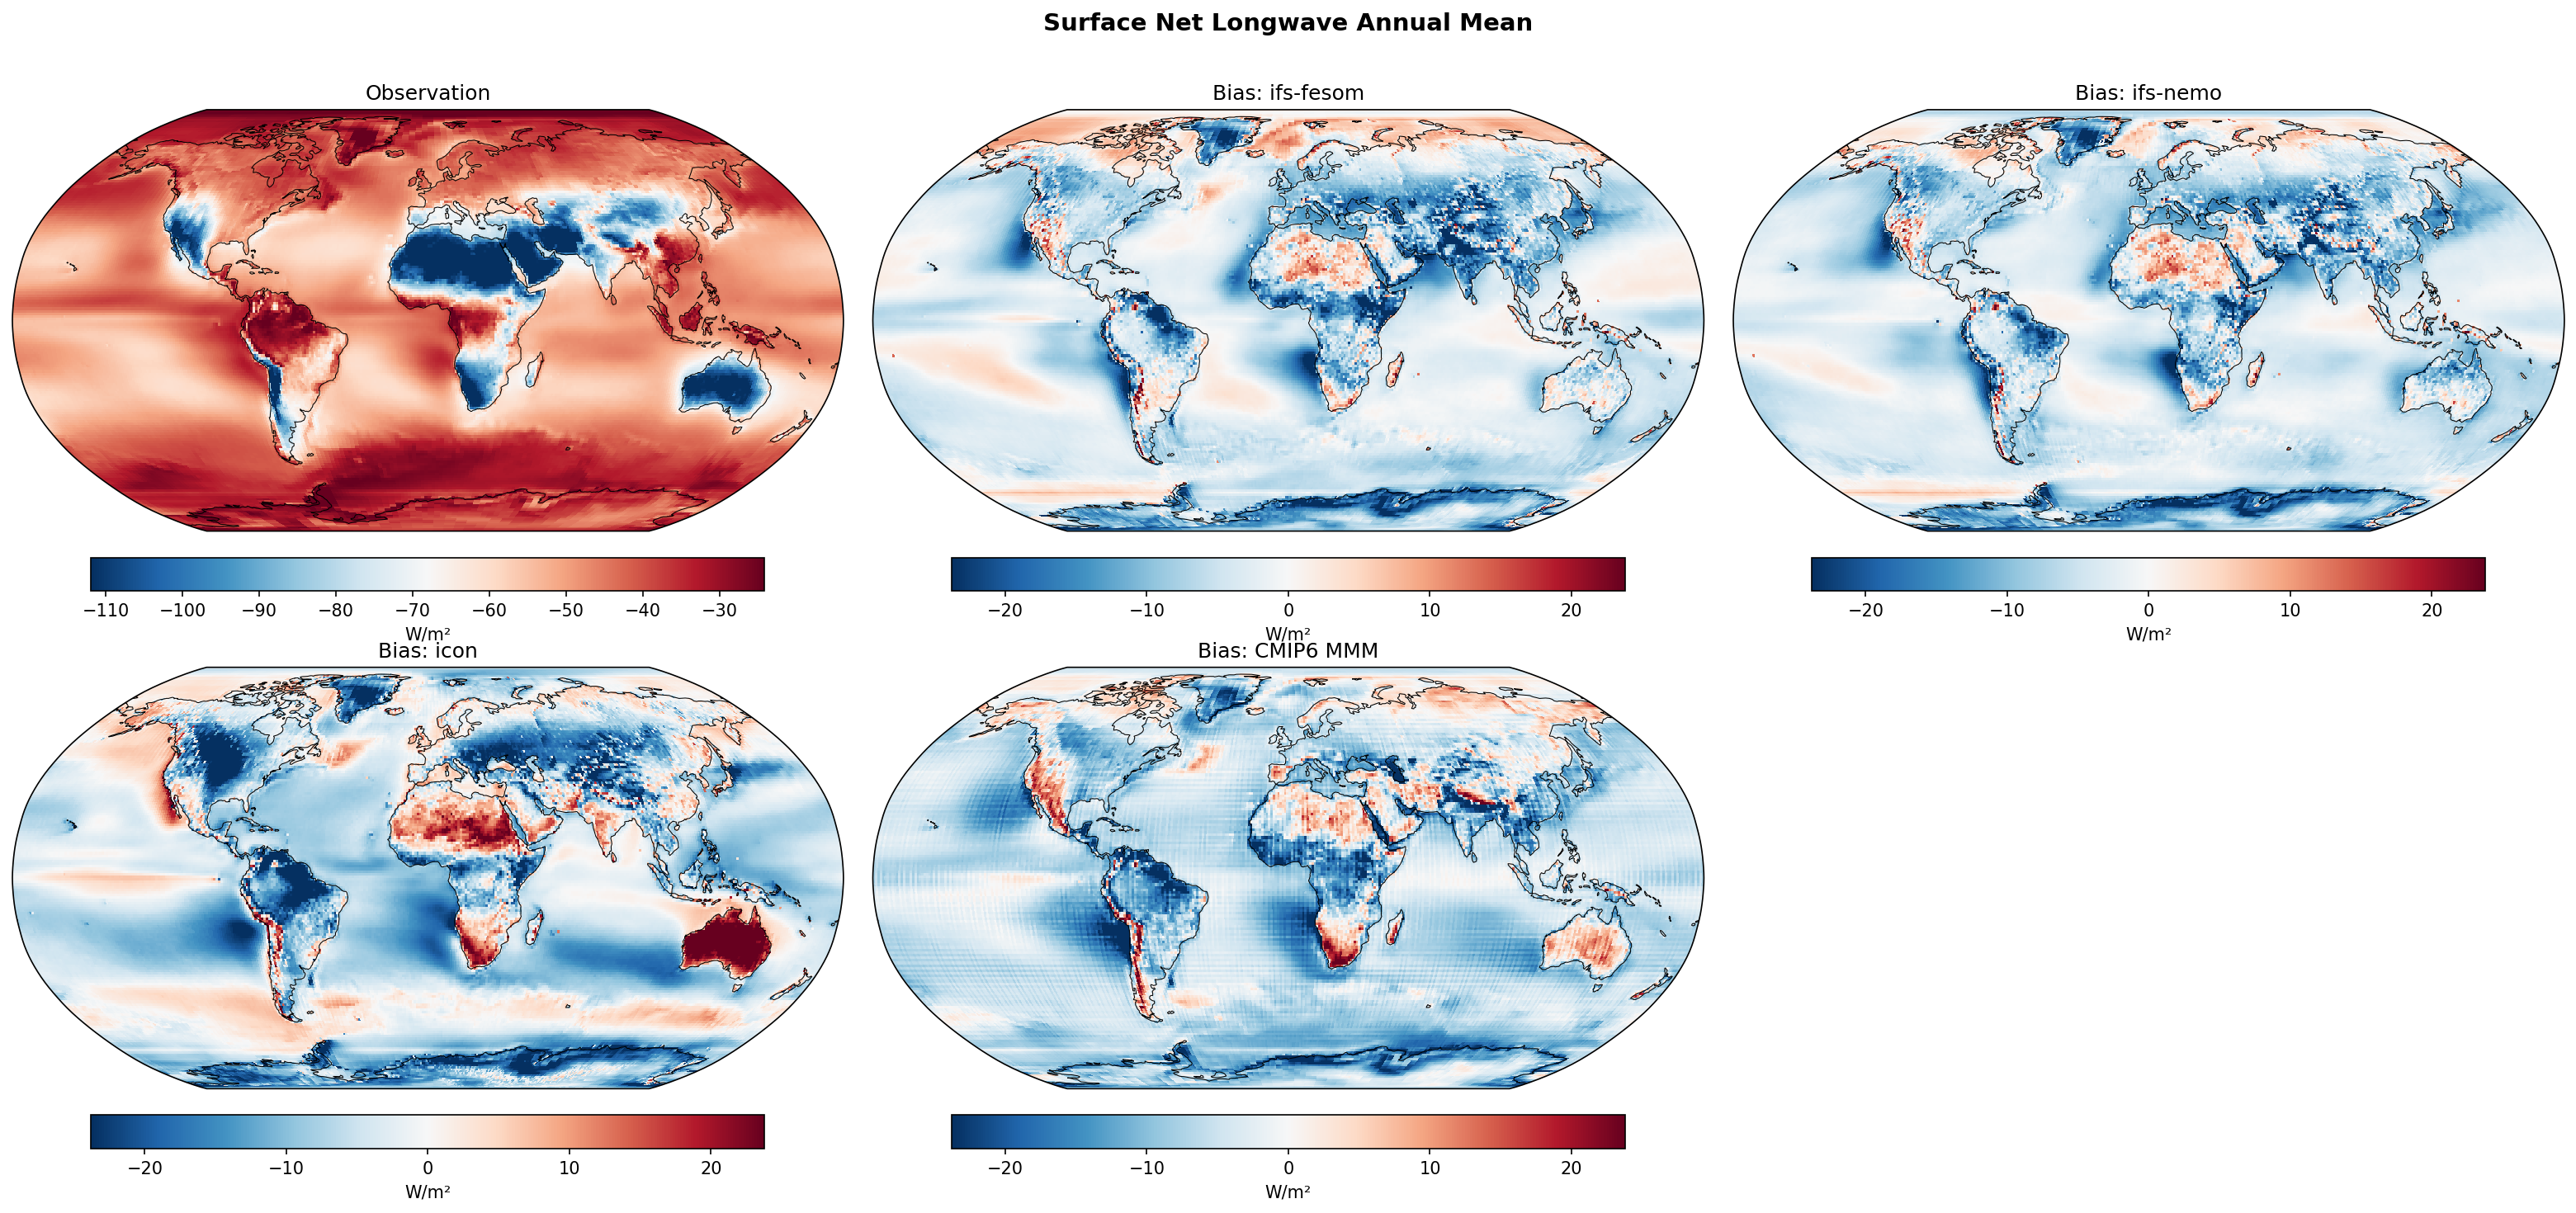
Surface Net Longwave Annual Bias
| Variables | rst, rlt, rstcs, rltcs, rss, rls, rsscs, rlscs, rsds, rlds, tas |
|---|---|
| Models | ifs-fesom, ifs-nemo, icon, CMIP6 MMM |
| Reference Dataset | CERES_EBAF |
| Units | W/m2 |
| Period | 1990–2014 |
| ifs-fesom | Global Mean Bias: -4.42 · Rmse: 7.95 |
| ifs-nemo | Global Mean Bias: -4.77 · Rmse: 7.58 |
| icon | Global Mean Bias: -4.79 · Rmse: 10.52 |
| CMIP6 MMM | Global Mean Bias: -5.72 |
Summary high
The figure illustrates the annual mean surface net longwave radiation climatology from CERES EBAF and the corresponding biases for three high-resolution DestinE models and the CMIP6 multi-model mean.
Key Findings
- All models exhibit a global mean negative bias in surface net longwave radiation (ranging from -4.4 to -6.0 W/m²), indicating excessive net longwave cooling at the surface.
- IFS-NEMO and IFS-FESOM show lower RMSEs (~7.6-7.9 W/m²) compared to ICON (10.5 W/m²) and CMIP6 MMM, demonstrating improved spatial patterns despite persistent regional errors.
- ICON displays severe negative biases over tropical rainforests (Amazon, Congo) and strong positive biases over the Southern Ocean, leading to its higher RMSE.
- All models systematically show positive biases over major arid regions, including the Sahara, Arabian Peninsula, and Australian deserts.
Spatial Patterns
Widespread negative biases dominate the tropical and subtropical oceans across all models. The IFS models exhibit pronounced negative biases in eastern boundary upwelling systems (e.g., off Peru and Namibia). ICON features stark negative anomalies over tropical landmasses (South America, Africa, Maritime Continent) and a broad positive bias over the Southern Ocean. Positive biases are consistent across models in arid desert regions.
Model Agreement
Models universally agree on a global mean negative bias and positive biases over North African and Middle Eastern deserts. However, they diverge significantly in the Southern Ocean (ICON is strongly positive, IFS models are weakly negative) and over tropical land (ICON shows extreme negative biases not present in the IFS models). IFS-NEMO performs best in terms of overall RMSE.
Physical Interpretation
Negative biases in net surface longwave (excessive cooling) generally stem from insufficient atmospheric downwelling longwave radiation, pointing to deficits in atmospheric moisture or cloud cover. For the IFS models, the localized negative biases in upwelling regions highlight an underestimation of marine stratocumulus clouds. In ICON, the massive negative biases over the Amazon and Congo suggest severe underestimations of deep convective cloud cover or atmospheric column moisture. Positive biases over deserts may result from cold surface temperature anomalies (reducing upwelling longwave emission) or uncertainties in the radiative forcing of dust aerosols.
Caveats
- Surface net longwave radiation biases combine errors from both upwelling (surface temperature/emissivity) and downwelling (clouds/moisture/aerosols) components, complicating attribution without analyzing individual fluxes.
- Observational uncertainties in CERES EBAF surface fluxes are highest over land and polar regions due to challenges in retrieving cloud-base heights and boundary-layer thermodynamic profiles.
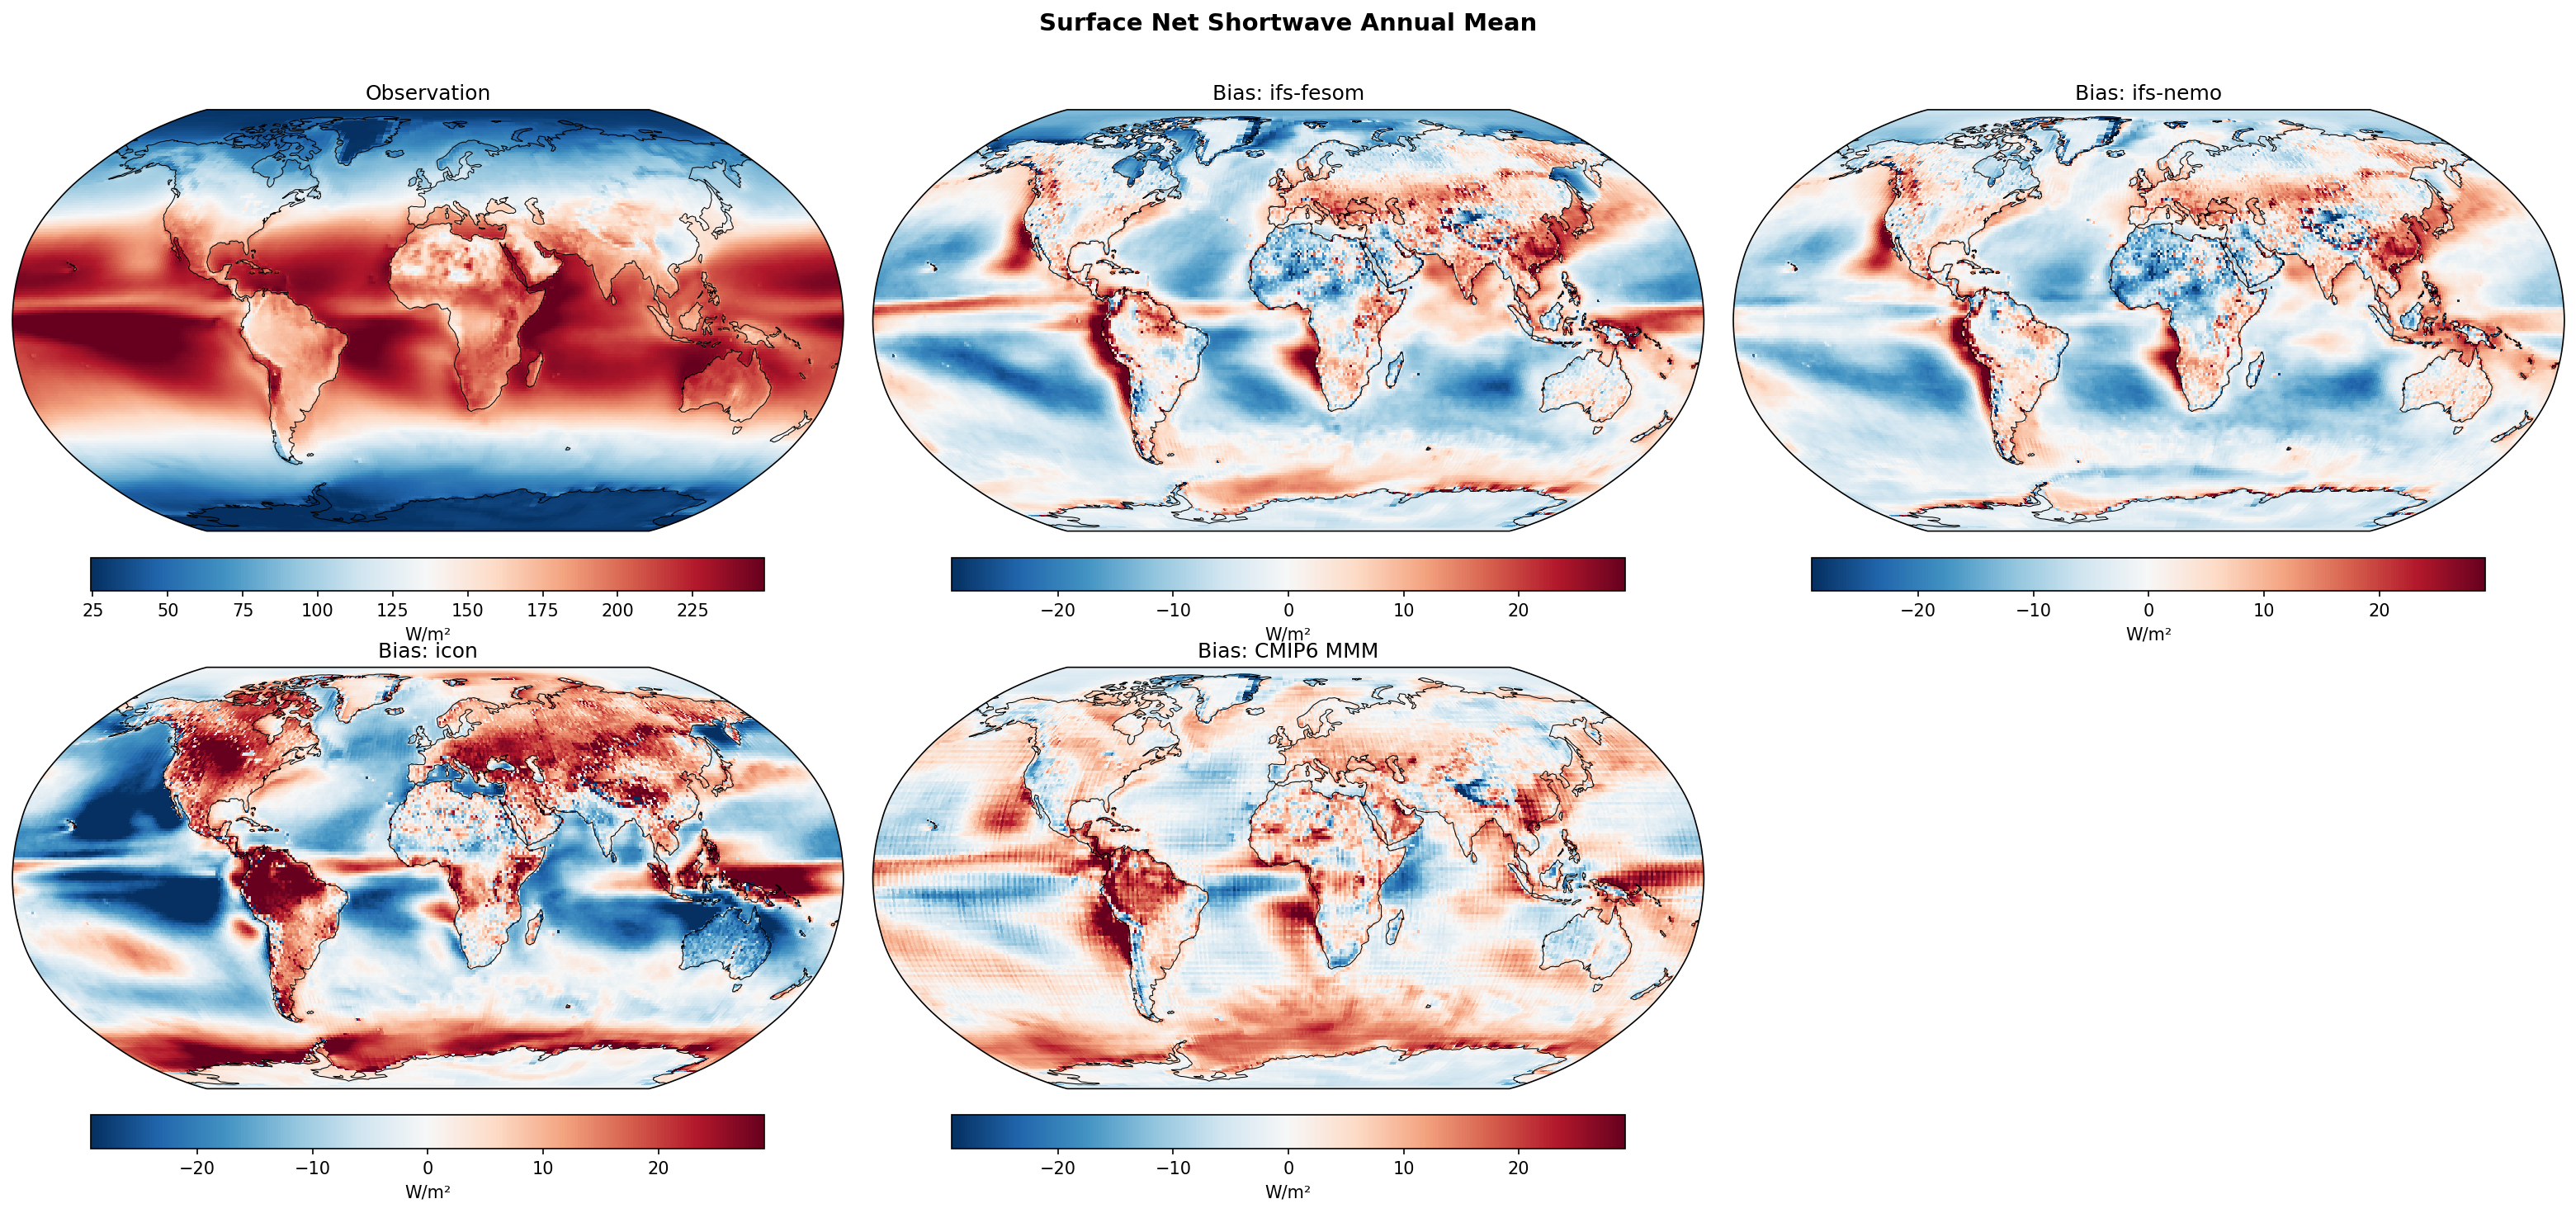
Surface Net Shortwave Annual Bias
| Variables | rst, rlt, rstcs, rltcs, rss, rls, rsscs, rlscs, rsds, rlds, tas |
|---|---|
| Models | ifs-fesom, ifs-nemo, icon, CMIP6 MMM |
| Reference Dataset | CERES_EBAF |
| Units | W/m2 |
| Period | 1990–2014 |
| ifs-fesom | Global Mean Bias: -1.64 · Rmse: 10.87 |
| ifs-nemo | Global Mean Bias: -1.82 · Rmse: 9.64 |
| icon | Global Mean Bias: -1.13 · Rmse: 15.90 |
| CMIP6 MMM | Global Mean Bias: 2.64 |
Summary high
The figure evaluates the annual mean surface net shortwave radiation climatology, revealing systematic biases largely driven by cloud representations across both high-resolution DestinE models and the CMIP6 ensemble.
Key Findings
- All models persistently underestimate marine stratocumulus clouds in eastern boundary upwelling systems, resulting in strong positive shortwave biases.
- The DestinE models (IFS, ICON) reverse the classic CMIP6 positive bias over the Southern Ocean, exhibiting instead a negative bias due to excessive cloud shading.
- ICON displays severe positive biases over nearly all land masses and strong negative biases over tropical oceans, resulting in the highest RMSE (~15.9 W/m²) despite a small global mean bias.
Spatial Patterns
Pronounced positive biases (excess radiation) are localized in stratocumulus regions off the western coasts of the Americas and Africa. Strong negative biases (deficient radiation) trace the ITCZ and SPCZ in the high-resolution models. Over the Southern Ocean, CMIP6 MMM shows a widespread positive bias, while the DestinE models (especially ICON) show extensive negative biases. ICON uniquely features intense positive biases across most major continents.
Model Agreement
All models agree on the positive bias in stratocumulus zones. However, there is a stark divergence over the Southern Ocean between the DestinE models (negative bias) and the CMIP6 MMM (positive bias). The two IFS-based models exhibit very similar spatial patterns and lower RMSEs (~9.6-10.9 W/m²), whereas ICON diverges significantly with much larger regional biases that compensate to yield a small global mean error.
Physical Interpretation
Surface shortwave biases are primarily governed by cloud parameterizations. The ubiquitous positive bias in coastal upwelling zones stems from the models' inability to maintain extensive, shallow marine boundary layer clouds. The negative bias in the DestinE models over the Southern Ocean suggests that microphysical adjustments aimed at increasing supercooled liquid water (to fix the known CMIP6 deficit) have over-thickened these clouds. ICON's pronounced land biases likely relate to deficient boundary layer cloud formation or excessively low land surface albedo.
Caveats
- Surface net shortwave biases conflate errors in cloud attenuation (downwelling shortwave) and surface albedo; identifying the exact source requires analyzing downwelling fluxes and albedo separately.
- Observational uncertainty in CERES-EBAF derived surface fluxes, particularly under complex cloud regimes over the Southern Ocean, may influence the exact magnitude of the evaluated biases.
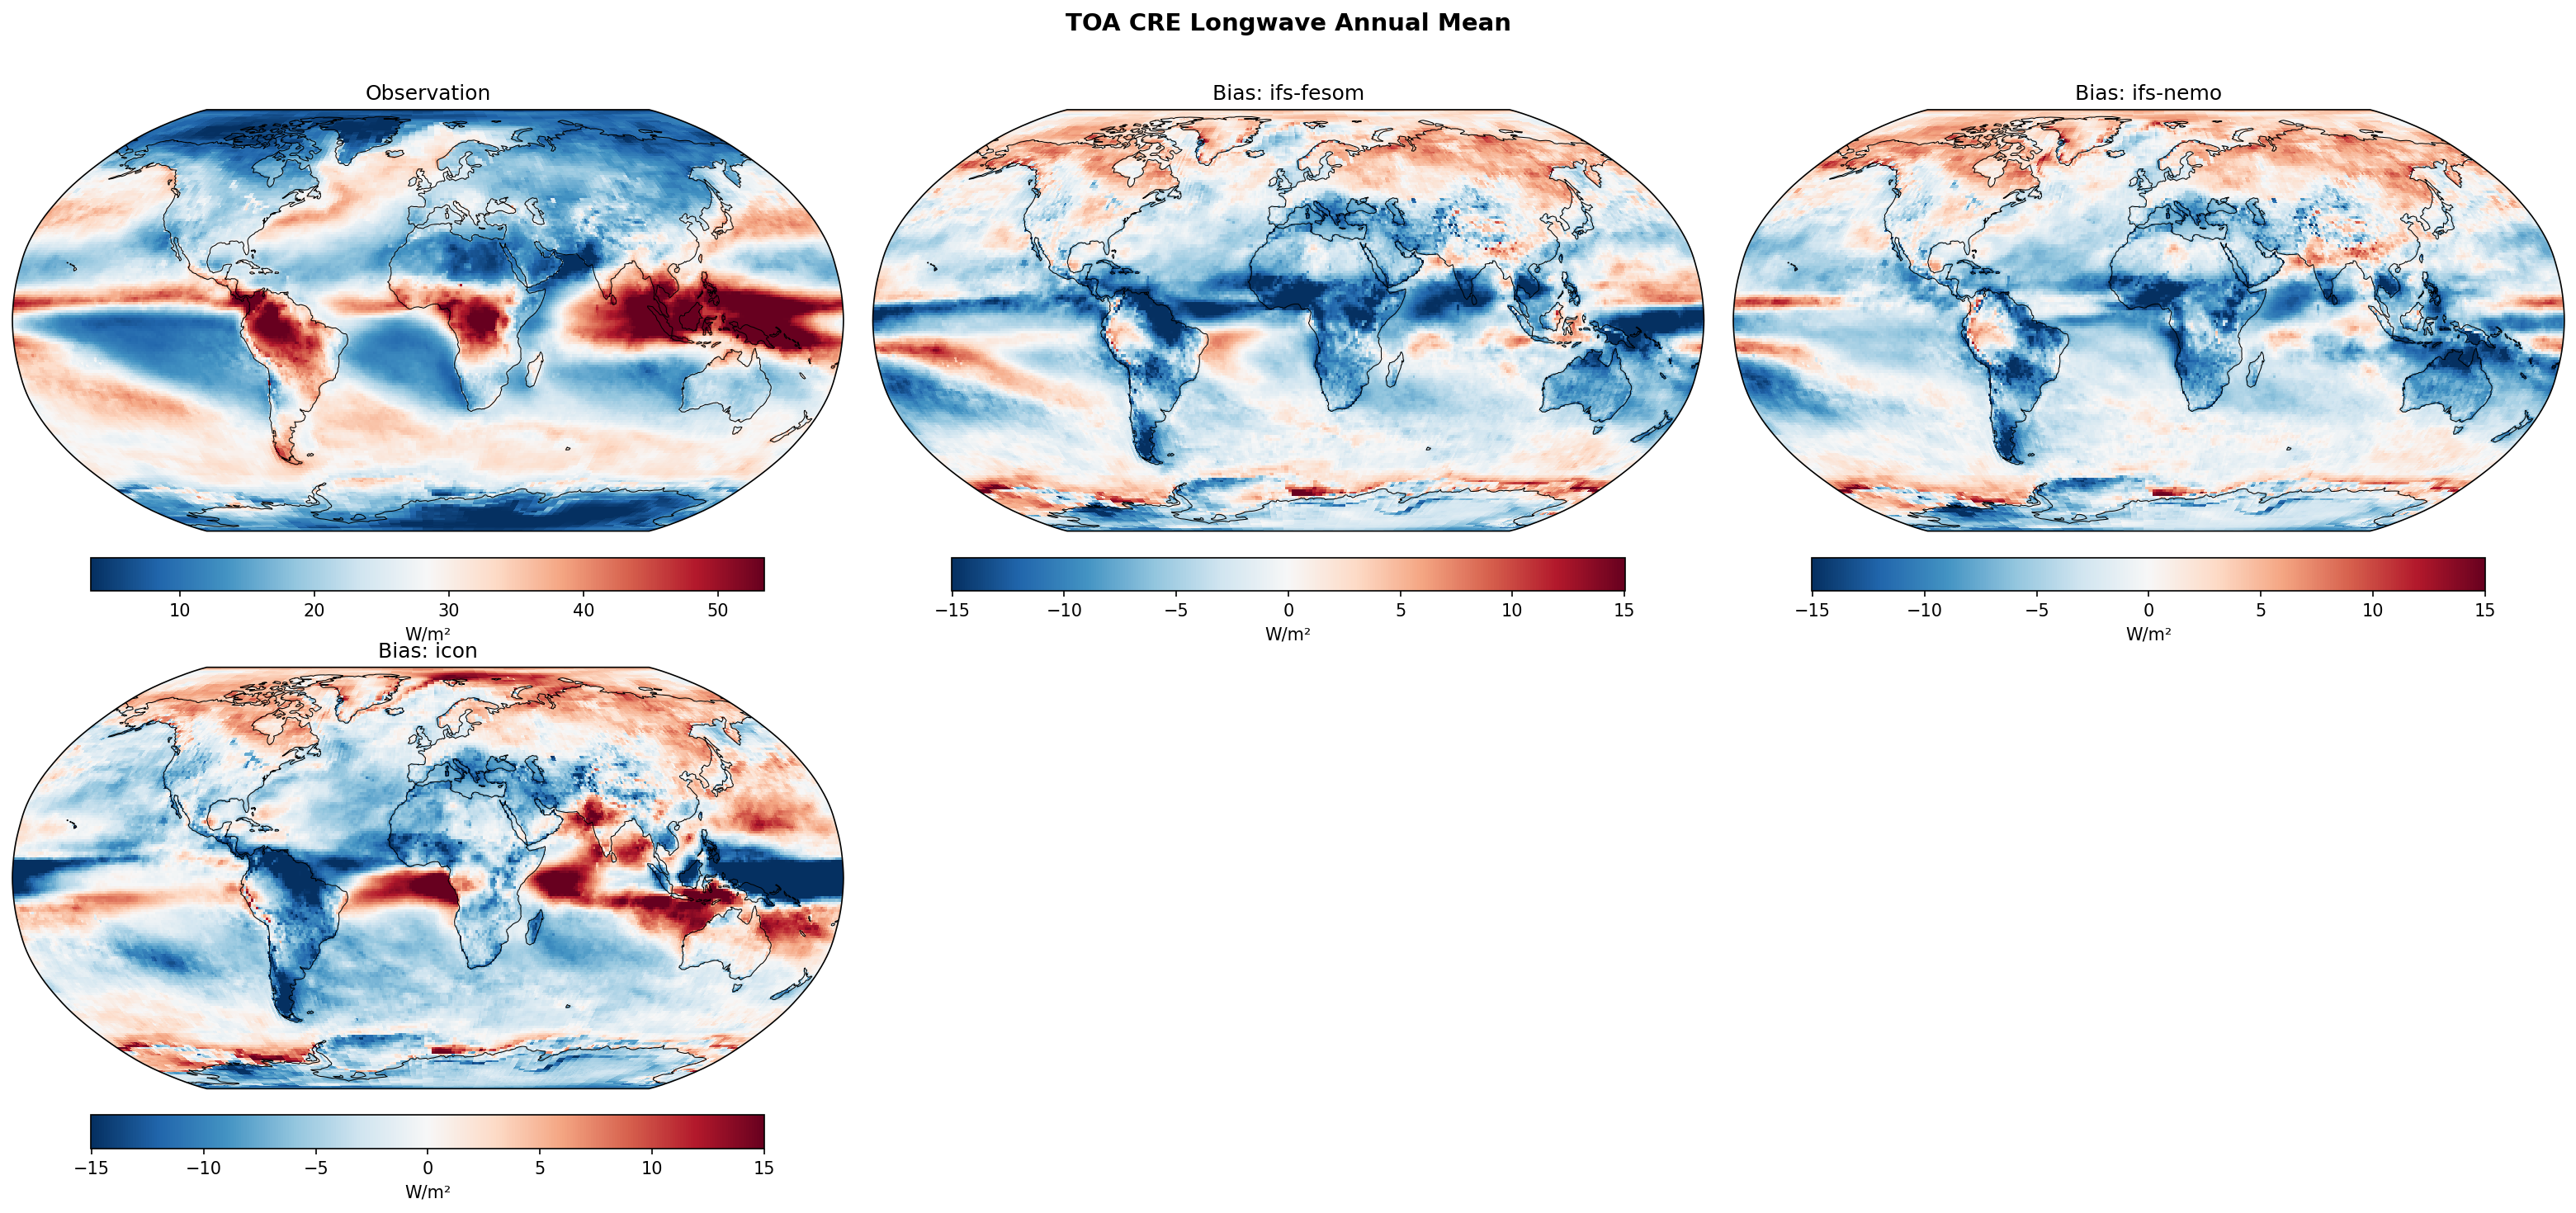
TOA CRE Longwave Annual Bias
| Variables | rst, rlt, rstcs, rltcs, rss, rls, rsscs, rlscs, rsds, rlds, tas |
|---|---|
| Models | ifs-fesom, ifs-nemo, icon |
| Reference Dataset | CERES_EBAF |
| Units | W/m2 |
| Period | 1990–2014 |
| ifs-fesom | Global Mean Bias: -3.04 · Rmse: 6.26 |
| ifs-nemo | Global Mean Bias: -2.82 · Rmse: 5.60 |
| icon | Global Mean Bias: -2.16 · Rmse: 7.57 |
Summary high
The figure displays the annual mean Top of Atmosphere (TOA) Longwave Cloud Radiative Effect (LW CRE) from CERES observations alongside bias maps for three high-resolution models (IFS-FESOM, IFS-NEMO, ICON).
Key Findings
- All three models exhibit an overall negative global mean bias in LW CRE, indicating a systematic underestimation of longwave cloud radiative warming, particularly within deep convective regions.
- The IFS-based models (FESOM and NEMO) show highly correlated spatial bias patterns, characterized by widespread underestimation of LW CRE across the ITCZ and mid-latitude storm tracks.
- ICON achieves the lowest global mean bias (-2.16 W/m²) but possesses the highest RMSE (7.57 W/m²), a consequence of strong, spatially compensating regional biases in the tropics.
Spatial Patterns
Observations highlight maximum LW CRE (>40 W/m²) over the Indo-Pacific warm pool, the Amazon basin, the Congo, and the ITCZ, corresponding to high, deep convective clouds. IFS-FESOM and IFS-NEMO exhibit pervasive negative biases (exceeding -15 W/m²) over these exact tropical convective regions and mid-latitude oceanic storm tracks, contrasting with slight positive biases over high-latitude land and subtropical oceans. ICON displays a severe negative bias band strictly along the equator in the Pacific and Maritime Continent, immediately flanked by intense positive biases in the northern Indian Ocean, tropical Atlantic, and off-equatorial Pacific.
Model Agreement
IFS-FESOM and IFS-NEMO agree strongly in their spatial bias distribution, consistent with their shared atmospheric model. ICON diverges dramatically in the tropics, exhibiting a much larger spatial variance and distinct dipole error structures. Consequently, IFS-NEMO performs best in terms of RMSE (5.60 W/m²), while ICON shows the most significant spatial disagreement with observations despite a lower global mean error.
Physical Interpretation
Longwave CRE is primarily governed by high, cold clouds (e.g., deep convective cores and their anvils, and mid-latitude frontal clouds) that trap outgoing longwave radiation. The widespread negative biases in the IFS models imply an underrepresentation of high cloud fraction or cloud tops that are too low and warm compared to reality. ICON's stark dipole biases in the tropics point to structural issues in the spatial organization of deep convection, likely indicating a misplaced, overly narrow, or split ITCZ.
Caveats
- Errors in LW CRE can arise from compensating errors between cloud fraction, cloud top height, and cloud emissivity; distinguishing the exact cause requires evaluating vertical cloud profiles.
- Observational uncertainties in CERES clear-sky flux derivations can introduce small artifacts into the observed CRE, though these are likely smaller than the pronounced model biases shown.
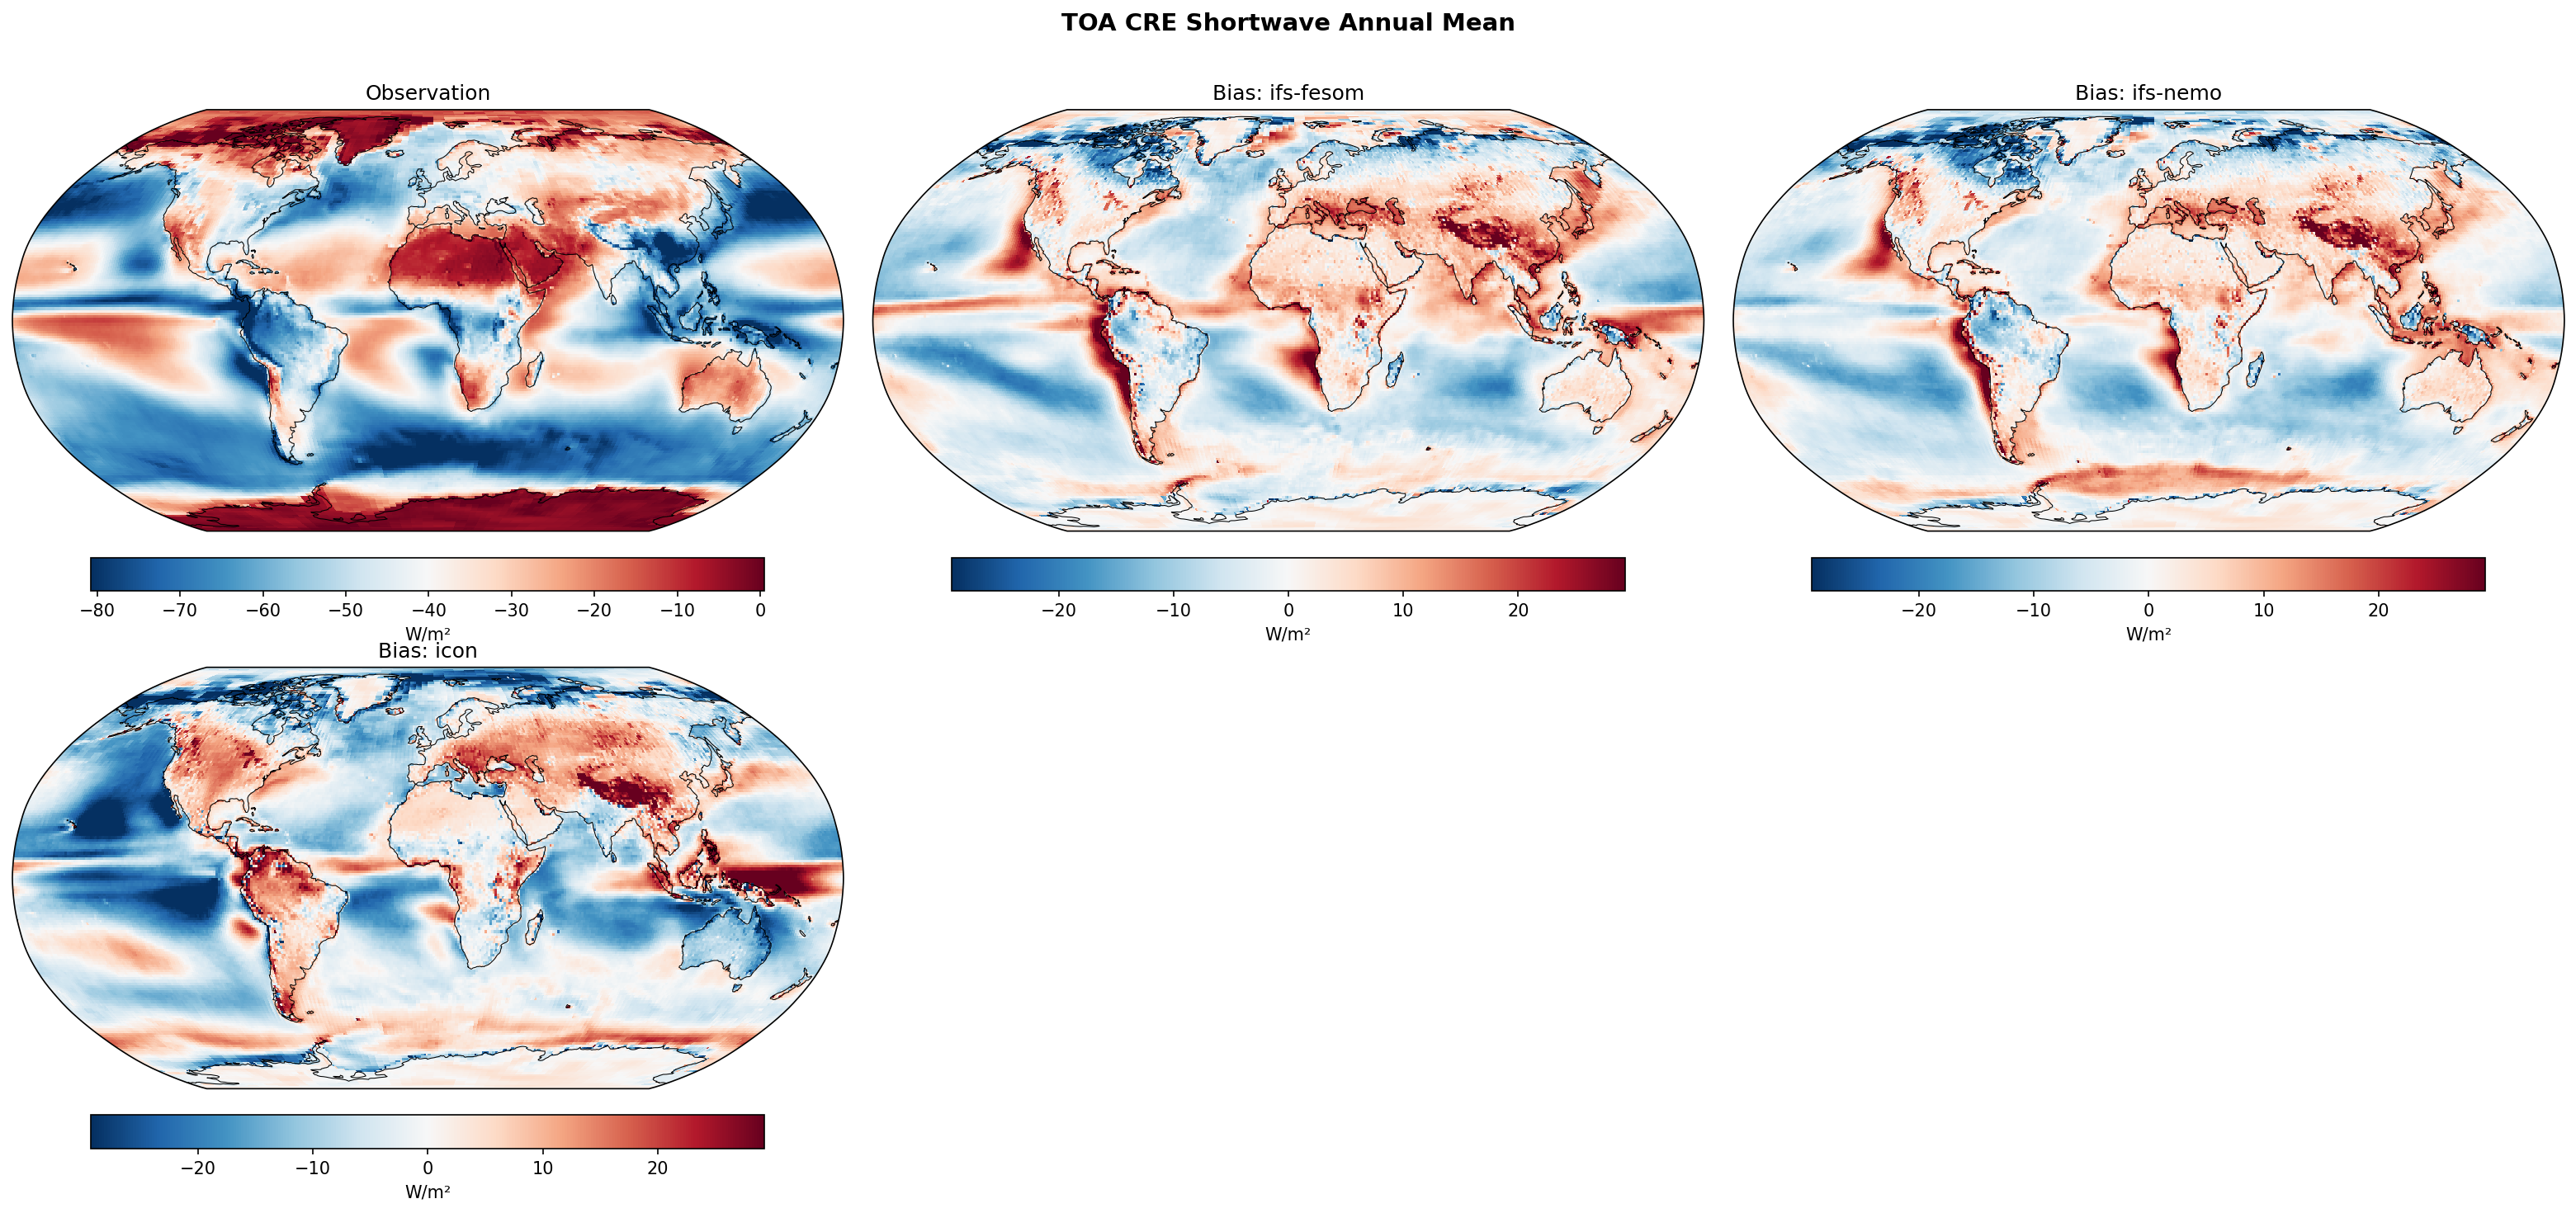
TOA CRE Shortwave Annual Bias
| Variables | rst, rlt, rstcs, rltcs, rss, rls, rsscs, rlscs, rsds, rlds, tas |
|---|---|
| Models | ifs-fesom, ifs-nemo, icon |
| Reference Dataset | CERES_EBAF |
| Units | W/m2 |
| Period | 1990–2014 |
| ifs-fesom | Global Mean Bias: 0.14 · Rmse: 9.78 |
| ifs-nemo | Global Mean Bias: -0.33 · Rmse: 9.26 |
| icon | Global Mean Bias: -2.98 · Rmse: 12.94 |
Summary high
This figure evaluates the Annual Mean Top of Atmosphere (TOA) Shortwave Cloud Radiative Effect (SW CRE) simulated by three high-resolution DestinE models against CERES observations, highlighting regional biases in cloud representation.
Key Findings
- All three models systematically underestimate shortwave cloud cooling (positive bias) over marine stratocumulus regions off the western coasts of continents.
- The ICON model significantly overestimates cloud cooling (negative bias) across the tropical oceans, Maritime Continent, and the Southern Ocean, leading to the highest RMSE (12.9 W/m²) and a pronounced global mean bias (-2.98 W/m²).
- IFS-FESOM and IFS-NEMO display nearly identical bias patterns and lower RMSEs (~9.3-9.8 W/m²), effectively balancing regional biases to achieve a near-zero global mean bias.
Spatial Patterns
Observations exhibit strong negative SW CRE (cloud cooling) over the ITCZ, Western Pacific warm pool, mid-latitude storm tracks, and stratocumulus decks. In the model bias maps, prominent positive biases (red, indicating insufficient cloud reflection) are visible over eastern boundary upwelling regions (e.g., off Peru, Namibia, California) and across broad mid-latitude landmasses (Europe, North America, Asia). Conversely, negative biases (blue, excessive cloud reflection) dominate the tropical deep convective regions, which are exceptionally severe in the ICON model. The Southern Ocean shows a strong negative bias in ICON but more localized, mixed biases in the IFS models.
Model Agreement
There is striking agreement between the two IFS-based models (FESOM and NEMO), which share virtually identical spatial biases and comparable error statistics. ICON diverges significantly, exhibiting much stronger negative SW CRE biases in the tropics and Southern Ocean, indicating that it simulates overly reflective or overly extensive clouds in these regions compared to the IFS models.
Physical Interpretation
The persistent positive bias in marine stratocumulus regions reflects a widespread model difficulty in capturing boundary layer inversions and associated low-cloud fractions, a bias that high horizontal resolution alone does not resolve. Negative biases in the tropics suggest overly active deep convection, excessive cloud liquid/ice water path, or overly extensive anvil clouds. The strong positive biases over landmasses point to a deficit in convective triggering or boundary layer cloud formation, potentially tied to surface-atmosphere moisture fluxes.
Caveats
- SW CRE biases aggregate errors from cloud fraction, cloud optical thickness, and vertical overlap; this diagnostic alone cannot isolate which specific cloud property is deficient.
- CERES observational uncertainties can be larger in high latitudes over bright surfaces (like sea ice), which may complicate the interpretation of biases near the poles.
TOA Net Radiation Annual Bias
| Variables | rst, rlt, rstcs, rltcs, rss, rls, rsscs, rlscs, rsds, rlds, tas |
|---|---|
| Models | ifs-fesom, ifs-nemo, icon, CMIP6 MMM |
| Reference Dataset | CERES_EBAF |
| Units | W/m2 |
| Period | 1990–2014 |
| ifs-fesom | Global Mean Bias: -0.38 · Rmse: 7.78 |
| ifs-nemo | Global Mean Bias: -0.08 · Rmse: 7.21 |
| icon | Global Mean Bias: 0.09 · Rmse: 11.75 |
| CMIP6 MMM | Global Mean Bias: 0.58 |
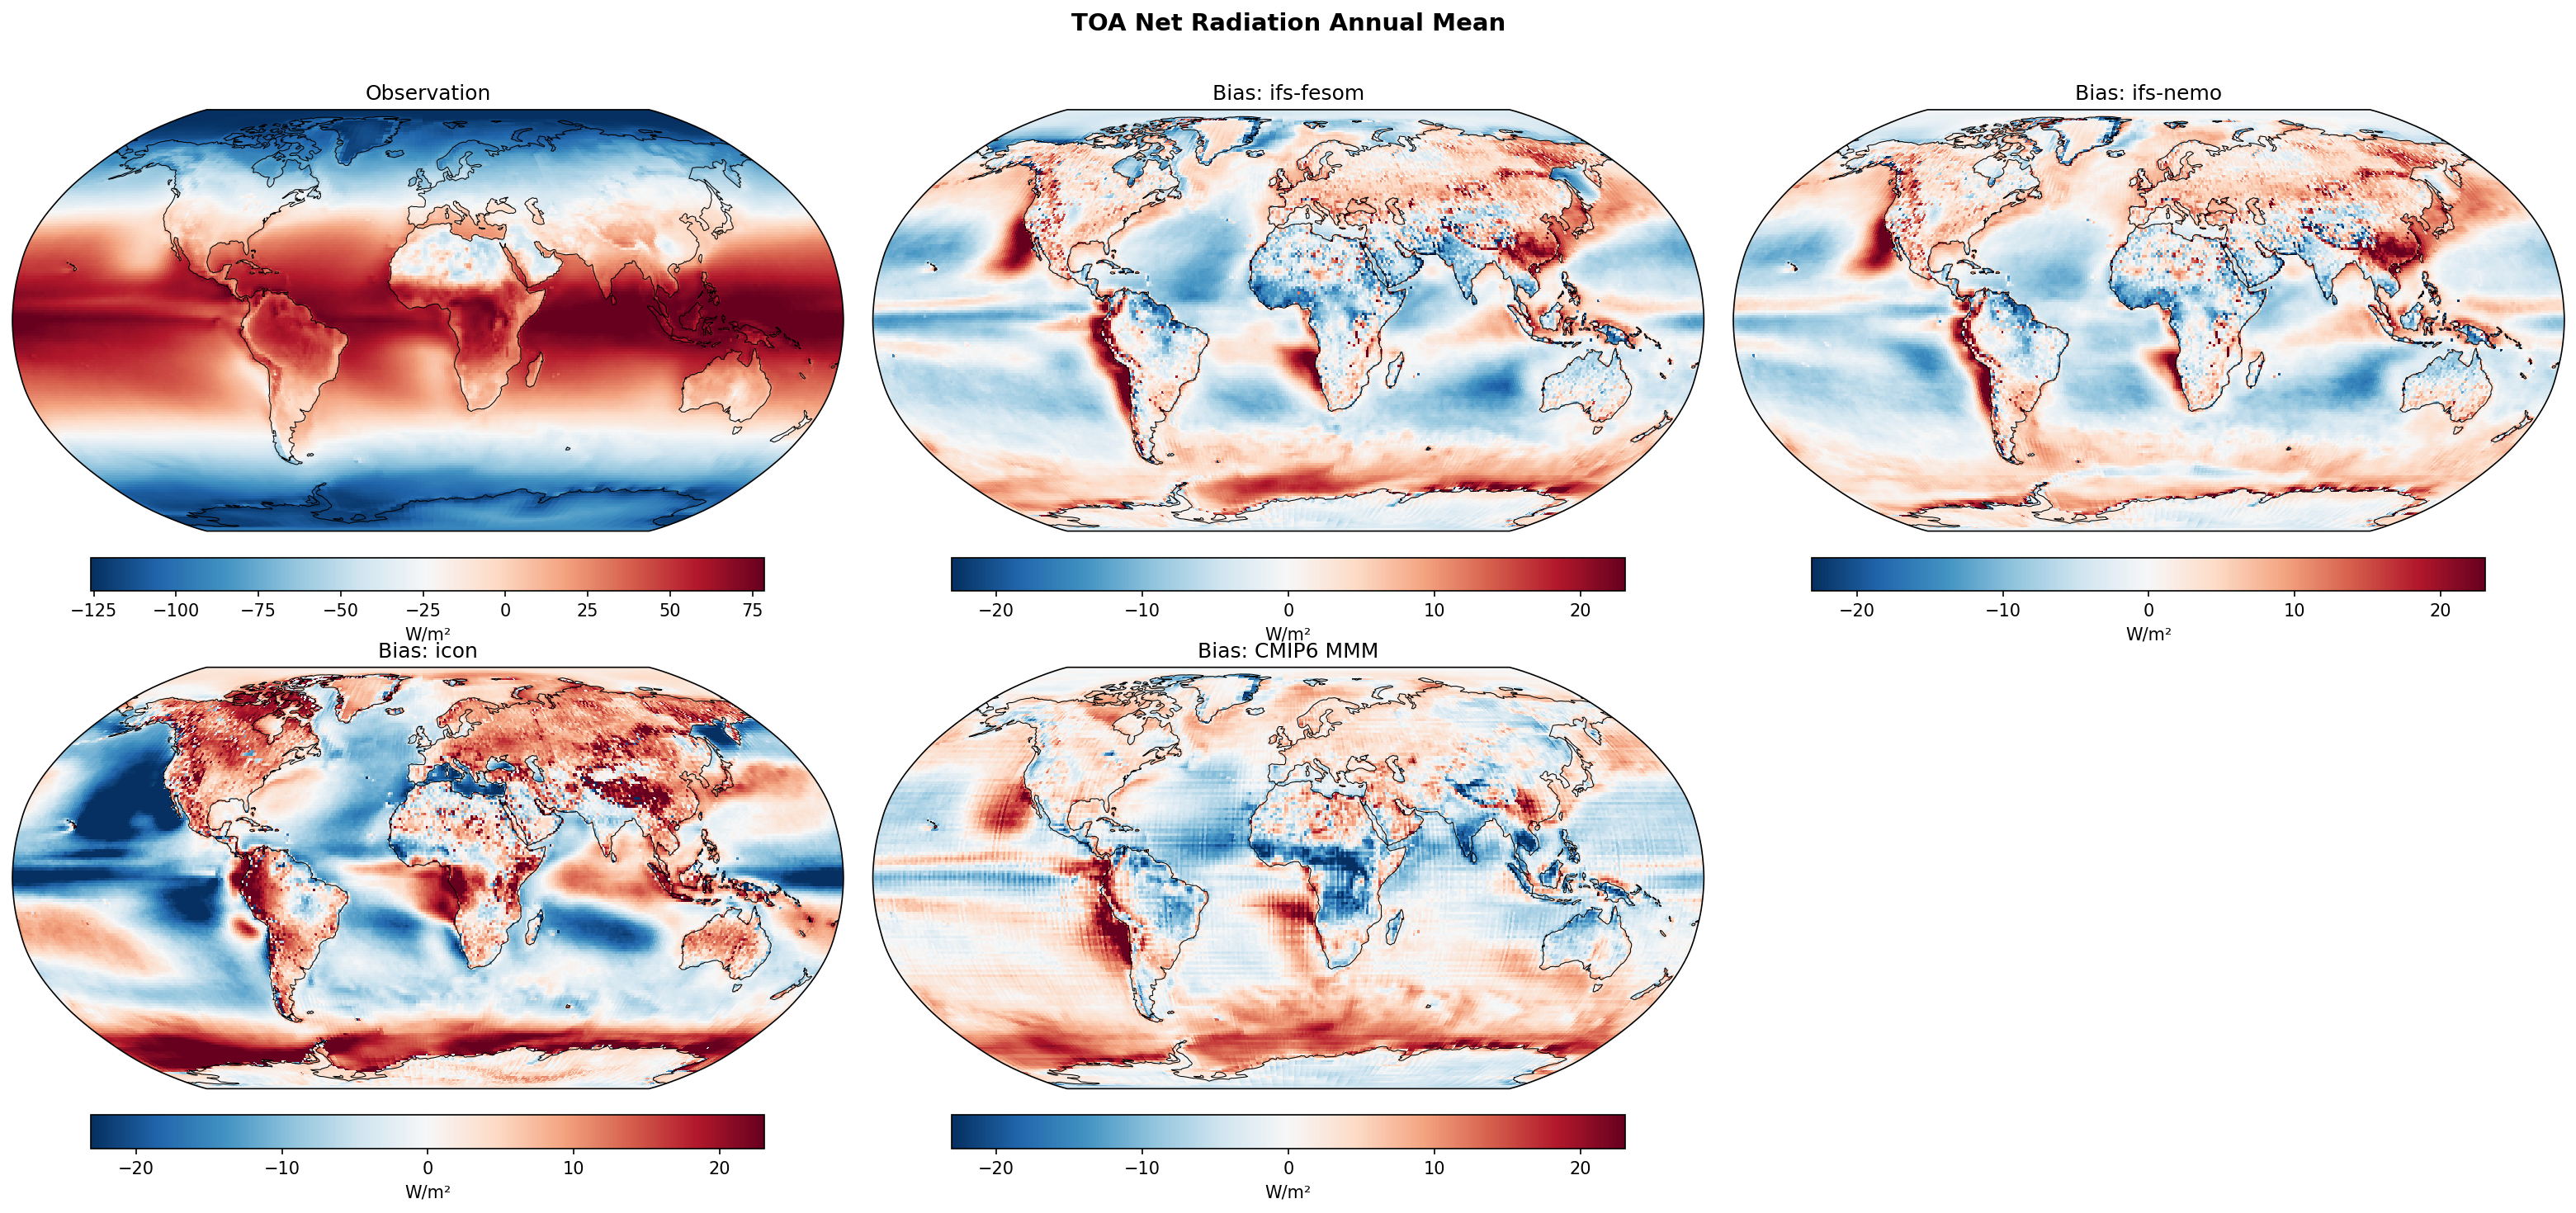
Summary high
The figure displays the annual mean Top of Atmosphere (TOA) net radiation climatology from observations and the corresponding bias maps for three high-resolution DestinE models (IFS-FESOM, IFS-NEMO, ICON) and the CMIP6 multi-model mean.
Key Findings
- IFS-NEMO and IFS-FESOM exhibit similar spatial biases (RMSE ~7.2-7.8 W/m²) that resemble the CMIP6 multi-model mean, featuring positive biases in stratocumulus regions and the Southern Ocean.
- ICON displays substantially larger regional errors (RMSE 11.75 W/m²), characterized by strong negative biases over broad oceanic regions and strong positive biases over landmasses.
- Despite large regional biases, all models maintain very low global mean biases (<0.6 W/m²), highlighting strong spatial compensation of radiation errors.
Spatial Patterns
Observations show the expected net energy gain in the tropics and loss at high latitudes. IFS-FESOM, IFS-NEMO, and the CMIP6 MMM share widespread positive biases over eastern boundary marine stratocumulus decks (off California, Peru, Namibia) and the Southern Ocean. These are contrasted by negative biases over the ITCZ, South Pacific Convergence Zone, and the Indo-Pacific warm pool. ICON exhibits a sharply different and amplified pattern, with severe negative biases dominating the tropical and subtropical oceans, and intense positive biases over major landmasses like the Amazon, central Africa, and high-mountain Asia.
Model Agreement
IFS-FESOM and IFS-NEMO show high agreement with each other, reflecting their shared atmospheric component, and generally outperform ICON. The close resemblance between the IFS models and the CMIP6 MMM suggests that increasing the horizontal resolution to ~5 km has not fundamentally resolved longstanding structural biases in the radiation budget. ICON diverges significantly from the other models, showing a unique and higher-magnitude error structure.
Physical Interpretation
TOA net radiation biases are predominantly driven by cloud radiative effects. The positive biases over eastern ocean basins and the Southern Ocean in the IFS and CMIP6 models suggest an underestimation of cloud albedo (e.g., insufficient or overly thin stratocumulus and supercooled liquid clouds), leading to excessive shortwave absorption. Conversely, negative biases in the deep tropics indicate that convective cores or anvil clouds are likely too extensive or optically thick, reflecting too much incoming solar radiation. ICON's strong land-ocean bias contrast points to potential issues with surface albedo, land-atmosphere coupling, or disparate cloud formation regimes over land versus ocean.
Caveats
- TOA net radiation is the residual of shortwave and longwave fluxes; compensating errors between SW and LW components can obscure underlying physical model deficiencies unless analyzed separately.
- The CMIP6 MMM is a smoothed ensemble average, which naturally reduces noise and extremes compared to the single-realization, high-resolution DestinE simulations.