Evaluation Global Mean Time Series CMIP6
CMIP6 Multi-Model Mean Context
Comparison with CMIP6 ensemble mean from 10 members.
Contributing models: ACCESS-ESM1-5, AWI-CM-1-1-MR, CNRM-CM6-1, CNRM-ESM2-1, EC-Earth3, GISS-E2-1-G, INM-CM5-0, IPSL-CM6A-LR, MPI-ESM1-2-LR, MRI-ESM2-0
Synthesis
Related diagnostics
10m U Wind Global Mean Time Series

| Variables | avg_10u |
|---|---|
| Models | ifs-fesom, ifs-nemo, icon |
| Reference Dataset | ERA5 |
| Units | m/s |
| Period | 1990–2014 |
Summary high
Global mean time series of 10m zonal wind (U wind) from 1990 to 2015, comparing high-resolution DestinE models (IFS-FESOM, IFS-NEMO, ICON) against ERA5 observations and the CMIP6 multi-model mean.
Key Findings
- ICON exhibits a systematic positive (westerly) bias of approximately 0.2 to 0.3 m/s in the global mean compared to ERA5.
- IFS-NEMO shows a persistent negative (easterly) bias of roughly 0.1 m/s relative to observations.
- IFS-FESOM performs best among the high-resolution models, closely tracking the long-term mean state of both ERA5 and the CMIP6 multi-model mean.
- Observations show a distinct decadal variability that is not temporally matched by the models, which is expected for free-running coupled simulations.
Spatial Patterns
While this is a global mean time series, the temporal dimension reveals strong, persistent offsets in the climatological mean state among the models. High-frequency (monthly) variance appears similar in amplitude across all models and observations, but the smoothed interannual signals highlight a wide spread in the baseline global zonal flow.
Model Agreement
Inter-model agreement is low regarding the mean state, with a roughly 0.4 m/s spread separating the most westerly-biased model (ICON) from the most easterly-biased model (IFS-NEMO). IFS-FESOM agrees well with the ERA5 mean state and the CMIP6 MMM baseline.
Physical Interpretation
The global mean 10m U wind is naturally negative due to the area-weighted dominance of tropical easterly trade winds over mid-latitude westerlies. The systematic positive bias in ICON implies that it simulates either overly weak tropical easterlies or excessively strong mid-latitude westerlies. Conversely, IFS-NEMO's negative bias suggests overly strong trades or weak westerlies. These offsets are likely tied to differences in atmospheric boundary layer drag formulations, sub-grid orographic parameterizations, or the simulated latitudinal positions of the mid-latitude eddy-driven jets.
Caveats
- Because these are free-running historical coupled simulations, they generate their own internal climate variability; therefore, they are not expected to capture the specific chronological timing of decadal shifts seen in ERA5.
- A globally averaged U wind metric can mask large, spatially compensating regional biases between the tropics and extratropics.
10m V Wind Global Mean Time Series

| Variables | avg_10v |
|---|---|
| Models | ifs-fesom, ifs-nemo, icon |
| Reference Dataset | ERA5 |
| Units | m/s |
| Period | 1990–2014 |
Summary high
This figure displays the area-weighted global mean time series of 10m meridional wind (V-wind), highlighting the annual mean offsets and the strong seasonal cycle amplitude for high-resolution models compared to ERA5 and the CMIP6 multi-model mean.
Key Findings
- The global mean 10m V-wind exhibits a pronounced seasonal cycle ranging from roughly -0.4 m/s to 0.8 m/s, driven by the seasonal migration of global atmospheric circulation patterns.
- IFS-FESOM shows excellent agreement with ERA5 for both the annual mean (~0.18 m/s) and the amplitude of the seasonal cycle.
- IFS-NEMO displays a systematic positive bias in the annual mean (~0.25 m/s), while ICON exhibits a systematic negative bias (~0.1 m/s) and overestimates the magnitude of the seasonal troughs.
Spatial Patterns
The temporal series is dominated by the annual cycle. Positive peaks (boreal summer) occur when cross-equatorial southerly flow into the Northern Hemisphere ITCZ is maximized. Negative troughs (boreal winter) correspond to enhanced northerly flow into the Southern Hemisphere. The net positive annual mean indicates a global asymmetry, driven by the mean position of the ITCZ being north of the equator.
Model Agreement
Inter-model agreement is moderate regarding the annual mean. IFS-FESOM closely tracks ERA5 observations. IFS-NEMO has a consistent positive offset, and ICON has a consistent negative offset compared to both ERA5 and the CMIP6 multi-model mean. All models capture the phase of the seasonal cycle accurately, though ICON slightly overestimates the boreal winter northerly extremes.
Physical Interpretation
The global mean V-wind is primarily governed by the position and strength of the Hadley circulation and the Intertropical Convergence Zone (ITCZ). The seasonal cycle reflects the interhemispheric mass transport as the ITCZ migrates across the equator. The net positive annual mean reflects the climatological position of the ITCZ at roughly 5°N, drawing southeast trade winds across the equator and yielding a net southerly global component.
Caveats
- A global mean of a vector wind component is highly susceptible to compensating errors; regional biases in opposite hemispheres or differing wind belts can cancel each other out.
- Small differences in the global mean (e.g., 0.1 m/s) may mask significant regional circulation errors that require spatial bias maps to properly identify.
2m Temperature Global Mean Time Series
| Variables | avg_2t |
|---|---|
| Models | ifs-fesom, ifs-nemo, icon |
| Reference Dataset | ERA5 |
| Units | K |
| Period | 1990–2014 |
Summary high
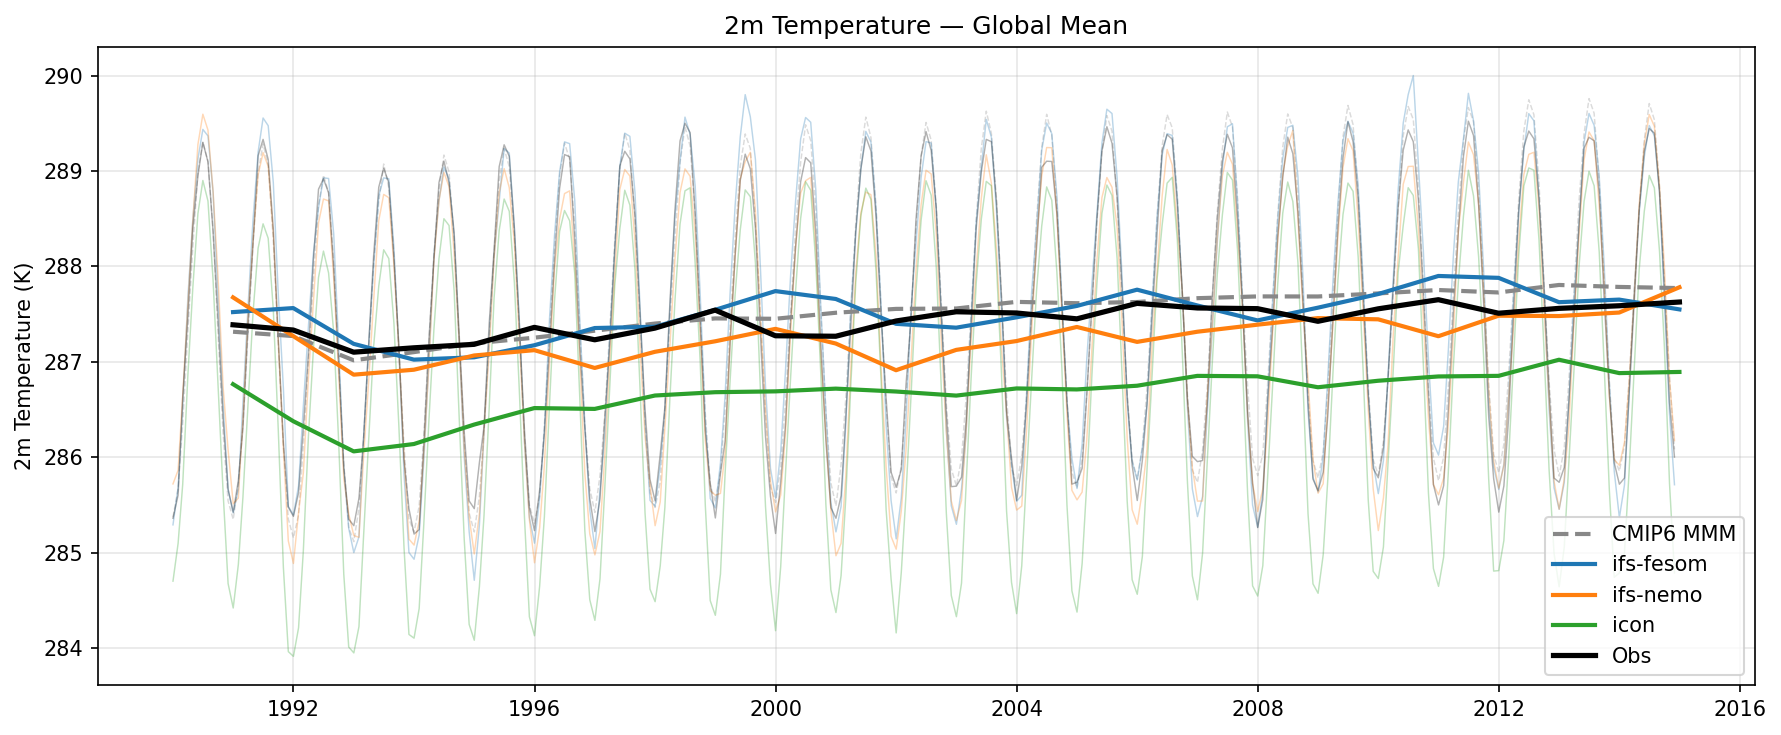
The figure displays the global mean 2m temperature time series from 1990 to 2014, showing both monthly values (seasonal cycle) and smoothed interannual variations for three high-resolution models compared to observations and the CMIP6 multi-model mean.
Key Findings
- IFS-FESOM shows excellent agreement with observations (ERA5) and the CMIP6 multi-model mean, accurately capturing both the climatological mean and the long-term trend.
- ICON exhibits a persistent and significant cold bias of approximately 0.5-1.0 K globally compared to observations.
- IFS-NEMO displays a slight cold bias (0.2-0.4 K) but generally tracks the interannual variability of the observations well.
Spatial Patterns
The time series reveals a distinct seasonal cycle superimposed on a long-term warming trend. A temporary cooling dip is visible around 1992-1993 across most datasets, corresponding to the climatic impact of the Mt. Pinatubo eruption. ICON's monthly time series (thin green line) shows particularly deep minima, indicating its cold bias is exacerbated during the global winter (Northern Hemisphere winter).
Model Agreement
IFS-FESOM and the CMIP6 MMM agree exceptionally well with the observational reference. IFS-NEMO is marginally colder, while ICON diverges significantly with a pronounced cold bias. Interannual variability is generally consistent across all models.
Physical Interpretation
The persistent global cold bias in ICON suggests a systematic offset in the global energy budget, potentially driven by excessive low cloud cover (higher planetary albedo), biases in aerosol forcing, or an overestimation of sea ice extent/surface albedo in polar regions. The excellent performance of IFS-FESOM indicates well-tuned atmospheric physics and surface coupling at high resolution.
Caveats
- Global mean metrics can mask large compensating regional biases; a near-zero global bias does not imply zero regional errors.
- The 25-year period is relatively short for robustly evaluating long-term climate sensitivity or low-frequency multi-decadal variability.
Surface Sensible Heat Flux Global Mean Time Series

| Variables | avg_ishf |
|---|---|
| Models | ifs-fesom, ifs-nemo, icon |
| Reference Dataset | ERA5 |
| Units | W/m2 |
| Period | 1990–2014 |
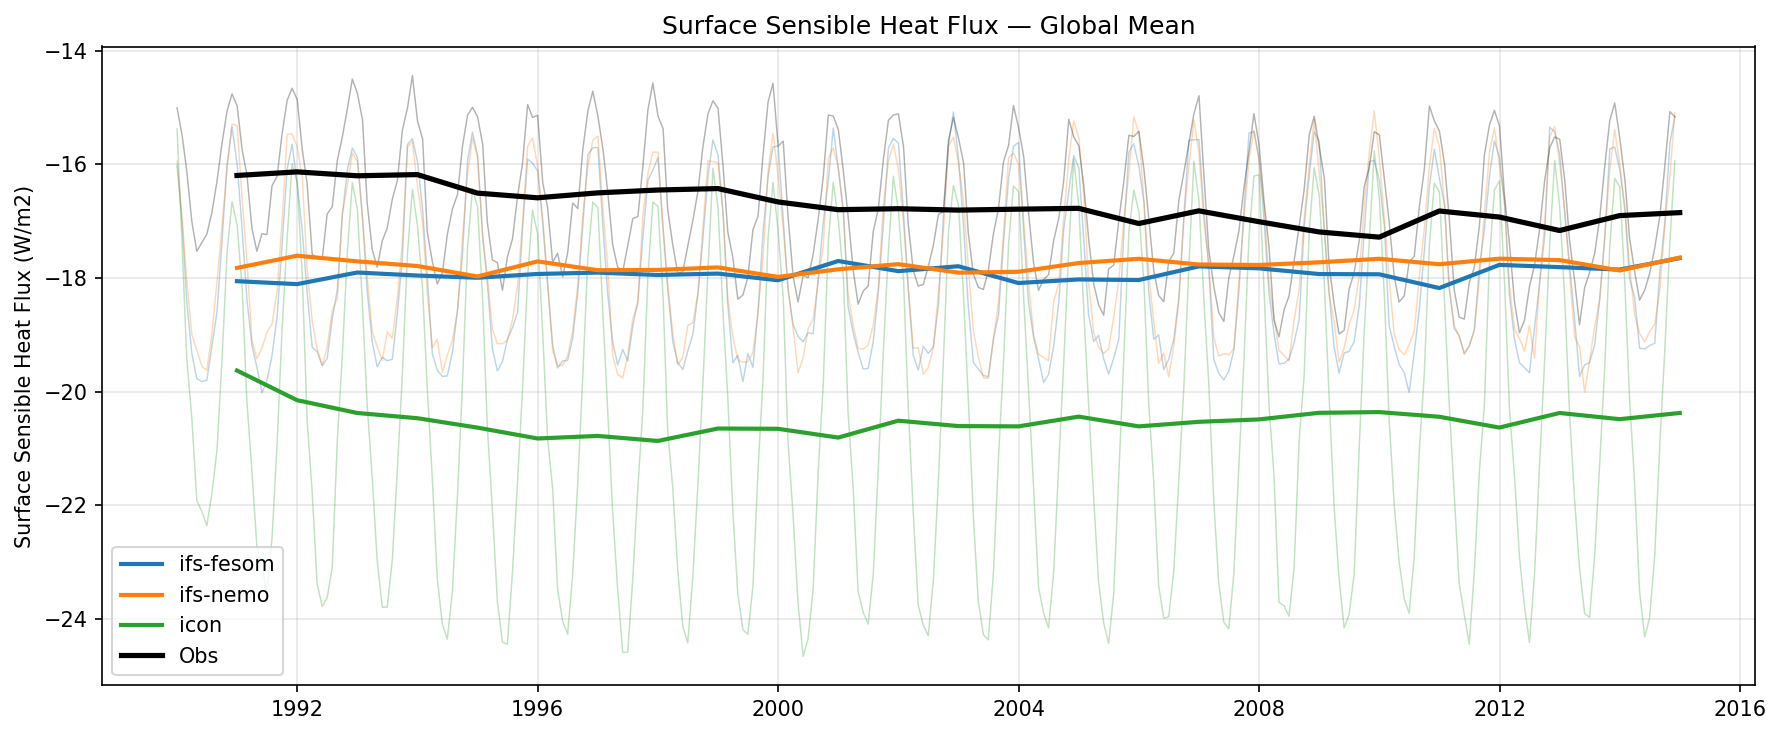
Summary high
The figure displays the global mean time series of surface sensible heat flux for three high-resolution models compared to ERA5 reanalysis from 1990 to 2015, highlighting both the smoothed annual means and the monthly seasonal cycles.
Key Findings
- All three models overestimate the magnitude of the global mean upward sensible heat flux (shown as more negative values) relative to ERA5.
- IFS-FESOM and IFS-NEMO exhibit similar behavior, with a moderate bias (~1.5 W/m2 more negative) and seasonal cycle amplitudes that closely parallel the reanalysis.
- ICON shows a pronounced negative bias (~3.5 W/m2) and a substantially exaggerated seasonal cycle amplitude compared to both the IFS-based models and ERA5.
Spatial Patterns
As a global mean time series, spatial patterns are aggregated; however, the temporal patterns show that while all models correctly capture the phasing of the global seasonal cycle, ICON's seasonal amplitude swings much wider (from roughly -16 to -24 W/m2) than ERA5 (roughly -14.5 to -19 W/m2).
Model Agreement
There is high agreement between IFS-FESOM and IFS-NEMO, which track each other closely in both mean state and variability, reflecting their shared atmospheric component. ICON diverges significantly, acting as an outlier in both annual mean bias and seasonal amplitude.
Physical Interpretation
The stronger upward sensible heat fluxes (more negative values) in the models imply simulated surface temperatures that are too warm relative to the overlying near-surface air, or excessively strong turbulent mixing in the boundary layer. ICON's exaggerated seasonal cycle strongly points to overly sensitive parameterizations in its land surface model or boundary layer scheme responding to seasonal changes in solar insolation.
Caveats
- Surface sensible heat flux is not directly assimilated but rather derived from parameterizations in ERA5, meaning the 'observational' baseline carries its own model-dependent uncertainties.
- Global mean metrics can obscure significant compensating regional biases, such as differing performance over land versus ocean.
Mean Sea Level Pressure Global Mean Time Series

| Variables | avg_msl |
|---|---|
| Models | ifs-fesom, ifs-nemo, icon |
| Reference Dataset | ERA5 |
| Units | Pa |
| Period | 1990–2014 |
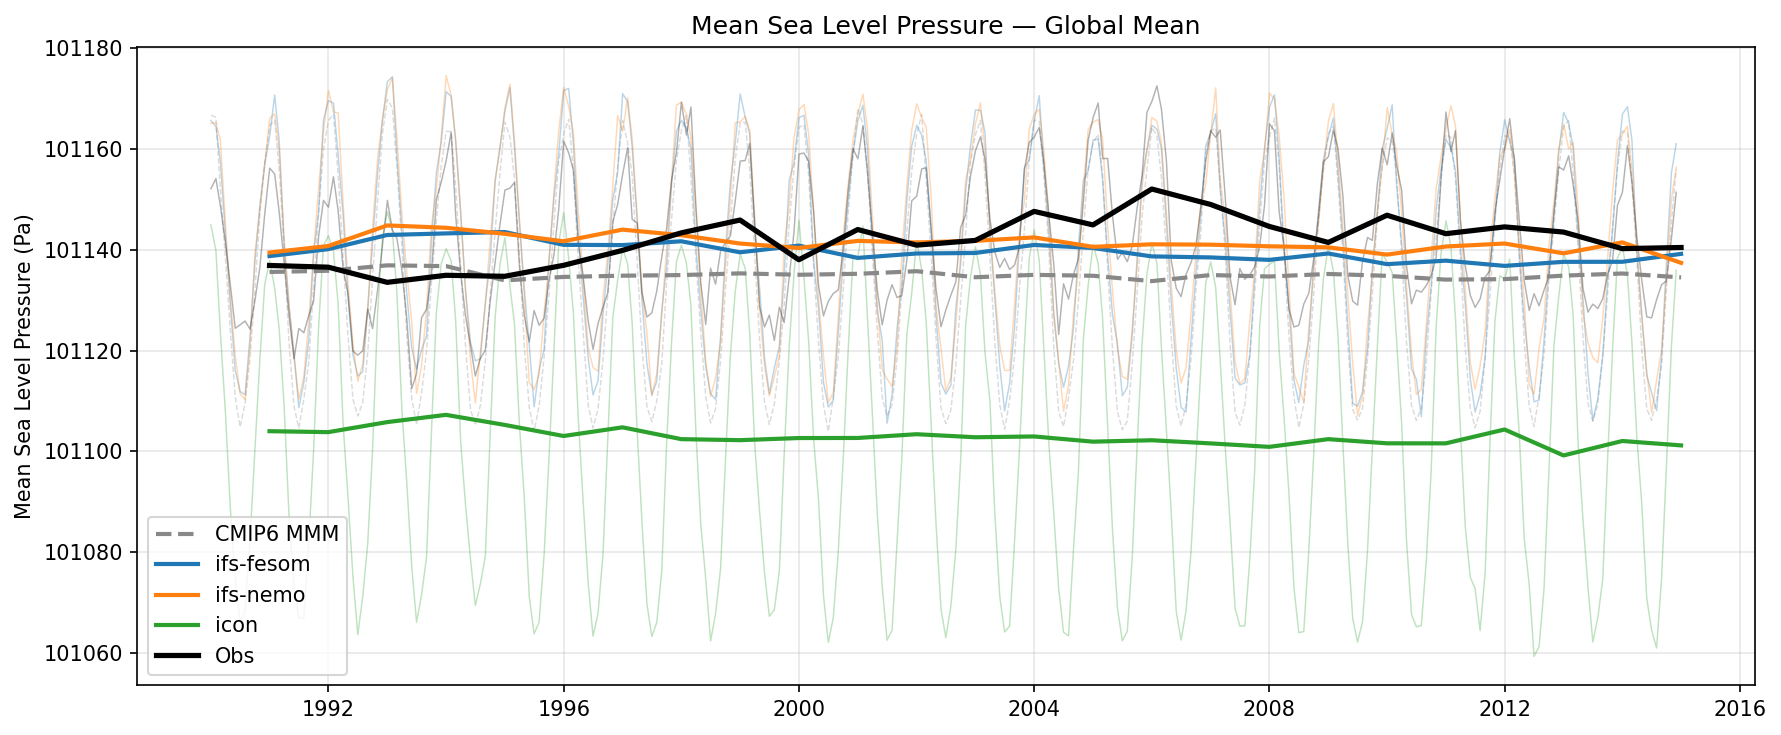
Summary high
The figure presents the 1990–2014 time series of global mean sea level pressure (MSLP), comparing the temporal evolution, interannual variability, and seasonal cycle amplitude of total atmospheric mass in high-resolution models against ERA5 and the CMIP6 multi-model mean.
Key Findings
- ICON exhibits a systematic negative bias of approximately 35–40 Pa in its baseline global mean MSLP compared to ERA5 and the IFS configurations.
- IFS-FESOM and IFS-NEMO accurately reproduce the climatological mean MSLP of ERA5, but their smoothed annual means exhibit less interannual and decadal variability than the reanalysis.
- All evaluated models overestimate the amplitude of the seasonal cycle of global MSLP, with ICON showing an amplitude (~80 Pa) roughly twice as large as ERA5 (~40 Pa).
Spatial Patterns
Temporally, the data is dominated by a strong seasonal cycle (shown by the thin lines) driven by global moisture fluctuations. The smoothed annual means (thick lines) reveal that ERA5 undergoes low-frequency decadal variability (e.g., rising from 1993 to 2006) that the free-running models remain generally too flat to capture, lacking similar internal variance.
Model Agreement
IFS-FESOM and IFS-NEMO are in excellent agreement with each other, both successfully capturing the long-term mean of ERA5 and the CMIP6 MMM. ICON is a distinct outlier among the high-resolution models due to its persistent negative mass offset and exaggerated seasonal cycle.
Physical Interpretation
Global mean MSLP is a proxy for total atmospheric mass. Because dry air mass is conserved, temporal fluctuations in global MSLP are primarily driven by changes in integrated atmospheric water vapor (moisture loading). The persistent low bias in ICON suggests either a lower prescribed dry air mass at initialization or a severe global dry bias. The overestimated seasonal amplitudes in the models indicate an exaggerated seasonal fluctuation in global atmospheric moisture compared to observations, likely linked to the hydrological cycle over Northern Hemisphere landmasses.
Caveats
- Global mean MSLP calculations are highly sensitive to the extrapolation methods used to reduce surface pressure to sea level over high topography, which can introduce artificial offsets.
- Different modeling centers may use slightly different constants for total dry atmospheric mass during initialization, creating baseline offsets (like ICON's) that are arbitrary and do not necessarily degrade dynamical performance.
Surface Downwelling Longwave Global Mean Time Series
| Variables | avg_sdlwrf |
|---|---|
| Models | ifs-fesom, ifs-nemo, icon |
| Reference Dataset | ERA5 |
| Units | W/m2 |
| Period | 1990–2014 |
Summary high
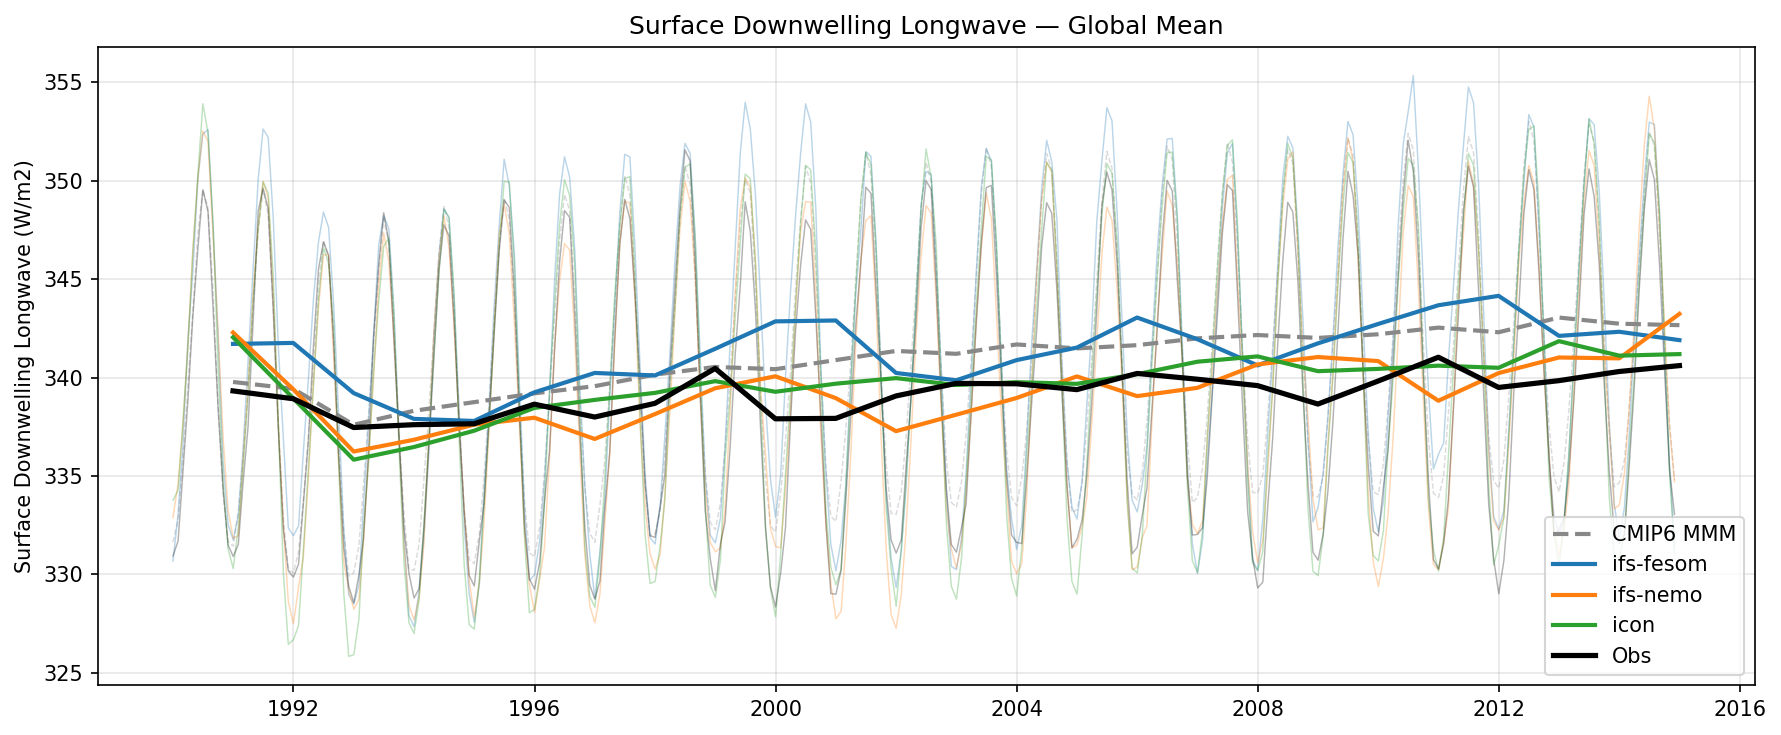
Global mean time series of surface downwelling longwave radiation from 1990–2014, comparing DestinE high-resolution models against ERA5 observations and the CMIP6 multi-model mean.
Key Findings
- ICON and IFS-NEMO accurately capture the observed global mean of ~339 W/m², improving upon the persistent positive bias present in the CMIP6 MMM.
- IFS-FESOM exhibits a positive drift throughout the simulated period, resulting in an overestimation of ~3-4 W/m² by 2014.
- All models correctly capture the transient reduction in downwelling longwave radiation following the 1991 Mount Pinatubo eruption.
Spatial Patterns
The temporal evolution is dominated by a strong global seasonal cycle with an amplitude of approximately 20-25 W/m². The smoothed annual means reveal a slight multi-decadal upward trend in observations, which is significantly exaggerated in IFS-FESOM and the CMIP6 MMM.
Model Agreement
ICON and IFS-NEMO show excellent agreement with observations in both mean state and interannual variability. In contrast, IFS-FESOM diverges from the other high-resolution models and observations after 2000, aligning more closely with the positively biased CMIP6 MMM.
Physical Interpretation
Surface downwelling longwave radiation is primarily controlled by lower tropospheric temperature, water vapor concentration, and low-level cloud cover. The positive bias in IFS-FESOM and CMIP6 MMM likely stems from an overestimation of boundary layer moisture or excessive optically thick low clouds. ICON and IFS-NEMO appear to better represent these thermodynamic and cloud-radiative processes at high resolution.
Caveats
- ERA5 surface radiative fluxes are model-derived reanalysis products rather than direct satellite observations (like CERES EBAF), introducing inherent model-dependent uncertainties.
- Global mean metrics can obscure compensating regional biases in cloud cover and atmospheric humidity.
Surface Downwelling Shortwave Global Mean Time Series

| Variables | avg_sdswrf |
|---|---|
| Models | ifs-fesom, ifs-nemo, icon |
| Reference Dataset | ERA5 |
| Units | W/m2 |
| Period | 1990–2014 |
Summary high
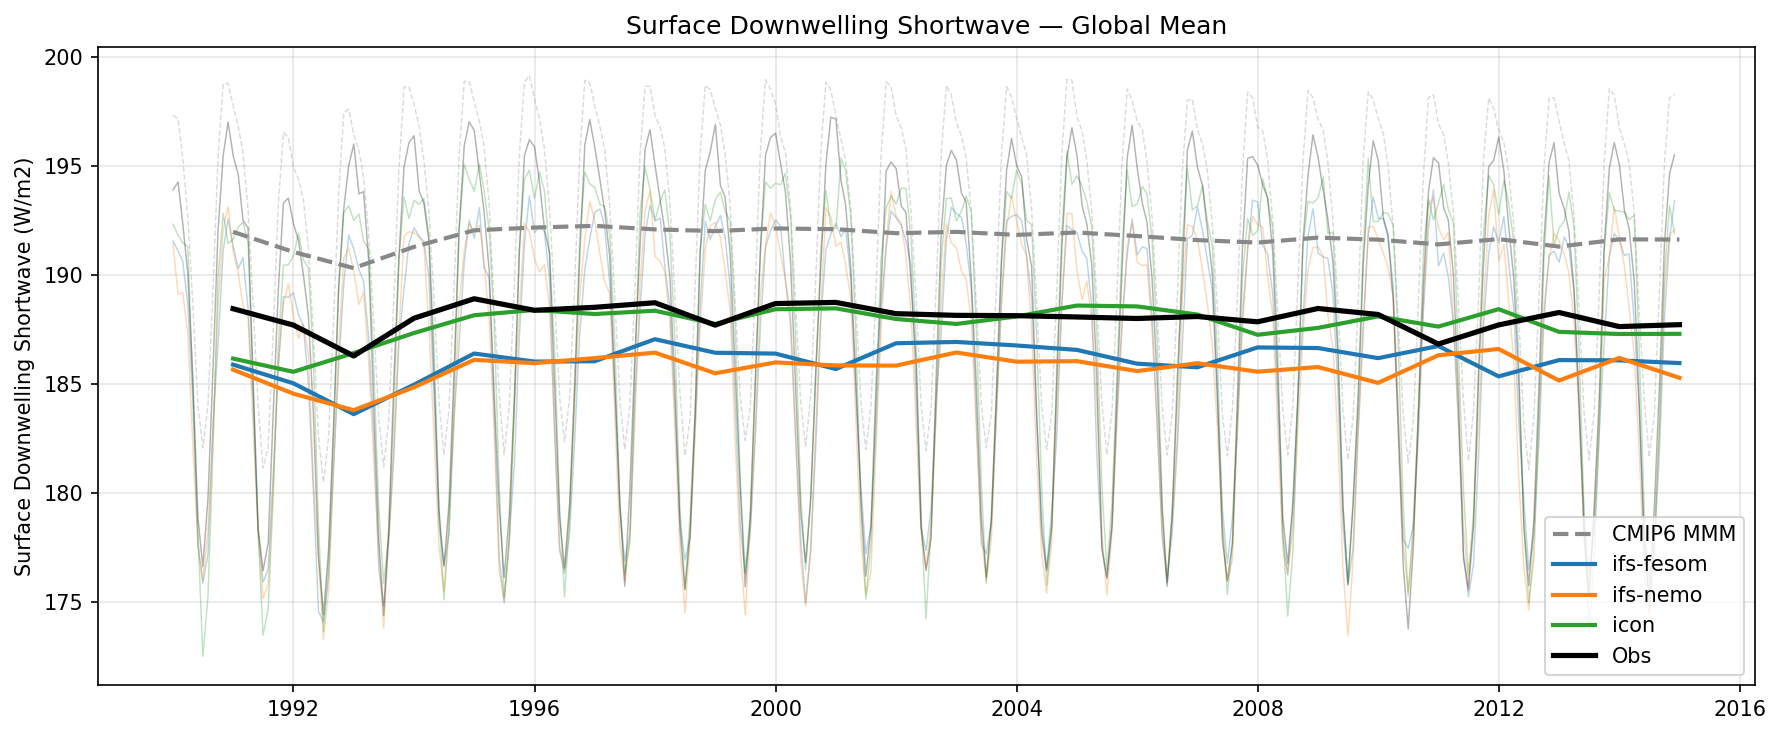
The figure displays the global mean time series of surface downwelling shortwave radiation from 1990 to 2014, highlighting the performance of high-resolution DestinE models against ERA5 reanalysis and the CMIP6 multi-model mean.
Key Findings
- The CMIP6 multi-model mean exhibits a systematic positive bias of approximately 3-4 W/m2 compared to ERA5 observations.
- The high-resolution DestinE models significantly reduce this bias, with ICON showing excellent agreement with the observed global mean.
- IFS-FESOM and IFS-NEMO display a slight negative bias (roughly 2-3 W/m2) relative to ERA5.
- A distinct temporary reduction in shortwave radiation is visible across observations and all models between 1991 and 1993, corresponding to the Mt. Pinatubo eruption.
Spatial Patterns
The time series is dominated by a strong, regular seasonal cycle driven by the hemispheric asymmetry of Earth's landmasses and seasonal cloud cover variations. Interannual variability is prominent in the early 1990s due to volcanic forcing.
Model Agreement
ICON agrees exceptionally well with the ERA5 reference in terms of the annual mean magnitude. IFS-FESOM and IFS-NEMO track each other closely but are slightly dimmer than observations. All high-resolution models represent a clear improvement over the CMIP6 ensemble mean, which systematically overestimates surface shortwave.
Physical Interpretation
Global mean surface downwelling shortwave radiation is primarily modulated by cloud fraction and cloud optical properties. The positive bias in CMIP6 MMM likely reflects a common underestimation of cloud cover or optical thickness in conventional models. The improved performance of the ~5 km models, particularly ICON, suggests that explicitly resolving deep convection and fine-scale cloud structures leads to more realistic atmospheric transmissivity. The 1991-1993 dip is a direct physical response to increased scattering by stratospheric sulfate aerosols from the Mt. Pinatubo eruption.
Caveats
- ERA5 surface radiation fields are heavily dependent on the reanalysis model's own cloud parameterizations; direct satellite observations like CERES EBAF (available post-2000) would provide a more robust observational constraint.
- A highly accurate global mean can sometimes result from compensating regional biases (e.g., too cloudy in the tropics, too clear in the extratropics), which are masked in a global average.
Surface Latent Heat Flux Global Mean Time Series

| Variables | avg_slhtf |
|---|---|
| Models | ifs-fesom, ifs-nemo, icon |
| Reference Dataset | ERA5 |
| Units | W/m2 |
| Period | 1990–2014 |
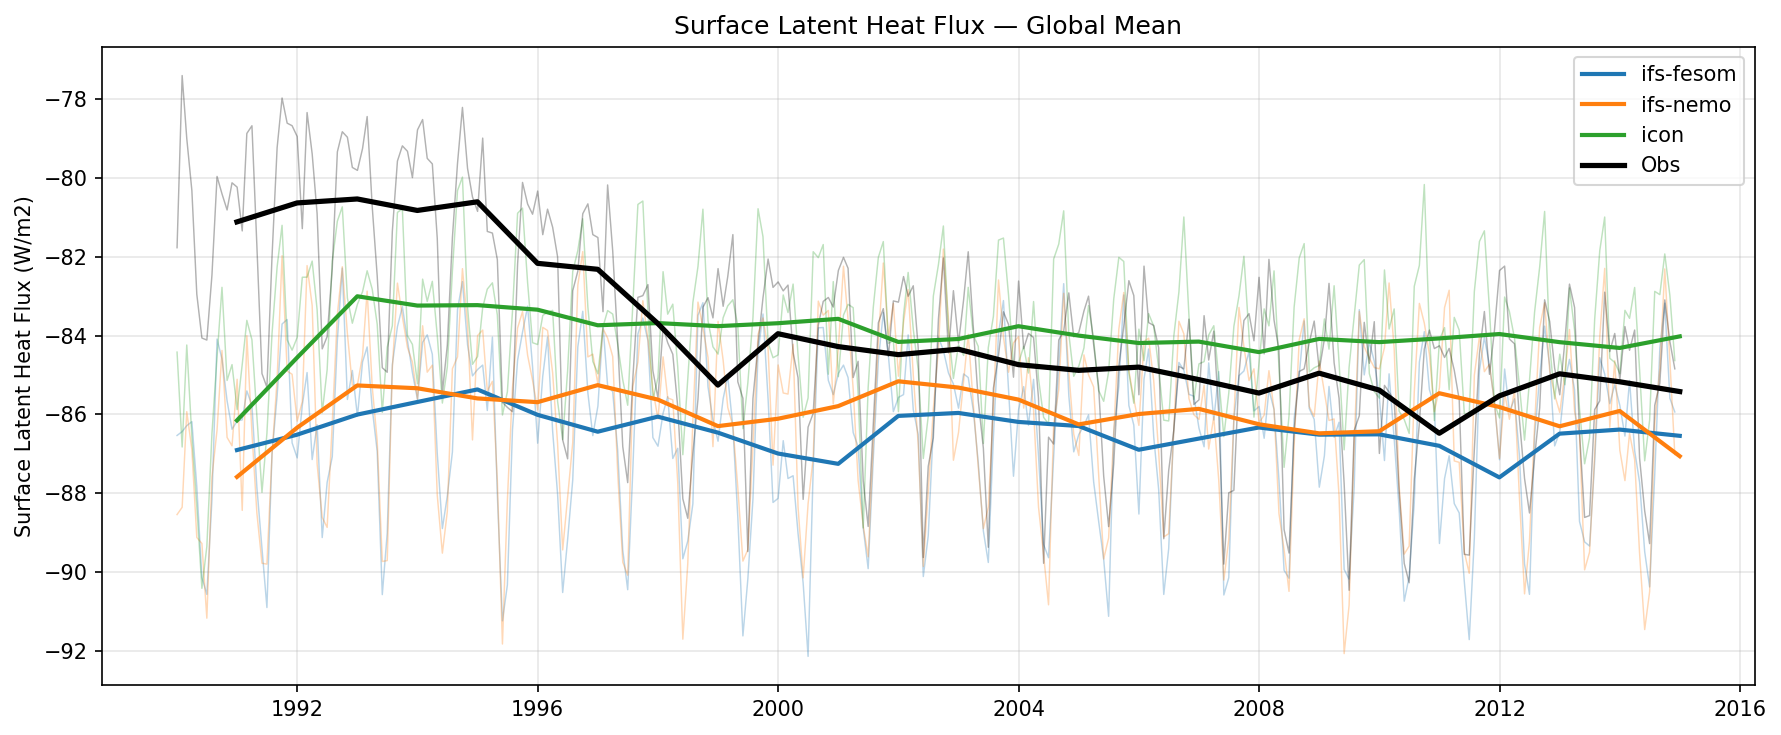
Summary high
Global mean time series of surface latent heat flux reveals that IFS-coupled models systematically overestimate the magnitude of upward flux (evaporation) compared to ERA5, whereas the ICON model shows close agreement with the reanalysis after 2000.
Key Findings
- IFS-FESOM and IFS-NEMO consistently simulate a stronger upward latent heat flux (more negative by ~2-4 W/m2) than ERA5 throughout the 1990-2015 period.
- ICON demonstrates the best overall agreement with ERA5, particularly from 2000 onwards where the smoothed timeseries closely track each other.
- ERA5 exhibits a distinct structural shift towards more negative values around 1998-2000, a feature not replicated by the free-running climate models, suggesting an artifact related to observing system changes in the reanalysis.
Spatial Patterns
This diagnostic presents global mean temporal evolution rather than spatial patterns. High-frequency (likely monthly) variability is captured by all models with amplitudes comparable to ERA5, while the smoothed low-frequency signal highlights systematic model offsets.
Model Agreement
The two IFS-based models (FESOM and NEMO) show strong inter-model agreement, both exhibiting a systematic bias toward excessive global evaporation. ICON diverges from the IFS models, simulating weaker evaporation that aligns well with the observational reference in the 21st century.
Physical Interpretation
The persistent negative bias (stronger upward flux) in the IFS models indicates excessive global surface evaporation, which implies excessive surface latent cooling and an overly active hydrological cycle. The abrupt shift in the ERA5 timeseries in the late 1990s is likely a non-physical artifact driven by the assimilation of new satellite observing systems (e.g., AMSU-A), a known issue in reanalysis flux products.
Caveats
- Surface latent heat flux in ERA5 is a modeled variable strongly influenced by parameterizations and shifting data assimilation inputs, meaning it should be treated with caution as an absolute 'truth', particularly across satellite era transitions.
- A global mean metric may mask large, compensating regional biases; spatial maps are necessary to identify whether the excessive evaporation in IFS models originates from the tropics or mid-latitudes.
Surface Net Longwave Radiation Global Mean Time Series
| Variables | avg_snlwrf |
|---|---|
| Models | ifs-fesom, ifs-nemo, icon |
| Reference Dataset | ERA5 |
| Units | W/m2 |
| Period | 1990–2014 |
Summary high
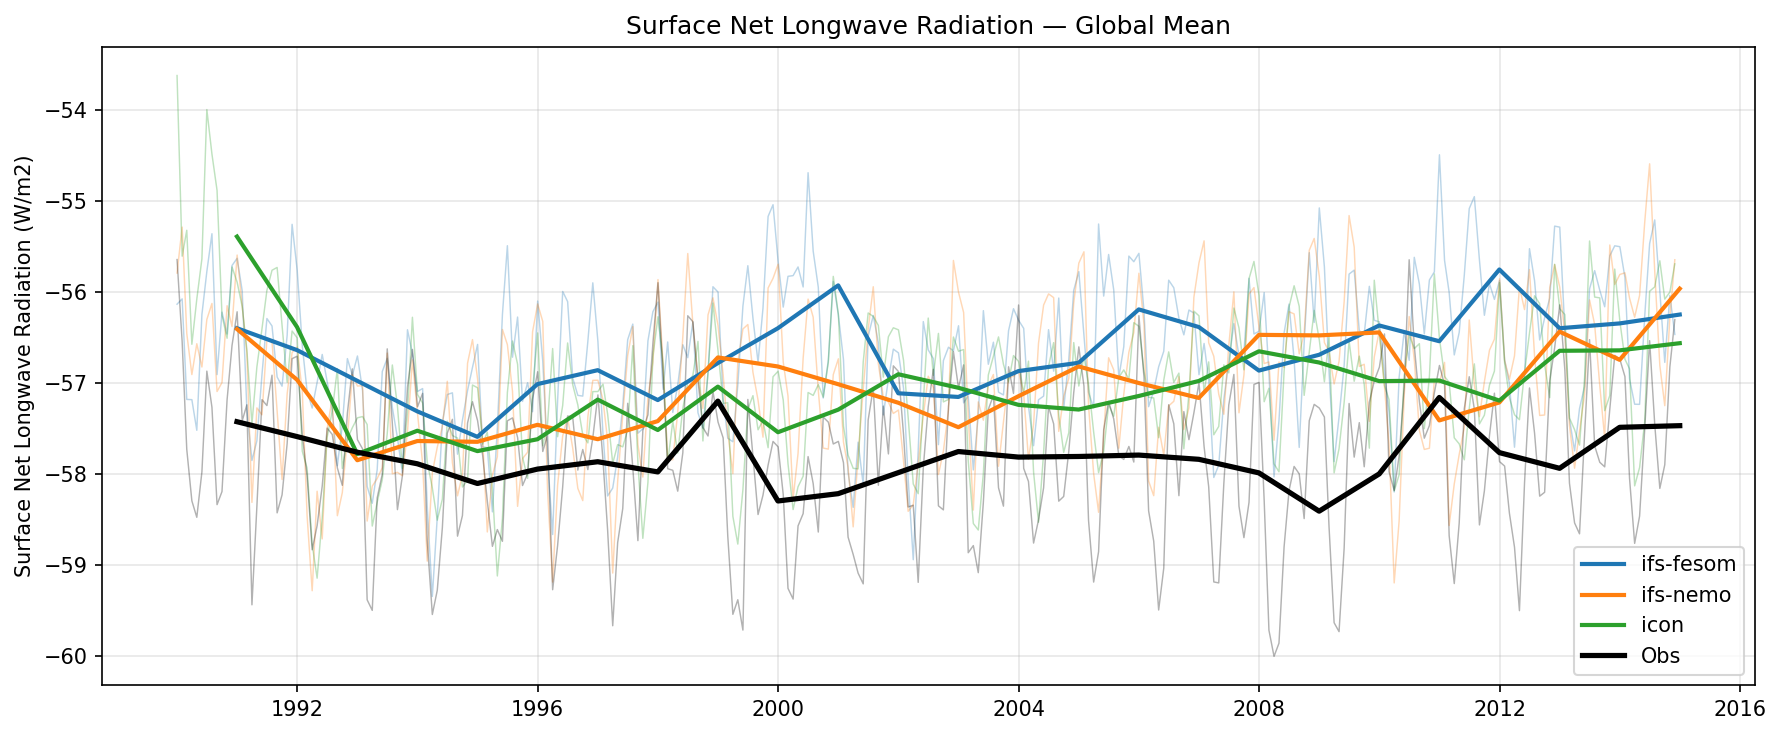
Global mean time series of surface net longwave radiation from 1990 to 2014, revealing that all three high-resolution coupled models exhibit a systematic positive bias (weaker net surface cooling) compared to the ERA5 reanalysis.
Key Findings
- All three models consistently underestimate the magnitude of net surface longwave cooling by approximately 1 to 2 W/m2 relative to ERA5.
- The models exhibit strong inter-model agreement in their climatological means, tightly clustering around -56.5 W/m2, distinct from the ERA5 baseline of approximately -58 W/m2.
- Both the models and ERA5 show a slight upward trend (toward less negative values) over the 25-year period, consistent with greenhouse gas accumulation.
- The amplitude of interannual variability in the models matches observations well, though the phasing differs, as expected for free-running coupled simulations.
Spatial Patterns
As a global mean time series, spatial patterns are integrated out. However, temporally, a persistent systematic offset is maintained throughout the entire 1990-2014 period. High-frequency (monthly) and low-frequency (annual) variances in the models are comparable in magnitude to the ERA5 reanalysis.
Model Agreement
Inter-model agreement is notably high, with IFS-FESOM, IFS-NEMO, and ICON tracking closely together and differing by less than ~0.5 W/m2 in their annual means. Model-observation agreement is comparatively poor due to the persistent 1-2 W/m2 positive bias shared by all models.
Physical Interpretation
Net surface longwave radiation represents the balance between upward emission (governed by surface temperature and emissivity) and downward emission (governed by atmospheric temperature, greenhouse gases, and cloud cover). The positive bias (less negative net flux) indicates weaker surface cooling. This is typically driven by excessive downwelling longwave radiation—often due to an overestimation of optically thick low clouds or atmospheric column moisture—or insufficient upwelling longwave radiation resulting from cold surface temperature biases.
Caveats
- ERA5 surface radiative fluxes are modeled products rather than direct observations and carry their own uncertainties, meaning the 'bias' may partially reflect reanalysis errors.
- Because these are free-running coupled models, their internal climate variability (e.g., ENSO events) is not phase-locked to historical observations, so matching exact peaks and troughs is not expected.
- Analyzing the net longwave flux obscures compensating errors; investigating the individual upwelling and downwelling components is necessary to isolate the exact physical driver.
Surface Net Longwave Radiation (Clear-Sky) Global Mean Time Series
| Variables | avg_snlwrfcs |
|---|---|
| Models | ifs-fesom, ifs-nemo, icon |
| Reference Dataset | ERA5 |
| Units | W/m2 |
| Period | 1990–2014 |
Summary high
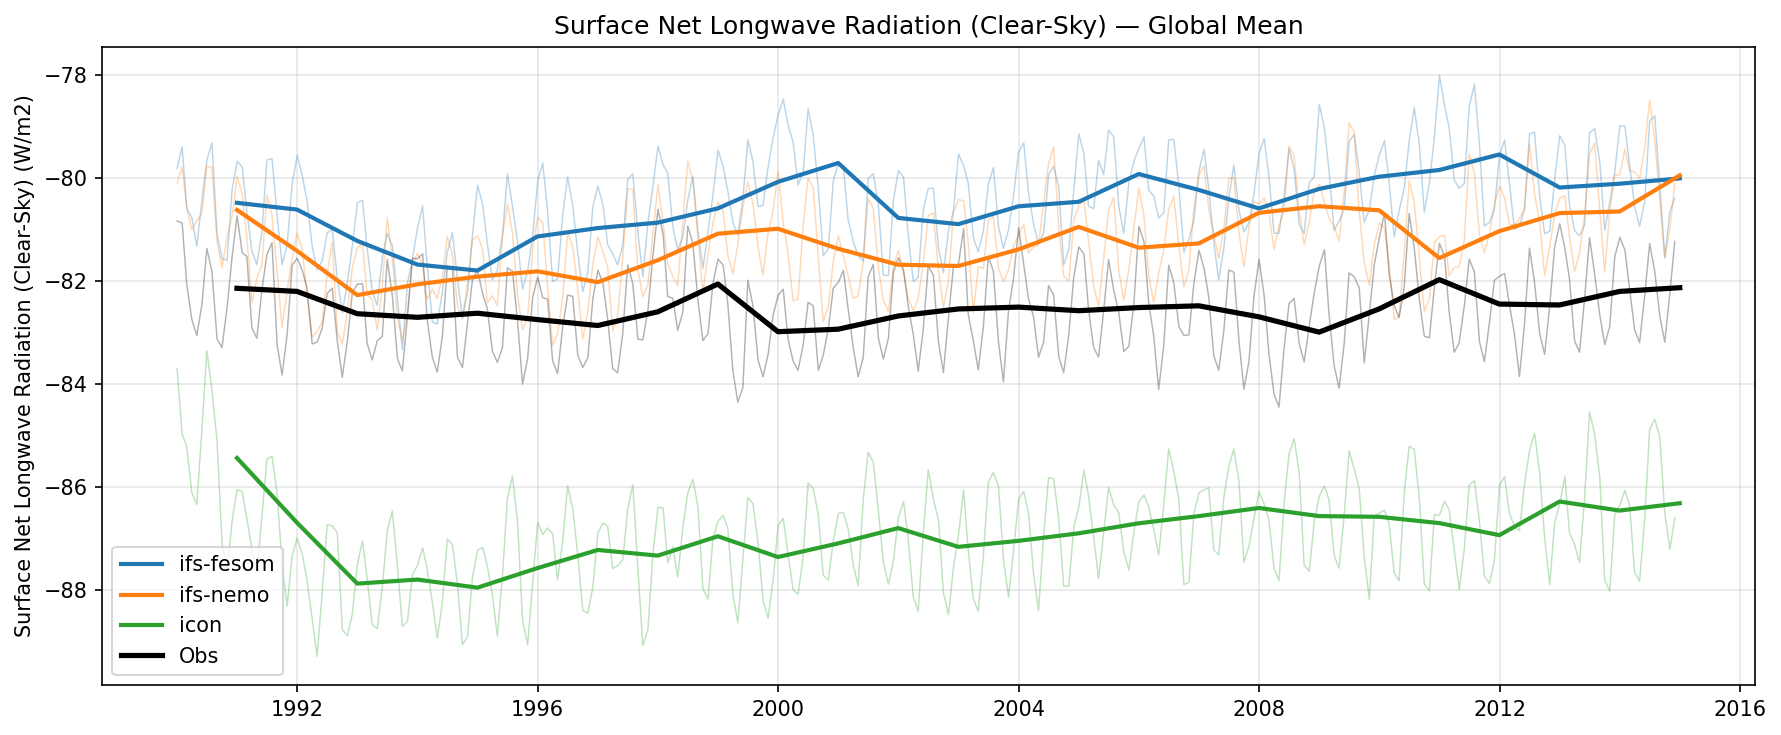
Global mean time series of clear-sky surface net longwave radiation from 1990 to 2014, evaluating IFS-FESOM, IFS-NEMO, and ICON models against ERA5 reanalysis.
Key Findings
- ICON exhibits a pronounced negative bias of approximately -5 W/m2, significantly overestimating clear-sky net surface longwave cooling.
- IFS-NEMO shows the best agreement with ERA5, with only a slight positive bias of roughly +0.5 to +1.0 W/m2.
- IFS-FESOM maintains a consistent positive bias of about +1.5 to +2.0 W/m2 relative to observations.
- All models accurately capture the seasonal cycle amplitude and key interannual variability, including the notable global minimum around 1992-1993.
Spatial Patterns
While spatial patterns are integrated out, the temporal evolution reveals a robust seasonal cycle driven by Northern Hemisphere continental temperature fluctuations. Subtle decadal trends and multi-year anomalies (such as the 1992-1993 dip, likely associated with the Mt. Pinatubo eruption's impact on temperature and moisture) are well-reproduced in the temporal structure of all models.
Model Agreement
The models diverge substantially in their absolute climatological mean states, spanning a ~7 W/m2 range. However, they demonstrate excellent agreement with each other and with ERA5 regarding the phase and amplitude of both seasonal and interannual variability. The two IFS-based models group much closer to the ERA5 baseline, whereas ICON is a distinct outlier.
Physical Interpretation
Clear-sky surface net longwave radiation is governed by the balance between upward emission (controlled by surface skin temperature) and downward emission (controlled by lower tropospheric temperature and water vapor). ICON's strongly negative bias (excessive net surface cooling) strongly suggests either a warm bias in surface skin temperature or a dry/cold bias in the lower troposphere, which would reduce downwelling longwave radiation. Conversely, the slight positive biases in the IFS models imply mildly excessive lower-tropospheric moisture/temperature or cooler surface temperatures.
Caveats
- ERA5 is a reanalysis product, and its clear-sky radiative fluxes depend on the underlying IFS model's radiative transfer scheme and moisture assimilation, which may share inherent similarities with the DestinE IFS configurations.
- Differences in how 'clear-sky' is defined and sampled (e.g., Method II vs. clear-sky radiative transfer calls) between the models and ERA5 can introduce methodological artifacts into the comparison.
Surface Net Shortwave Radiation Global Mean Time Series

| Variables | avg_snswrf |
|---|---|
| Models | ifs-fesom, ifs-nemo, icon |
| Reference Dataset | ERA5 |
| Units | W/m2 |
| Period | 1990–2014 |
Summary high
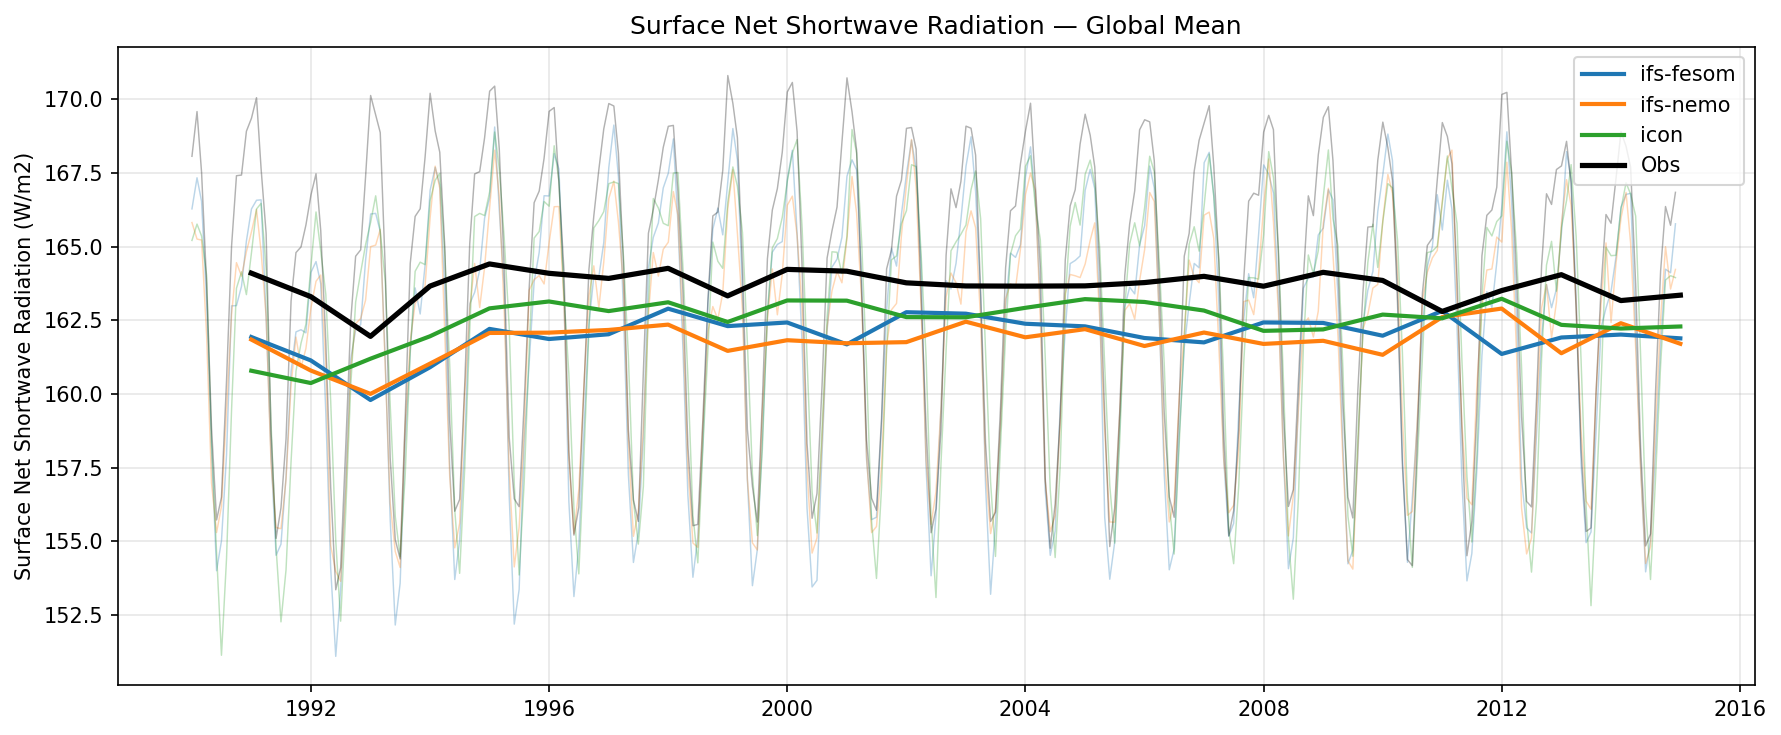
The figure displays the global mean time series of surface net shortwave radiation from 1990 to roughly 2015, featuring both the raw seasonal cycle and smoothed interannual variations for three high-resolution models compared to ERA5.
Key Findings
- All models exhibit a systematic negative bias in global mean surface net shortwave radiation of approximately 1 to 2 W/m2 relative to ERA5.
- The 1991 Mt. Pinatubo eruption signal (a sharp decrease in 1992-1993) is distinctly captured by the IFS-based models and ERA5, but is much more muted in ICON.
- The negative bias in the models' annual means is primarily driven by an underestimation of the seasonal maximums, as seen in the amplitude of the thin lines.
Spatial Patterns
Temporally, the data is dominated by a strong seasonal cycle. ERA5 (faint grey line) exhibits seasonal peaks exceeding 170 W/m2, whereas the models' seasonal peaks generally only reach 167-168 W/m2. Interannually, a prominent dip occurs in 1992-1993 due to volcanic forcing.
Model Agreement
IFS-FESOM and IFS-NEMO show excellent agreement with each other, maintaining a consistent ~2 W/m2 negative bias throughout the period. ICON diverges from the IFS models; it exhibits a muted volcanic response in the early 1990s but trends closer to observations (within ~1 W/m2) in the later half of the time series.
Physical Interpretation
The pervasive negative bias in surface net shortwave radiation implies that the models either have too much cloud cover, overly reflective clouds, excessive aerosol optical depth, or higher surface albedos than ERA5. The distinct response to the Pinatubo eruption highlights differences in how volcanic aerosols and their radiative impacts are parameterized between the IFS and ICON atmospheric models.
Caveats
- ERA5 surface radiation fields are model-derived forecasts and can themselves contain biases; comparison against direct satellite products like CERES EBAF would provide a more robust observational baseline.
- Global mean metrics obscure compensating regional biases (e.g., between the tropics and poles, or land and ocean).
Surface Net Shortwave Radiation (Clear-Sky) Global Mean Time Series
| Variables | avg_snswrfcs |
|---|---|
| Models | ifs-fesom, ifs-nemo, icon |
| Reference Dataset | ERA5 |
| Units | W/m2 |
| Period | 1990–2014 |
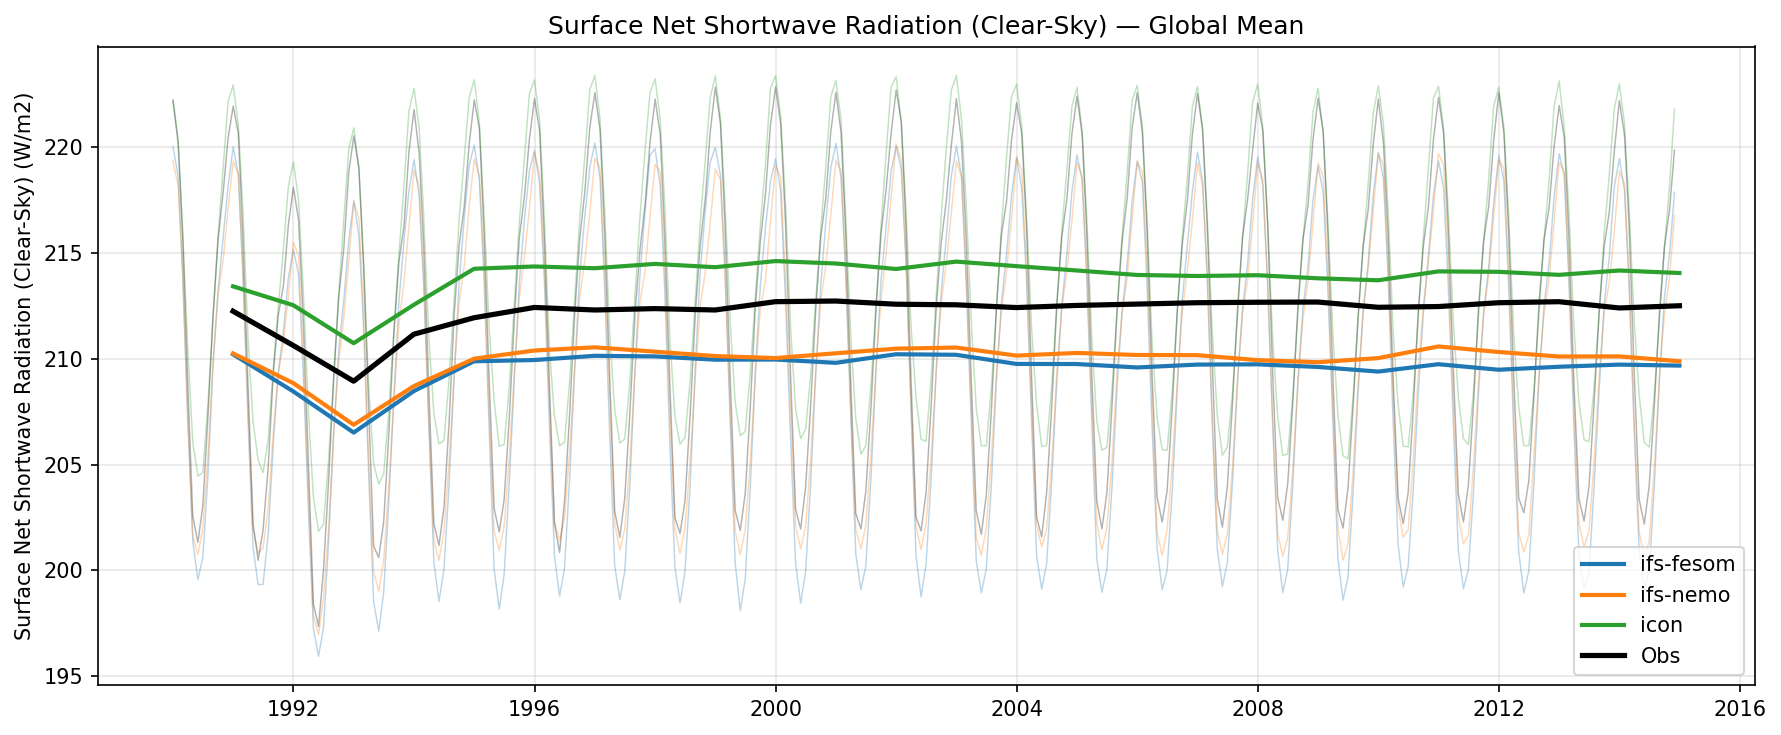
Summary high
Global mean time series of clear-sky surface net shortwave radiation from 1990 to 2015, highlighting steady baseline offsets among models and the prominent multi-year signal from the 1991 Mount Pinatubo eruption.
Key Findings
- All models successfully capture the transient reduction and subsequent recovery in surface shortwave radiation caused by the 1991 Mount Pinatubo volcanic eruption.
- ICON displays a systematic positive bias of approximately 1.5-2.0 W/m2 relative to ERA5 observations throughout the time series.
- IFS-FESOM and IFS-NEMO exhibit a systematic negative bias of roughly 2.5 W/m2 compared to ERA5, with nearly identical performance to one another.
Spatial Patterns
Temporally, the data is dominated by the annual seasonal cycle (thin lines) and the significant 1991-1994 interannual dip in the annual mean (thick lines) corresponding to the injection of stratospheric aerosols by Mount Pinatubo.
Model Agreement
IFS-FESOM and IFS-NEMO are in virtually perfect agreement, demonstrating that the ocean coupling choice has negligible impact on this atmospheric/surface metric. ICON diverges significantly from the IFS models, with observations lying squarely between the ICON (high) and IFS (low) estimates.
Physical Interpretation
Because clouds are excluded from clear-sky metrics, the mean biases are primarily driven by differences in prescribed background aerosol climatologies, atmospheric absorbers (like water vapor), and global mean surface albedo (such as snow and sea ice extent). The accurate capture of the 1991 dip confirms that all models correctly ingest transient stratospheric volcanic aerosol forcing.
Caveats
- The observational reference used is ERA5, a reanalysis product that relies on its own radiative transfer model and aerosol/albedo assumptions, which may differ from direct satellite measurements like CERES.
- The calculation of 'clear-sky' fluxes in models depends heavily on how clear-sky conditions are computationally defined and sampled compared to the reanalysis.
Total Cloud Cover Global Mean Time Series
| Variables | avg_tcc |
|---|---|
| Models | ifs-fesom, ifs-nemo, icon |
| Reference Dataset | ERA5 |
| Units | % |
| Period | 1990–2014 |
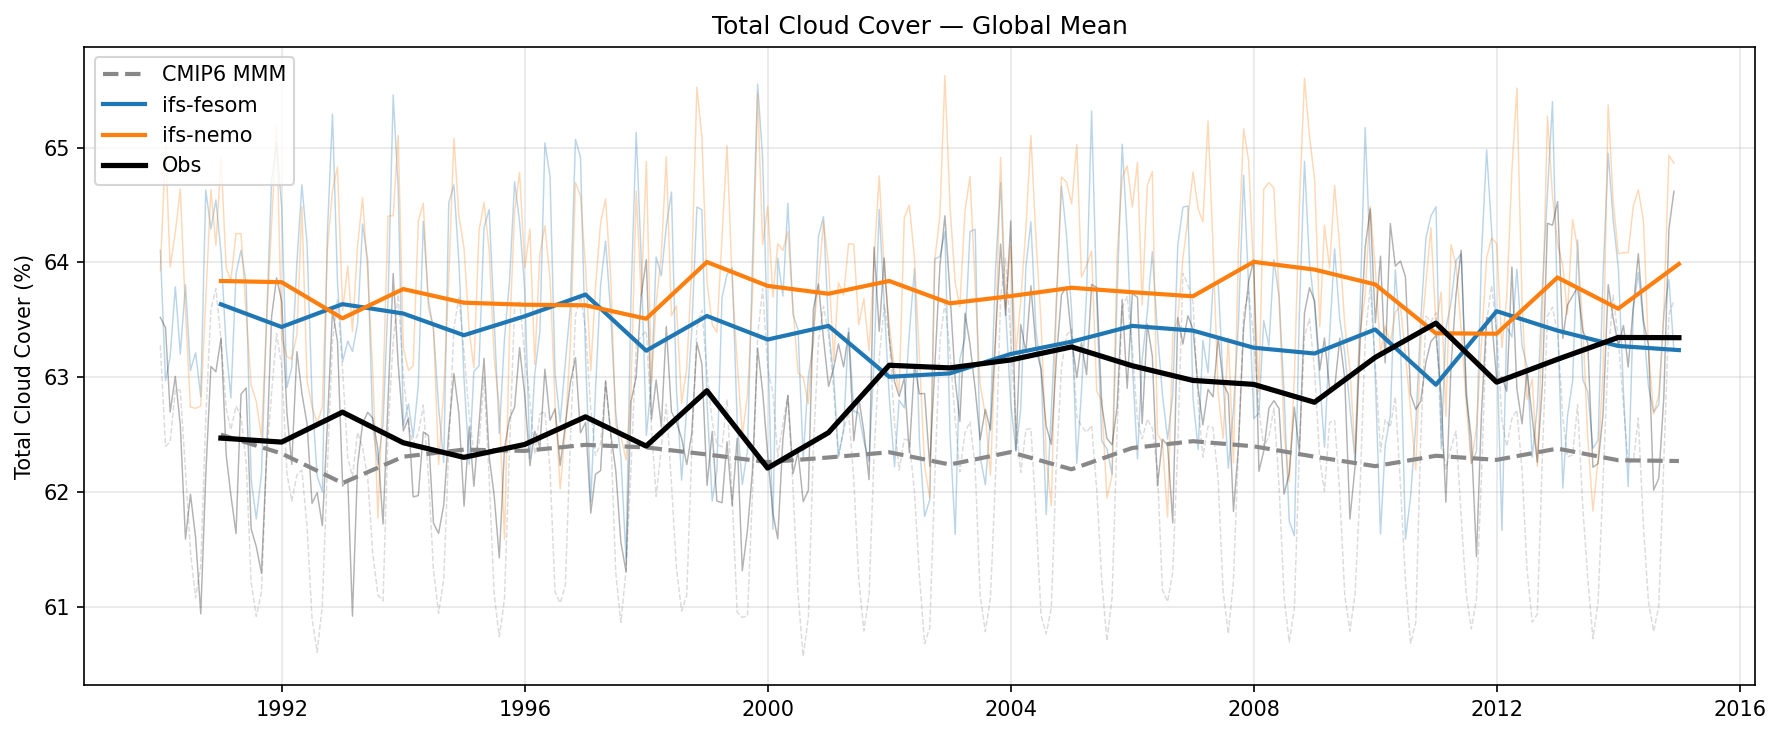
Summary high
The figure displays the global mean time series of total cloud cover from 1990 to 2015, comparing high-resolution DestinE models (ifs-fesom, ifs-nemo), the CMIP6 multi-model mean, and ERA5 observations.
Key Findings
- ERA5 observations show a distinct multidecadal variation, with total cloud cover dipping to ~62.2% around 2000 and subsequently increasing to ~63.4% by 2012.
- Both ifs-fesom and ifs-nemo exhibit a persistent positive bias of 0.5% to 1.5% in global cloud fraction compared to the pre-2010 ERA5 baseline.
- None of the models, including the CMIP6 MMM and the high-resolution DestinE models, capture the post-2000 upward trend seen in the ERA5 reanalysis, instead simulating stable, flat trajectories.
Spatial Patterns
The temporal patterns reveal strong, consistent high-frequency (monthly/seasonal) variability of roughly 3-4% amplitude (thin lines) across all models and observations. At decadal timescales, models exhibit flat climatologies, whereas ERA5 demonstrates a pronounced structural trend change post-2000.
Model Agreement
The models agree on a stable multidecadal trajectory but disagree on the absolute magnitude. The CMIP6 MMM aligns closely with the 1990-2000 ERA5 mean (~62.3%), whereas ifs-fesom (~63.4%) and ifs-nemo (~63.8%) consistently overestimate total cloud cover. ifs-fesom only converges with ERA5 late in the time series due to the uncaptured upward trend in the observational dataset.
Physical Interpretation
The positive bias in IFS-based models relative to CMIP6 points to parameterization sensitivities in macrophysics or convection schemes favoring excessive cloud formation or longevity, which are not explicitly resolved even at ~5km resolution. Furthermore, the inability of any model (high-resolution or CMIP6) to reproduce the ERA5 trend strongly suggests that the post-2000 ERA5 increase is an artifact of changes in the assimilated satellite observing system (e.g., the transition to newer satellite instruments around 1998-2002), rather than a genuine physical climate forcing response.
Caveats
- ERA5 cloud cover is a reanalysis product known to contain spurious trends related to historical changes in satellite observing systems, limiting its reliability as 'truth' for decadal cloud cover trends.
- Although the prompt metadata lists ICON as an evaluated model, it is missing from the figure's legend and plotted data.
TOA Net Longwave Radiation Global Mean Time Series

| Variables | avg_tnlwrf |
|---|---|
| Models | ifs-fesom, ifs-nemo, icon |
| Reference Dataset | ERA5 |
| Units | W/m2 |
| Period | 1990–2014 |
Summary high
The figure displays the global mean time series of TOA net longwave radiation from 1990 to 2014, revealing that all three high-resolution models systematically underestimate the magnitude of outgoing longwave radiation (OLR) compared to ERA5 reanalysis.
Key Findings
- All models exhibit a positive bias in net TOA longwave radiation (underestimating OLR) ranging from approximately 1.5 to 3.8 W/m2 relative to ERA5.
- ifs-fesom demonstrates the best agreement with observations, with a mean bias of ~1.5 W/m2, whereas icon has the largest bias at ~3.8 W/m2.
- The models generally capture the phase of the seasonal cycle but slightly overestimate its peak-to-peak amplitude compared to the observational baseline.
Spatial Patterns
Temporally, the models show a brief initial adjustment period between 1990 and 1993, particularly noticeable in the icon model, before stabilizing into a consistent multi-decadal mean bias. The thin lines reveal that models slightly exaggerate the seasonal extremes of OLR relative to ERA5.
Model Agreement
The models agree on the direction of the bias (too little OLR) but diverge considerably in magnitude. The IFS-based models (ifs-fesom and ifs-nemo) exhibit similar interannual variability, reflecting their shared atmospheric physics, yet maintain a constant offset of ~1 W/m2 from each other. icon stands out as the greatest outlier.
Physical Interpretation
An underestimation of OLR (a positive bias in net TOA longwave) suggests that the models may be trapping too much longwave radiation in the atmosphere. This is typically driven by excessive high cloud fraction, a globally cold bias in surface or tropospheric temperatures, or an overestimation of atmospheric water vapor.
Caveats
- ERA5 is a reanalysis product; comparing against direct satellite-based radiation observations like CERES (EBAF) would provide a more robust baseline for TOA fluxes.
- Global mean metrics can obscure large, compensating regional biases, such as tropical high-cloud errors canceling out extratropical clear-sky emission biases.
TOA Net Longwave Radiation (Clear-Sky) Global Mean Time Series

| Variables | avg_tnlwrfcs |
|---|---|
| Models | ifs-fesom, ifs-nemo, icon |
| Reference Dataset | ERA5 |
| Units | W/m2 |
| Period | 1990–2014 |
Summary high
The figure displays the global mean time series of clear-sky TOA net longwave radiation from 1990 to 2014, revealing that the high-resolution models generally underestimate clear-sky outgoing longwave radiation (exhibiting less negative net values) compared to ERA5.
Key Findings
- IFS-FESOM is the best-performing model, tracking ERA5 closely with only a minor positive bias of ~0.5-1 W/m2.
- ICON displays the largest systematic bias, consistently underestimating clear-sky outgoing longwave radiation by roughly 2-4 W/m2.
- All models accurately capture the amplitude and phase of the seasonal cycle, as well as key interannual variability such as the 1992-1993 anomaly.
Spatial Patterns
The temporal pattern is dominated by a strong seasonal cycle, with the most negative values (highest outgoing longwave radiation) occurring during the Northern Hemisphere summer, driven by thermal emission from warmer NH landmasses. A prominent interannual shift toward less negative values is visible in 1992-1993, capturing the radiative impact of the Mt. Pinatubo eruption.
Model Agreement
The models show excellent agreement with each other and with observations regarding temporal variability, including both seasonal and interannual timescales. However, they diverge in their climatological mean states, with IFS-FESOM closely matching ERA5 while IFS-NEMO and ICON exhibit persistent positive mean biases.
Physical Interpretation
TOA net clear-sky longwave radiation represents the outgoing longwave radiation (OLR) without cloud effects. The positive bias (less negative values) in models like ICON and IFS-NEMO indicates insufficient clear-sky OLR. This is typically driven by either a cold bias in global surface temperatures (reducing surface emission) or a moist bias in atmospheric column water vapor, which excessively enhances the clear-sky greenhouse effect and traps more radiation.
Caveats
- ERA5 clear-sky radiative fluxes are derived from a forecast model rather than direct observation, and may contain their own biases compared to satellite products like CERES.
- A global mean time series can obscure compensating regional biases, such as opposing errors in the deep tropics versus the extratropics.
TOA Net Shortwave Radiation Global Mean Time Series

| Variables | avg_tnswrf |
|---|---|
| Models | ifs-fesom, ifs-nemo, icon |
| Reference Dataset | ERA5 |
| Units | W/m2 |
| Period | 1990–2014 |
Summary high
The figure displays the global mean time series of TOA net shortwave radiation from 1990 to 2014, highlighting systematic model underestimations and the transient impact of the Mount Pinatubo eruption.
Key Findings
- All evaluated models systematically underestimate global mean TOA net shortwave radiation compared to ERA5 observations.
- ICON exhibits the largest negative bias (approximately 3-4 W/m2), whereas IFS-FESOM and IFS-NEMO show a smaller bias (approximately 1.5-2 W/m2).
- All models successfully reproduce the significant reduction in net shortwave radiation during 1992-1993, corresponding to the volcanic forcing from the 1991 Mount Pinatubo eruption.
Spatial Patterns
Temporally, the data exhibits a prominent seasonal cycle driven by the asymmetric distribution of land, ocean, and clouds between hemispheres, superimposed on a relatively stable long-term mean outside the short-lived Pinatubo aerosol anomaly.
Model Agreement
IFS-FESOM and IFS-NEMO show high inter-model agreement, directly reflecting their shared IFS atmospheric component. ICON has a distinctly lower mean state. While all models agree well with the observed temporal variability, phasing, and response to volcanic forcing, they unanimously fail to capture the absolute observed magnitude.
Physical Interpretation
The negative bias in TOA net shortwave radiation indicates that the models reflect too much incoming solar radiation (an overestimated planetary albedo). In climate models, this is typically driven by excessive low-level cloud cover or overly high cloud optical depth (e.g., too much liquid water). The temporary 1992-1993 dip accurately physically reflects the increased scattering of shortwave radiation by stratospheric sulfate aerosols injected by Mount Pinatubo.
Caveats
- ERA5 is a reanalysis product; evaluating against direct satellite-derived datasets like CERES-EBAF (though only available post-2000) is generally preferred for TOA radiative fluxes.
- Global mean time series can obscure large, compensating regional biases, such as models being too reflective in the tropics but insufficiently reflective over the Southern Ocean.
TOA Net Shortwave Radiation (Clear-Sky) Global Mean Time Series

| Variables | avg_tnswrfcs |
|---|---|
| Models | ifs-fesom, ifs-nemo, icon |
| Reference Dataset | ERA5 |
| Units | W/m2 |
| Period | 1990–2014 |
Summary high
The figure shows the global mean time series of clear-sky TOA net shortwave radiation from 1990 to 2015, highlighting a persistent negative bias in all models and a distinct transient response to the 1991 Mount Pinatubo eruption.
Key Findings
- All models exhibit a persistent negative bias in global mean clear-sky TOA net shortwave radiation relative to observations, ranging from ~1.5 W/m² (ICON) to ~3 W/m² (IFS models).
- The IFS-FESOM and IFS-NEMO time series are virtually identical, indicating that the clear-sky shortwave bias is driven entirely by the shared atmospheric component (IFS).
- Both models and observations clearly capture the abrupt ~4 W/m² reduction and subsequent multi-year recovery associated with stratospheric aerosols from the Mount Pinatubo eruption.
Spatial Patterns
The time series is dominated by a strong seasonal cycle driven by the hemispheric asymmetry in clear-sky albedo (landmass, desert, and cryosphere distribution). Interannual variability is largely defined by the sharp drop in 1991-1992 due to Pinatubo, with stable long-term climatologies thereafter.
Model Agreement
There is a near-perfect agreement between the two IFS-based models, highlighting the insensitivity of global clear-sky TOA fluxes to the underlying ocean model. ICON demonstrates better agreement with observations, showing a smaller negative bias than the IFS models, though all models underestimate the clear-sky net shortwave flux.
Physical Interpretation
The negative bias in clear-sky net shortwave radiation implies that the models reflect too much solar radiation back to space (higher clear-sky planetary albedo). This typically points to overly bright surface albedos (e.g., in deserts, snow, or sea ice parameterizations) or excessive atmospheric scattering from aerosols and Rayleigh scattering. The accurate reproduction of the Pinatubo signal demonstrates that the prescribed stratospheric aerosol optical depth forcing is functioning correctly.
Caveats
- Observational clear-sky fluxes (whether from ERA5 or satellite products like CERES) depend heavily on the accuracy of cloud-masking algorithms, which can misclassify thin cirrus or heavy aerosol layers as clouds.
- The pre-Pinatubo baseline is short, making it slightly difficult to assess the exact equilibrium climatology of the models prior to the eruption.
Total Precipitation Rate Global Mean Time Series
| Variables | avg_tprate |
|---|---|
| Models | ifs-fesom, ifs-nemo, icon |
| Reference Dataset | ERA5 |
| Units | kg/m2/s |
| Period | 1990–2014 |
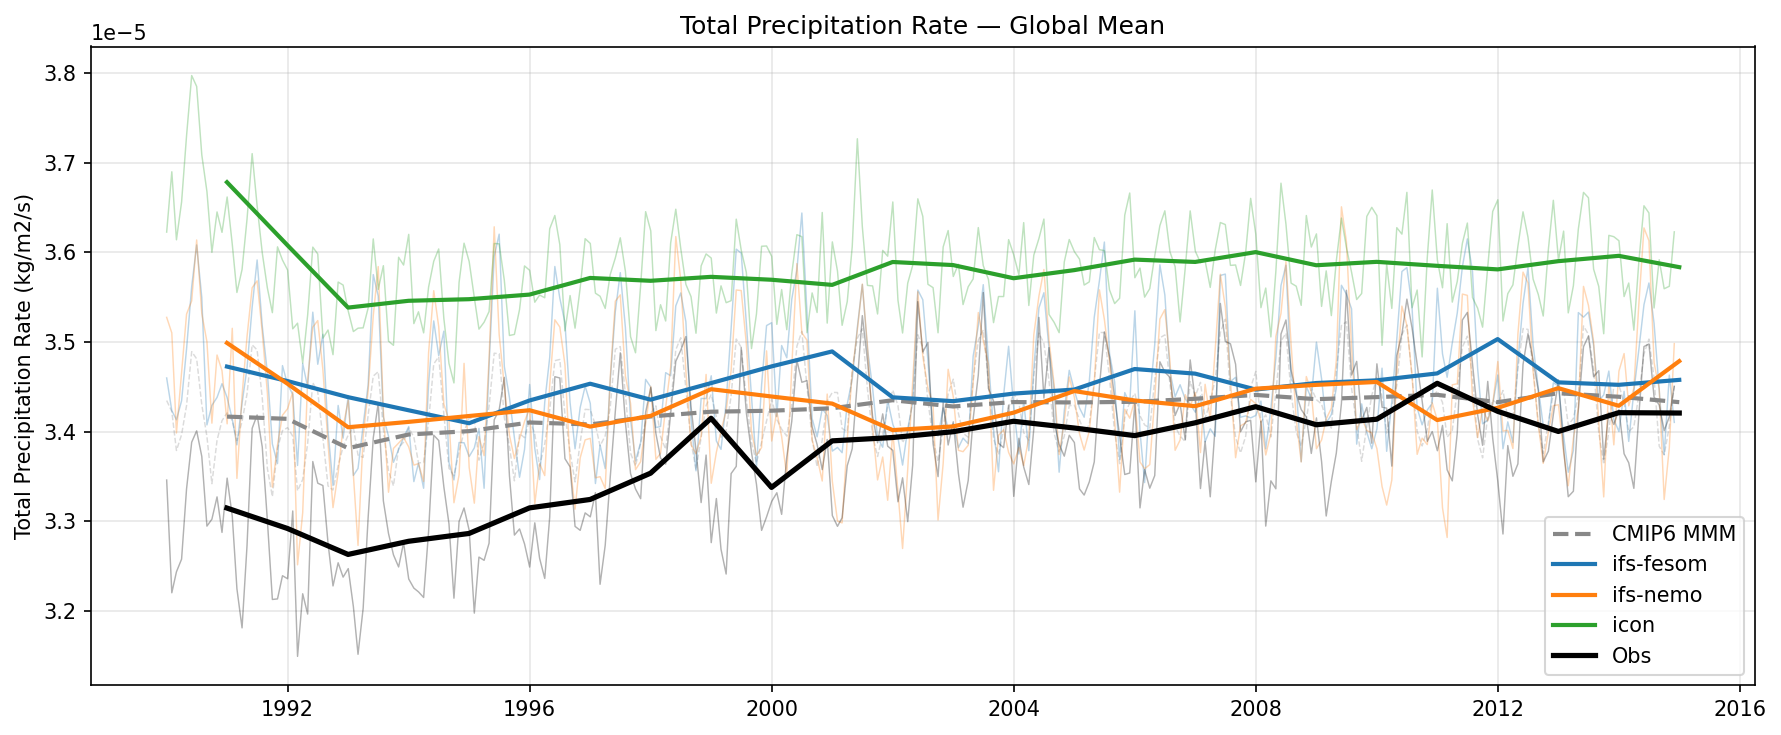
Summary high
Global mean total precipitation rate time series from 1990–2014 showing all three high-resolution DestinE models overestimating precipitation relative to ERA5.
Key Findings
- All evaluated models (ICON, IFS-FESOM, IFS-NEMO) exhibit a positive global mean precipitation bias compared to ERA5.
- ICON shows the largest positive bias (~3.6e-5 kg/m2/s), while IFS-FESOM and IFS-NEMO are closer to the CMIP6 multi-model mean (~3.45e-5 kg/m2/s).
- ERA5 observations show a marked dip in the early 1990s and a subsequent upward trend, whereas the models depict a relatively flat long-term mean.
Spatial Patterns
Temporally, the models exhibit a stable climatological mean with regular seasonal cycles, lacking the decadal upward trend present in the ERA5 reanalysis from the early 1990s to the 2010s.
Model Agreement
Models agree on an overly active global hydrological cycle relative to ERA5. IFS-FESOM and IFS-NEMO agree well with each other and the CMIP6 MMM, while ICON diverges with a significantly higher global precipitation rate.
Physical Interpretation
The persistent positive bias reflects an overly active global hydrological cycle, a common issue in climate models related to boundary layer and convective parameterizations, as well as atmospheric energy balance constraints. The ERA5 dip in 1992-1993 reflects radiative cooling and reduced evaporation following the Mt. Pinatubo eruption, a signal that is weaker in the model outputs.
Caveats
- ERA5 precipitation is a model-derived forecast variable rather than a direct observation, and is known to have its own uncertainties and temporal discontinuities.
- The early 1990s period in the simulations may be affected by coupled model spin-up adjustments, complicating the interpretation of early trends.
Total Cloud Cover Global Mean Time Series

| Variables | clt |
|---|---|
| Models | ifs-fesom, ifs-nemo, icon |
| Reference Dataset | ERA5 |
| Units | % |
| Period | 1990–2014 |
Summary medium
The figure displays global mean Total Cloud Cover (TCC) time series (1990–2014), showing that both IFS-based high-resolution models overestimate cloud cover by 0.5–1.5% relative to ERA5 reanalysis and the CMIP6 multi-model mean.
Key Findings
- Both ifs-fesom and ifs-nemo exhibit a systematic positive bias in total cloud cover compared to ERA5 and CMIP6 MMM throughout the period.
- ifs-nemo consistently simulates higher global cloud cover (~63.8%) than ifs-fesom (~63.4%), suggesting ocean coupling choice influences atmospheric moisture or stability.
- ERA5 reanalysis shows a distinct upward trend in cloud cover starting around 2000 (rising from ~62.5% to ~63.3%), a feature not captured by the relatively flat trends of the models or the CMIP6 ensemble.
Spatial Patterns
The monthly background data (thin lines) reveals strong seasonal cycles in all datasets. Temporally, the models show relatively stable climatologies (flat trends), contrasting with the multi-decadal increase observed in the ERA5 reanalysis.
Model Agreement
The two IFS models track each other closely in terms of inter-annual variability but differ in mean magnitude, with ifs-nemo being consistently cloudier. Neither model agrees well with the magnitude of the CMIP6 MMM (which is ~1% lower, around 62.3%) or the trend of ERA5. ifs-fesom is closer to ERA5, particularly in the post-2010 period where the observational trend rises to meet the model bias.
Physical Interpretation
The positive bias in IFS models suggests overly aggressive cloud formation or insufficient dissipation in the atmospheric physics, a common tuning challenge. The divergence between ifs-fesom and ifs-nemo (which share the same IFS atmospheric component) implies that differences in Sea Surface Temperature (SST) boundary conditions provided by the underlying ocean models (FESOM vs. NEMO) significantly impact global evaporation rates or atmospheric stability, thereby modulating total cloud fraction.
Caveats
- The metadata lists 'icon' as a model, but it is not visible in the legend or plot.
- The 'Observation' reference is ERA5 reanalysis, which generates cloud cover via its own model physics (constrained by assimilated state variables) rather than direct satellite retrieval, carrying its own potential biases.
Surface Latent Heat Flux Global Mean Time Series
| Variables | hfls |
|---|---|
| Models | ifs-fesom, ifs-nemo, icon |
| Reference Dataset | ERA5 |
| Units | W/m2 |
| Period | 1990–2014 |
Summary high
Global mean time series of surface latent heat flux (1990–2014) comparing three high-resolution coupled models against ERA5 reanalysis.
Key Findings
- ERA5 displays a spurious trend, shifting from ~-81 W/m² in the early 1990s to ~-85 W/m² after 2000, likely due to changes in the observing system (e.g., satellite assimilation).
- All three models exhibit stable climatologies with no significant multi-decadal trends, contrasting with the non-physical drift in the early ERA5 record.
- In the post-2000 period (where ERA5 is more stable), IFS-FESOM and IFS-NEMO show slightly stronger evaporation (more negative flux, ~-86.5 W/m²) than ERA5 (~-85.5 W/m²), while ICON shows slightly weaker evaporation (~-84 W/m²).
- IFS-FESOM and IFS-NEMO tracks are nearly identical, suggesting the shared atmospheric component (IFS) dominates the surface flux parameterization over differences in the ocean models.
Spatial Patterns
The primary temporal feature is the 'step change' in the observational reference (ERA5) between 1995 and 2000. Seasonal variability (amplitude of thin lines) appears consistent across models and observations.
Model Agreement
High agreement between the two IFS-based models (ifs-fesom and ifs-nemo). ICON maintains a consistent offset of approximately +2-3 W/m² (weaker flux) relative to the IFS models throughout the simulation.
Physical Interpretation
Negative values indicate upward energy flux (evaporation cooling the surface). The stability of the models suggests they are in radiative equilibrium, while the trend in ERA5 reflects reanalysis inconsistencies. The offset between ICON and the IFS models likely stems from differences in atmospheric boundary layer schemes or bulk aerodynamic formulas rather than ocean dynamics, given the similarity between IFS-NEMO and IFS-FESOM.
Caveats
- The significant non-physical trend in the ERA5 reference dataset during the 1990s makes bias assessment unreliable for the first decade of the simulation.
- Surface flux observations are model-derived in reanalysis, not direct measurements, increasing uncertainty in the 'ground truth'.
Surface Sensible Heat Flux Global Mean Time Series
| Variables | hfss |
|---|---|
| Models | ifs-fesom, ifs-nemo, icon |
| Reference Dataset | ERA5 |
| Units | W/m2 |
| Period | 1990–2014 |
Summary high
Time series of global-mean surface sensible heat flux (1990–2014) comparing three high-resolution models against ERA5 reanalysis. The plot reveals a systematic overestimation of upward heat flux magnitude by all models, with ICON showing the largest deviation.
Key Findings
- All models exhibit a negative bias compared to ERA5, indicating excessively strong upward sensible heat fluxes (global mean is too negative).
- ifs-nemo and ifs-fesom track each other closely, with an annual mean offset of approximately -1 to -1.5 W/m² relative to ERA5.
- ICON presents a significant bias, roughly -3.5 to -4 W/m² more negative than observations, and displays a markedly larger seasonal cycle amplitude than both the IFS models and ERA5.
- ERA5 shows a gradual trend of increasing upward flux magnitude (becoming more negative) over the period, which is not clearly reproduced by the models.
Spatial Patterns
While the diagnostic is a global mean, the temporal domain shows distinct seasonal behaviors. ICON's seasonal cycle is exaggerated, with much deeper troughs (winter/strong flux periods) compared to the IFS models and ERA5. The inter-annual variability in the IFS models correlates well with ERA5, whereas ICON shows a distinct initial adjustment period in the early 1990s.
Model Agreement
There is strong agreement between the two IFS-based models (ifs-fesom and ifs-nemo), suggesting the ocean model component (FESOM vs NEMO) has a limited impact on global mean sensible heat flux compared to the atmospheric physics. ICON is a distinct outlier with poor agreement in both mean state and seasonal amplitude.
Physical Interpretation
The negative values indicate upward flux (surface to atmosphere) under a 'positive down' sign convention. The stronger upward fluxes in the models imply overly efficient turbulent heat transfer from the surface, potentially due to biases in the surface layer parameterisation, surface roughness lengths, or systematically larger surface-air temperature gradients. ICON's large seasonal amplitude suggests excessive sensitivity to seasonal surface temperature variations.
Caveats
- The comparison uses ERA5 reanalysis as 'truth', but surface fluxes in reanalyses are model-derived products and not directly observed.
- Global means may mask compensating regional errors (e.g., contrasting biases over land vs. ocean).
Total Precipitation Rate Global Mean Time Series

| Variables | pr |
|---|---|
| Models | ifs-fesom, ifs-nemo, icon |
| Reference Dataset | ERA5 |
| Units | kg/m2/s |
| Period | 1990–2014 |
Summary high
High-resolution models overestimate global mean precipitation rates relative to ERA5 reanalysis, with ICON showing the largest positive bias (~8% higher than ERA5).
Key Findings
- ICON exhibits the strongest wet bias, maintaining a mean rate of ~3.6e-5 kg/m²/s, significantly higher than the IFS models and the CMIP6 Multi-Model Mean.
- ifs-nemo shows the best agreement with the CMIP6 ensemble mean and is the closest model to ERA5 observations, particularly in the latter half of the period.
- ERA5 displays a distinct upward trend throughout the 1990s that is not reproduced by the models, narrowing the model-observation gap over time.
- Initial drift is visible in the ICON simulation (decreasing trend) and to a lesser extent in ifs-fesom during the first ~5 years (1990-1995), indicating spin-up adjustments.
Spatial Patterns
N/A (Global mean time series). Temporally, models are relatively stable after initial spin-up, whereas ERA5 shows a decadal-scale increase likely related to observing system changes.
Model Agreement
The two IFS-based models (nemo and fesom) cluster closer to the CMIP6 mean than ICON. ICON is a distinct outlier with higher precipitation rates throughout the simulation.
Physical Interpretation
Global mean precipitation is energetically constrained by atmospheric radiative cooling. The systematic wet bias, particularly in ICON, suggests either excessive radiative cooling driving higher latent heat release or parameterisation tuning that favours vigorous convection. The discrepancy with ERA5 is common, as reanalysis precipitation is a forecast product influenced by changing data assimilation inputs (e.g., satellite era shifts), making its long-term trend unreliable compared to the energetic constraints in free-running models.
Caveats
- ERA5 precipitation is not a direct observation but a model-derived forecast product known to have spurious trends; GPCP is typically a more robust benchmark for global means.
- Spin-up drift is evident in the early years (1990-1994), particularly for ICON, complicating the assessment of equilibrium climate states.
Mean Sea Level Pressure Global Mean Time Series
| Variables | psl |
|---|---|
| Models | ifs-fesom, ifs-nemo, icon |
| Reference Dataset | ERA5 |
| Units | Pa |
| Period | 1990–2014 |
Summary high
Time series analysis of global mean Mean Sea Level Pressure (MSLP) from 1990–2014, comparing three high-resolution DestinE models (ifs-fesom, ifs-nemo, icon) against ERA5 reanalysis and the CMIP6 multi-model mean.
Key Findings
- ICON displays a significant systematic negative bias of approximately 35–40 Pa relative to ERA5 observations and the IFS models.
- IFS-NEMO and IFS-FESOM show excellent agreement with ERA5 annual means, tracking the observational variability and magnitude (approx. 101140 Pa) very closely.
- All high-resolution models exhibit a strong seasonal cycle with an amplitude of ~60 Pa, peaking in boreal summer, which is notably larger than the amplitude of the CMIP6 multi-model mean seasonality.
- Long-term trends are minimal across all datasets, though ERA5 shows a slight localized increase around 2010 which is partially captured by the IFS models.
Spatial Patterns
While this is a global mean time series, the temporal pattern is dominated by a strong seasonal cycle (peaking mid-year) and inter-annual variability that is remarkably consistent between the IFS variants and observations.
Model Agreement
There is high agreement between the two IFS variants (FESOM and NEMO), which both match the ERA5 annual mean closely. ICON is an outlier with a constant negative offset. The CMIP6 MMM lies between the IFS/Obs cluster and ICON, with dampened seasonality.
Physical Interpretation
Global mean MSLP seasonality is primarily driven by the annual cycle of global atmospheric water vapor mass (peaking in NH summer) and temperature-dependent reduction to sea level over topography. The systematic offset in ICON likely indicates a difference in total atmospheric mass initialization, conservation, or the method used for pressure reduction to sea level (e.g., temperature assumptions over high orography).
Caveats
- Global mean MSLP is a derived quantity involving extrapolation below topography; biases may reflect reduction algorithms rather than true atmospheric mass errors.
- The CMIP6 MMM seasonal amplitude dampening may result from averaging phase-shifted models or lower resolution physics.
Surface Downwelling Longwave Global Mean Time Series

| Variables | rlds |
|---|---|
| Models | ifs-fesom, ifs-nemo, icon |
| Reference Dataset | ERA5 |
| Units | W/m2 |
| Period | 1990–2014 |
Summary high
This time series displays the global mean surface downwelling longwave radiation (rlds) from 1990 to 2014, comparing DestinE models (ifs-fesom, ifs-nemo, icon) and the CMIP6 multi-model mean against ERA5 reanalysis.
Key Findings
- ICON and ifs-nemo show excellent agreement with ERA5 observations, tracking the annual mean and interannual variability within approximately 1 W/m².
- ifs-fesom exhibits a notable positive bias that increases over time (drift), starting ~2 W/m² high and diverging to >4 W/m² above observations by 2014.
- The CMIP6 Multi-Model Mean displays a systematic, nearly constant positive bias of roughly 2–3 W/m² relative to ERA5 throughout the period.
- All models successfully capture the transient reduction in downwelling longwave radiation (~1991–1993) associated with the cooling effects of the Mt. Pinatubo eruption.
Spatial Patterns
While spatially aggregated, the temporal evolution shows a clear upward trend in all datasets consistent with global warming, punctuated by the 1991 volcanic cooling event. The seasonal amplitude appears consistent across models.
Model Agreement
There is high agreement between ICON, ifs-nemo, and ERA5. However, ifs-fesom diverges significantly from this group and from its sibling model ifs-nemo, indicating a specific issue with the FESOM coupling configuration.
Physical Interpretation
Surface downwelling longwave radiation is primarily driven by atmospheric temperature, water vapor content, and cloud cover. The divergence of ifs-fesom (blue) from ifs-nemo (orange)—which share the same IFS atmospheric component—suggests that the FESOM ocean component creates warmer Sea Surface Temperatures (SSTs) or different sea-ice feedbacks, leading to a warmer, moister atmosphere and excess downward radiation. The systematic CMIP6 bias likely reflects widespread issues in cloud parameterization or mean-state biases in traditional climate models.
Caveats
- Global means can mask significant regional compensating biases (e.g., errors in the ITCZ vs. polar regions).
- The reference 'Obs' is ERA5 reanalysis, which, while robust, relies on its own radiative transfer model.
Surface Net Longwave Radiation Global Mean Time Series

| Variables | rls |
|---|---|
| Models | ifs-fesom, ifs-nemo, icon |
| Reference Dataset | ERA5 |
| Units | W/m2 |
| Period | 1990–2014 |
Summary high
All three high-resolution models exhibit a systematic positive bias (insufficient surface cooling) in global mean surface net longwave radiation of approximately 1–2 W/m² compared to ERA5 reanalysis over the 1990–2014 period.
Key Findings
- Models consistently underestimate the magnitude of net surface longwave cooling (values are less negative than ERA5 observations throughout the time series).
- ICON demonstrates slightly better agreement with observations than the IFS variants (ifs-fesom and ifs-nemo), maintaining a smaller bias particularly between 2000 and 2012.
- Interannual variability is captured well by all models, including the dip in the early 1990s (likely Pinatubo aftermath) and the peak around the 1998 El Niño event.
Spatial Patterns
Temporal evolution shows a distinct dip in net radiation (more negative) around 1992–1994 followed by a recovery, consistent across models and observations. A slight upward trend (values becoming less negative) is visible in the IFS models towards the end of the simulation period (2010–2014).
Model Agreement
The two IFS-based models (ifs-fesom and ifs-nemo) track each other very closely, indicating that the ocean model coupling (FESOM vs NEMO) has minimal impact on global mean surface longwave fluxes compared to the atmospheric physics. ICON follows the same temporal phase but with a persistently lower mean value (closer to ERA5).
Physical Interpretation
The positive bias (values less negative than observations) implies that the models are either simulating excessive Downward Longwave Radiation (likely due to positive biases in lower tropospheric humidity or cloud cover) or insufficient Upward Longwave Radiation (associated with surface cold biases). Given typical model behavior, excessive atmospheric opacity/cloudiness is the more probable driver.
Caveats
- ERA5 is a reanalysis product and not a direct observation; surface radiative fluxes in reanalyses rely heavily on model physics.
- The magnitude of the bias (~1.5 W/m²) is small relative to gross fluxes but significant for the surface energy budget.
Surface Net Longwave Radiation (Clear-Sky) Global Mean Time Series

| Variables | rlscs |
|---|---|
| Models | ifs-fesom, ifs-nemo, icon |
| Reference Dataset | ERA5 |
| Units | W/m2 |
| Period | 1990–2014 |
Summary high
Global mean time series of clear-sky surface net longwave radiation (1990–2014) showing distinct radiative regimes: IFS-based models exhibit a positive bias (insufficient surface cooling), while ICON exhibits a strong negative bias (excessive surface cooling) relative to ERA5.
Key Findings
- ICON displays a large negative bias of approximately -4 to -5 W/m² relative to ERA5, indicating significantly stronger net surface radiative cooling.
- IFS-NEMO and IFS-FESOM show positive biases (values less negative than observations), with IFS-FESOM being the most positively biased (~+2.5 W/m²), suggesting insufficient net surface energy loss.
- IFS-FESOM is consistently ~1–1.5 W/m² higher (less negative) than IFS-NEMO, likely driven by colder surface temperatures in the FESOM coupling reducing upward emission.
- All models capture the interannual variability seen in observations, including a notable decrease in net radiation (more negative) in the early 1990s, likely associated with the Mt. Pinatubo eruption aftermath.
Spatial Patterns
N/A (Global mean time series). Temporally, a dip in the early 1990s (1992–1994) is visible in all datasets, followed by a gradual recovery and slight upward trend (less negative net radiation) through the 2000s.
Model Agreement
The two IFS models track each other closely in variability (r ~ 1), separated by a near-constant offset, reflecting their shared atmospheric physics but differing ocean states. ICON shows similar low-frequency variability but operates in a distinctly different radiative regime (much stronger cooling). IFS-NEMO is closest to the ERA5 reference.
Physical Interpretation
Surface Net LW (Clear-Sky) is dominated by the balance between upward surface emission (dependent on SST) and downward atmospheric emission (dependent on water vapor/temperature). ICON's strong negative bias implies either excessive surface temperatures (unlikely) or, more probably, a deficient downward longwave flux (too dry/transparent atmosphere). The IFS models' positive bias suggests the inverse (too moist/emissive atmosphere). The offset between IFS-FESOM and IFS-NEMO is consistent with FESOM having colder global mean SSTs; colder surfaces emit less upward radiation, resulting in a less negative (closer to zero) net balance.
Caveats
- The observational reference is ERA5, which shares model physics with the IFS lineage, potentially inflating the apparent skill of IFS-NEMO.
- Clear-sky diagnostics are sensitive to the sampling methodology (e.g., radiative transfer calculations with clouds removed vs. sampling only clear columns).
TOA Net Longwave Radiation Global Mean Time Series
| Variables | rlt |
|---|---|
| Models | ifs-fesom, ifs-nemo, icon |
| Reference Dataset | ERA5 |
| Units | W/m2 |
| Period | 1990–2014 |
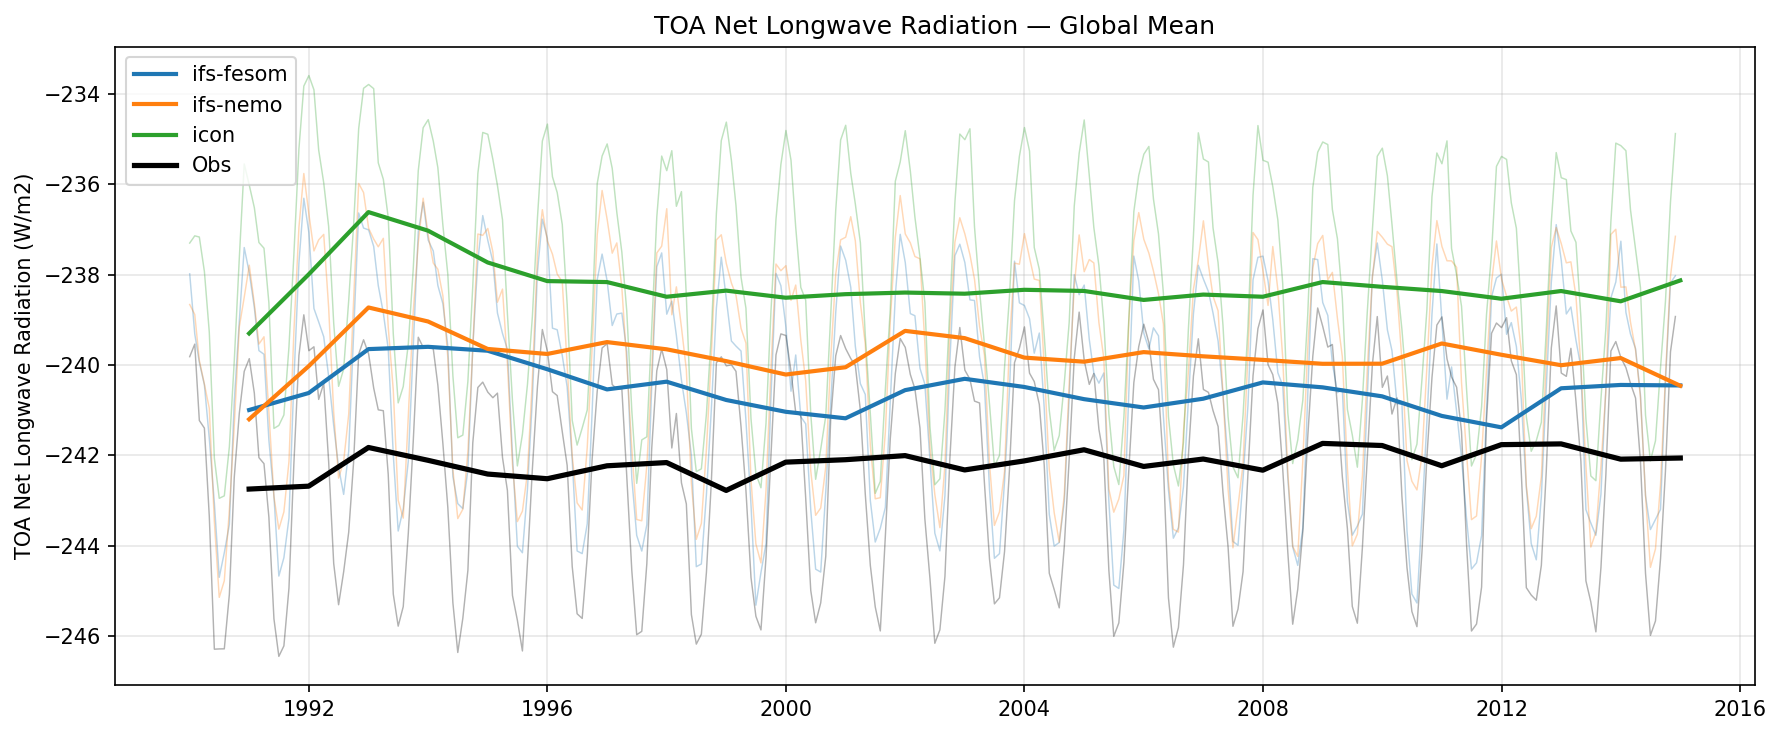
Summary high
Global mean time series of TOA Net Longwave Radiation (1990–2014) comparing three high-resolution coupled models (IFS-FESOM, IFS-NEMO, ICON) against ERA5 reanalysis.
Key Findings
- All models exhibit a positive bias (values less negative) relative to ERA5, indicating they simulate less Outgoing Longwave Radiation (OLR) than the reanalysis.
- IFS-FESOM tracks ERA5 most closely (bias ~ +1.5 W/m²), followed by IFS-NEMO (~ +2 W/m²), while ICON shows the largest deviation (~ +4 W/m²) and sits furthest from the reference.
- The radiative response to the 1991 Mt. Pinatubo eruption is clearly visible in all datasets as a temporary increase in Net LW (reduction in OLR) around 1992.
- ICON displays a noticeably larger seasonal cycle amplitude compared to the IFS-based models and the observational baseline.
Spatial Patterns
While this is a global mean time series, the temporal evolution shows a distinct inter-annual anomaly in the early 1990s corresponding to the Pinatubo eruption. The seasonal cycle is prominent, with ICON showing sharper peaks and troughs than the other models.
Model Agreement
The models maintain a consistent ranking throughout the period (ICON > IFS-NEMO > IFS-FESOM > ERA5). IFS-FESOM and IFS-NEMO (sharing the same atmospheric component) are clustered closer together than ICON, suggesting the atmospheric physics (IFS vs ICON) is the primary driver of the LW bias, though the ocean coupling (FESOM vs NEMO) introduces a smaller secondary shift.
Physical Interpretation
The positive bias in TOA Net LW (equivalent to underestimating OLR) suggests the models may have excessive high cloud cover, higher water vapor content, or cooler effective emitting temperatures than ERA5. The perturbation around 1992 confirms the models respond to stratospheric aerosol forcing (Pinatubo), which absorbs terrestrial radiation and reduces OLR. It is worth noting that standard CERES EBAF satellite climatology typically places global Net LW around -240 W/m²; in this context, IFS-NEMO and IFS-FESOM may actually be closer to satellite truth than the ERA5 reference shown here (-242 W/m²).
Caveats
- The analysis treats ERA5 as the ground truth; however, ERA5 OLR (-242 W/m²) is slightly higher than standard CERES EBAF values (~240 W/m²), which affects the interpretation of 'bias'.
- Global means can mask compensating regional errors (e.g., tropical vs. polar biases).
TOA Net Longwave Radiation (Clear-Sky) Global Mean Time Series
| Variables | rltcs |
|---|---|
| Models | ifs-fesom, ifs-nemo, icon |
| Reference Dataset | ERA5 |
| Units | W/m2 |
| Period | 1990–2014 |
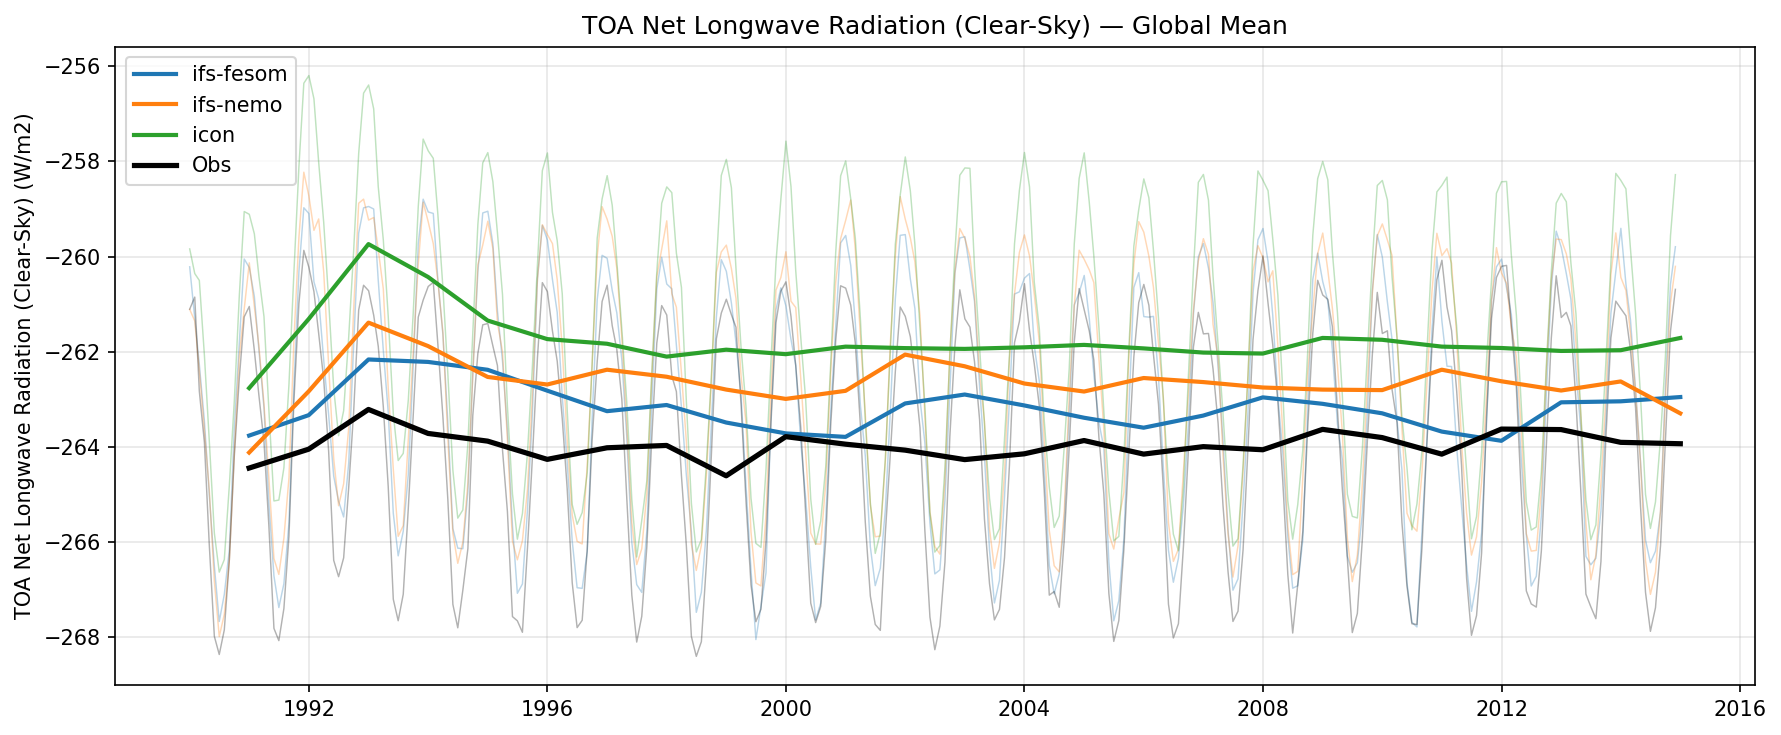
Summary high
This time series compares the global mean top-of-atmosphere (TOA) clear-sky net longwave radiation from three high-resolution coupled models against ERA5 reanalysis for the period 1990–2014. All models simulate less outgoing longwave radiation (values are less negative) than ERA5, with ifs-fesom showing the closest agreement.
Key Findings
- All models exhibit a positive bias (less outgoing radiation) relative to ERA5, ranging from ~0.5 W/m² to ~2.5 W/m².
- ifs-fesom demonstrates the highest skill, tracking the ERA5 reference very closely with the smallest bias (< 1 W/m²).
- icon shows the largest deviation, consistently emitting ~2 W/m² less clear-sky longwave radiation than ERA5.
- A temporary increase in net radiation (less outgoing energy) is visible around 1992–1993 across all datasets, likely reflecting surface cooling following the Mt. Pinatubo eruption.
Spatial Patterns
The time series is dominated by a strong seasonal cycle which is consistently reproduced by all models in phase and approximate amplitude. Interannual variability is coherent between models and observations.
Model Agreement
There is a systematic spread among the models. The two IFS-based models (ifs-fesom and ifs-nemo) perform differently, with ifs-fesom aligning much better with observations than ifs-nemo. icon is the outlier with the lowest outgoing flux. The divergence between ifs-fesom and ifs-nemo implies that the choice of ocean model (and resulting SSTs) significantly impacts the clear-sky radiation budget.
Physical Interpretation
The variable shown is net longwave (outgoing is negative), so the models' higher (less negative) values indicate they are emitting less radiation to space than ERA5. In clear-sky conditions, reduced outgoing longwave radiation is typically driven by either cooler surface temperatures (Stefan-Boltzmann law) or a moister atmosphere (enhanced greenhouse effect). The difference between ifs-fesom and ifs-nemo suggests that ifs-nemo may have a colder global mean SST bias or different humidity response compared to ifs-fesom.
Caveats
- The observation reference is ERA5 reanalysis, which itself relies on a radiative transfer model, rather than direct satellite observations like CERES.
- Clear-sky fluxes are diagnostic quantities calculated by removing cloud effects; differences in sampling or definition of 'clear-sky' between models and reanalysis could contribute to biases.
Surface Downwelling Shortwave Global Mean Time Series
| Variables | rsds |
|---|---|
| Models | ifs-fesom, ifs-nemo, icon |
| Reference Dataset | ERA5 |
| Units | W/m2 |
| Period | 1990–2014 |
Summary high
This time series analyzes global mean surface downwelling shortwave radiation (rsds) from 1990 to 2014, comparing three high-resolution DestinE models (ifs-fesom, ifs-nemo, icon) against ERA5 reanalysis and the CMIP6 multi-model mean.
Key Findings
- ICON shows excellent agreement with ERA5, closely tracking the observational baseline (~188 W/m²) and its inter-annual variability.
- Both IFS-based models (ifs-fesom and ifs-nemo) exhibit a systematic negative bias of approximately 1.5–2.5 W/m² relative to ERA5, indicating less solar radiation reaching the surface.
- The CMIP6 multi-model mean displays a substantial positive bias (~3–4 W/m² above ERA5), suggesting the high-resolution models generally reproduce atmospheric attenuation better than the CMIP6 average, although the IFS variants slightly overcorrect.
- All models successfully capture the volcanic dimming signal following the 1991 Mt. Pinatubo eruption, showing a distinct dip in surface insolation around 1992–1993.
Spatial Patterns
The seasonal cycle amplitude is notably larger in the CMIP6 mean than in the high-resolution models or ERA5. The temporal evolution shows a recovery from the Pinatubo minimum (early 1990s) followed by a relatively stable plateau post-2000.
Model Agreement
There is virtually no difference between ifs-fesom and ifs-nemo (the lines overlap), confirming that the choice of ocean model (unstructured vs. structured grid) has negligible impact on global mean atmospheric radiative transfer. ICON aligns best with observations, while IFS models cluster together with a slight low bias.
Physical Interpretation
Differences in surface shortwave radiation are primarily driven by cloud cover properties (fraction, optical depth) and aerosol loading. The positive bias in CMIP6 is consistent with a known tendency for some coupled models to underestimate cloud shading ('too hot'). The negative bias in the IFS runs suggests they may have slightly excessive cloud optical depth or aerosol attenuation compared to ERA5. ICON's physics tuning appears to match the radiative state of the ERA5 reanalysis most closely.
Caveats
- ERA5 surface radiative fluxes are generated by its forecast model physics and are not direct observations, meaning agreement with ICON could partly reflect similar physical parameterisations.
- Global mean values can obscure compensating regional errors (e.g., systematic biases in stratocumulus decks versus the ITCZ).
Surface Net Shortwave Radiation Global Mean Time Series
| Variables | rss |
|---|---|
| Models | ifs-fesom, ifs-nemo, icon |
| Reference Dataset | ERA5 |
| Units | W/m2 |
| Period | 1990–2014 |
Summary high
Time series of global mean surface net shortwave radiation (1990–2014) showing a systematic negative bias in all models compared to ERA5, with ICON performing closest to the reference.
Key Findings
- All three models underestimate global mean surface net shortwave radiation relative to ERA5, with biases ranging from approximately -1.0 W/m² (ICON) to -2.0 W/m² (IFS variants).
- IFS-FESOM and IFS-NEMO exhibit nearly identical variability and mean states, suggesting that the atmospheric model physics (OpenIFS) dominates this metric rather than the choice of ocean model.
- A distinct reduction in surface shortwave radiation (~2-3 W/m²) is visible in both models and observations during 1991–1993, capturing the response to the Mount Pinatubo volcanic eruption.
Spatial Patterns
While spatial patterns are not shown, the temporal evolution reveals a strong seasonal cycle (amplitude ~15 W/m²) and significant interannual variability driven by external forcing (volcanic aerosols). The post-Pinatubo recovery is clearly resolved by all systems.
Model Agreement
Models show high temporal correlation with observations, correctly capturing the phase of the seasonal cycle and interannual events like the Pinatubo eruption. However, there is a persistent offset in magnitude, with ICON showing better agreement (smaller bias) than the two IFS-based simulations.
Physical Interpretation
The negative bias implies that less solar radiation reaches and is absorbed by the surface in the models than in ERA5. This is likely driven by excessive cloud optical depth, cloud cover, or atmospheric aerosol extinction in the model physics. The strong agreement between IFS-FESOM and IFS-NEMO confirms that surface shortwave fluxes are primarily determined by atmospheric processing rather than ocean surface boundary conditions.
Caveats
- ERA5 is a reanalysis product and may contain its own biases in radiative transfer compared to direct satellite products like CERES.
- Global means may mask compensating regional errors (e.g., opposite biases in stratocumulus vs. trade cumulus regions).
Surface Net Shortwave Radiation (Clear-Sky) Global Mean Time Series

| Variables | rsscs |
|---|---|
| Models | ifs-fesom, ifs-nemo, icon |
| Reference Dataset | ERA5 |
| Units | W/m2 |
| Period | 1990–2014 |
Summary high
Time series of global-mean surface net clear-sky shortwave radiation (1990–2014) comparing three coupled models against ERA5 reanalysis, highlighting systematic biases and the response to volcanic forcing.
Key Findings
- All models and ERA5 capture a distinct radiative dip (~3–5 W/m²) from 1991 to 1994, confirming the correct implementation of historic volcanic aerosol forcing (Mt. Pinatubo).
- ICON shows a positive bias of approximately +1.5 W/m² relative to ERA5, indicating higher transparency or lower surface albedo in clear-sky conditions.
- Both IFS-based models (ifs-fesom and ifs-nemo) exhibit a negative bias of roughly -2.5 W/m² compared to ERA5.
- The two IFS variants track very closely, though ifs-nemo is marginally higher (~0.2 W/m²) than ifs-fesom, suggesting the atmospheric configuration dominates this metric with minor modulation from the ocean/ice coupling.
Spatial Patterns
The dominant temporal feature is the sharp reduction in surface shortwave energy following the 1991 Pinatubo eruption, with recovery to a stable baseline by ~1995. The seasonal cycle amplitude is consistent across models.
Model Agreement
Models agree on the timing and shape of the volcanic response but disagree on the mean state, forming three distinct tiers: ICON (highest), ERA5 (middle), and IFS models (lowest).
Physical Interpretation
The 1991–1993 dip is driven by stratospheric aerosols from the Mt. Pinatubo eruption scattering incoming solar radiation. The systematic mean-state differences likely result from varying atmospheric radiative transfer schemes (absorption by water vapor/aerosols) or differences in global mean surface albedo (which affects net surface radiation). The clustering of IFS-FESOM and IFS-NEMO confirms that the atmospheric component (OpenIFS) is the primary driver of clear-sky radiative fluxes.
Caveats
- The reference dataset is ERA5 reanalysis, not direct satellite observations (like CERES EBAF), meaning biases are relative to the ERA5 radiative transfer model.
- Differences in how 'clear-sky' fluxes are diagnosed (e.g., radiative call with clouds removed vs. sampling clear pixels) can contribute to static offsets.
TOA Net Shortwave Radiation Global Mean Time Series
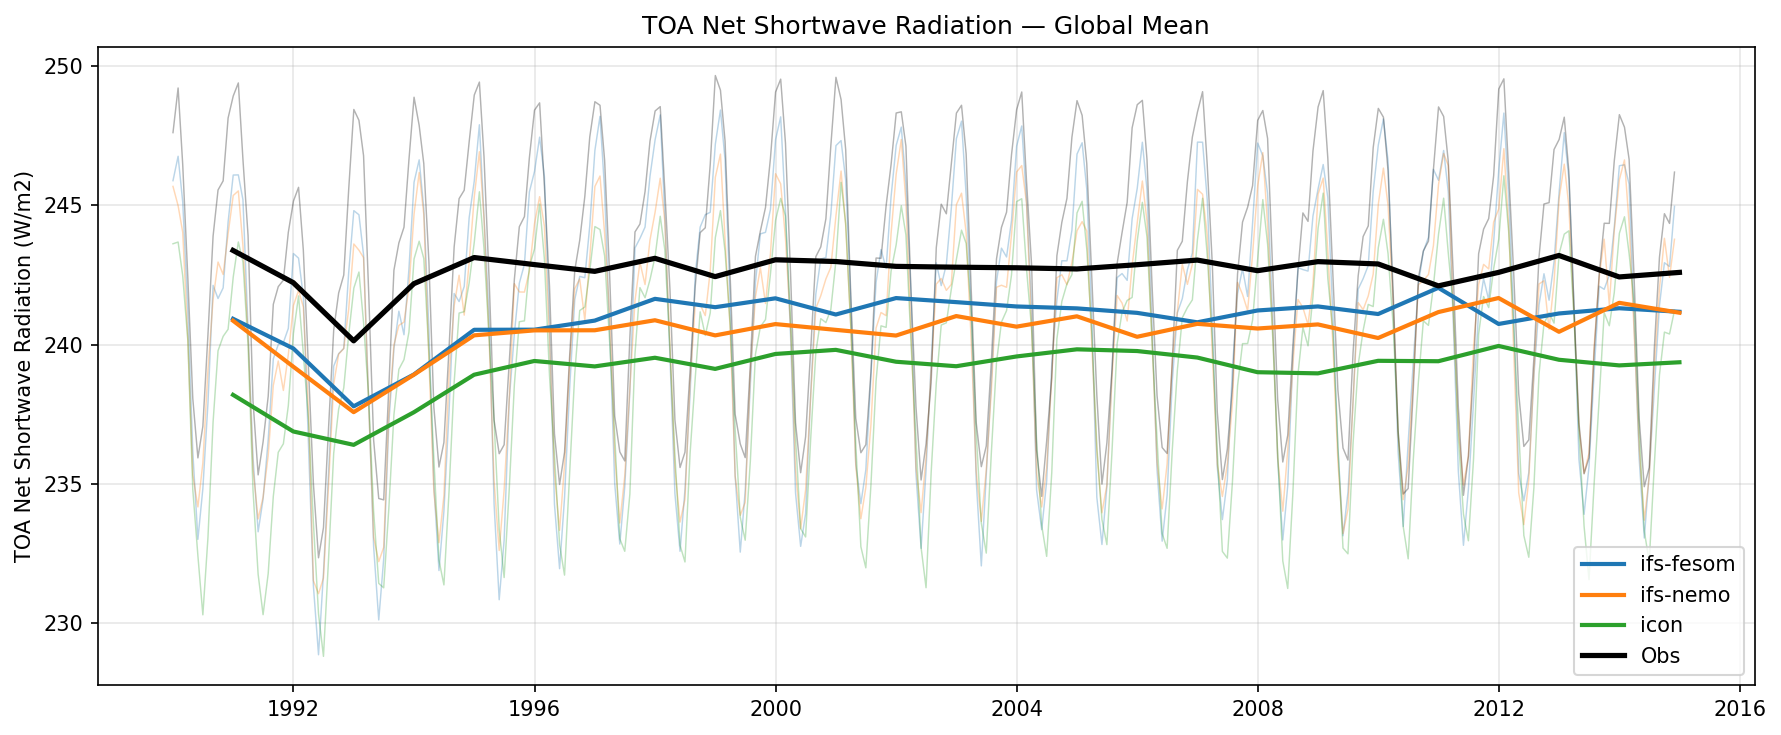
| Variables | rst |
|---|---|
| Models | ifs-fesom, ifs-nemo, icon |
| Reference Dataset | ERA5 |
| Units | W/m2 |
| Period | 1990–2014 |
Summary high
Global mean time series of TOA Net Shortwave Radiation (1990–2014) comparing three high-resolution models against ERA5 reanalysis.
Key Findings
- All three models exhibit a systematic negative bias relative to ERA5, indicating they reflect too much shortwave radiation (higher planetary albedo).
- ifs-fesom and ifs-nemo are nearly indistinguishable in the annual mean, tracking approximately 2 W/m² below observations (~241 W/m² vs ~243 W/m²).
- icon shows the largest bias, tracking approximately 3.5–4 W/m² below observations (~239.5 W/m²).
- The 1991 Mount Pinatubo eruption signature is clearly visible as a ~2–3 year dip in net shortwave radiation in both models and observations.
Spatial Patterns
The dominant temporal feature is the sharp decline in net shortwave radiation around 1991–1993 followed by a recovery, corresponding to volcanic aerosol forcing. Post-1995, the time series are relatively stable with no strong multi-decadal trends.
Model Agreement
ifs-fesom and ifs-nemo show high agreement with each other (overlapping curves). icon is distinct with a lower mean state. All models agree well with observations on the timing of the Pinatubo response and the phase of the seasonal cycle (thin lines).
Physical Interpretation
The negative bias in TOA Net Shortwave Radiation implies that the models have a higher planetary albedo than the ERA5 reanalysis. This is most likely driven by excessive Cloud Radiative Effects (CRE)—models producing too many or too bright clouds—or potentially differences in surface albedo (e.g., sea ice). The dip in the early 1990s demonstrates the models' response to stratospheric aerosol loading from the Pinatubo eruption, increasing reflection.
Caveats
- The reference dataset is ERA5 reanalysis, which itself relies on a model and may have slight offsets compared to direct satellite products like CERES EBAF.
- Global mean values mask potential compensating regional errors (e.g., tropical vs. polar cloud biases).
TOA Net Shortwave Radiation (Clear-Sky) Global Mean Time Series
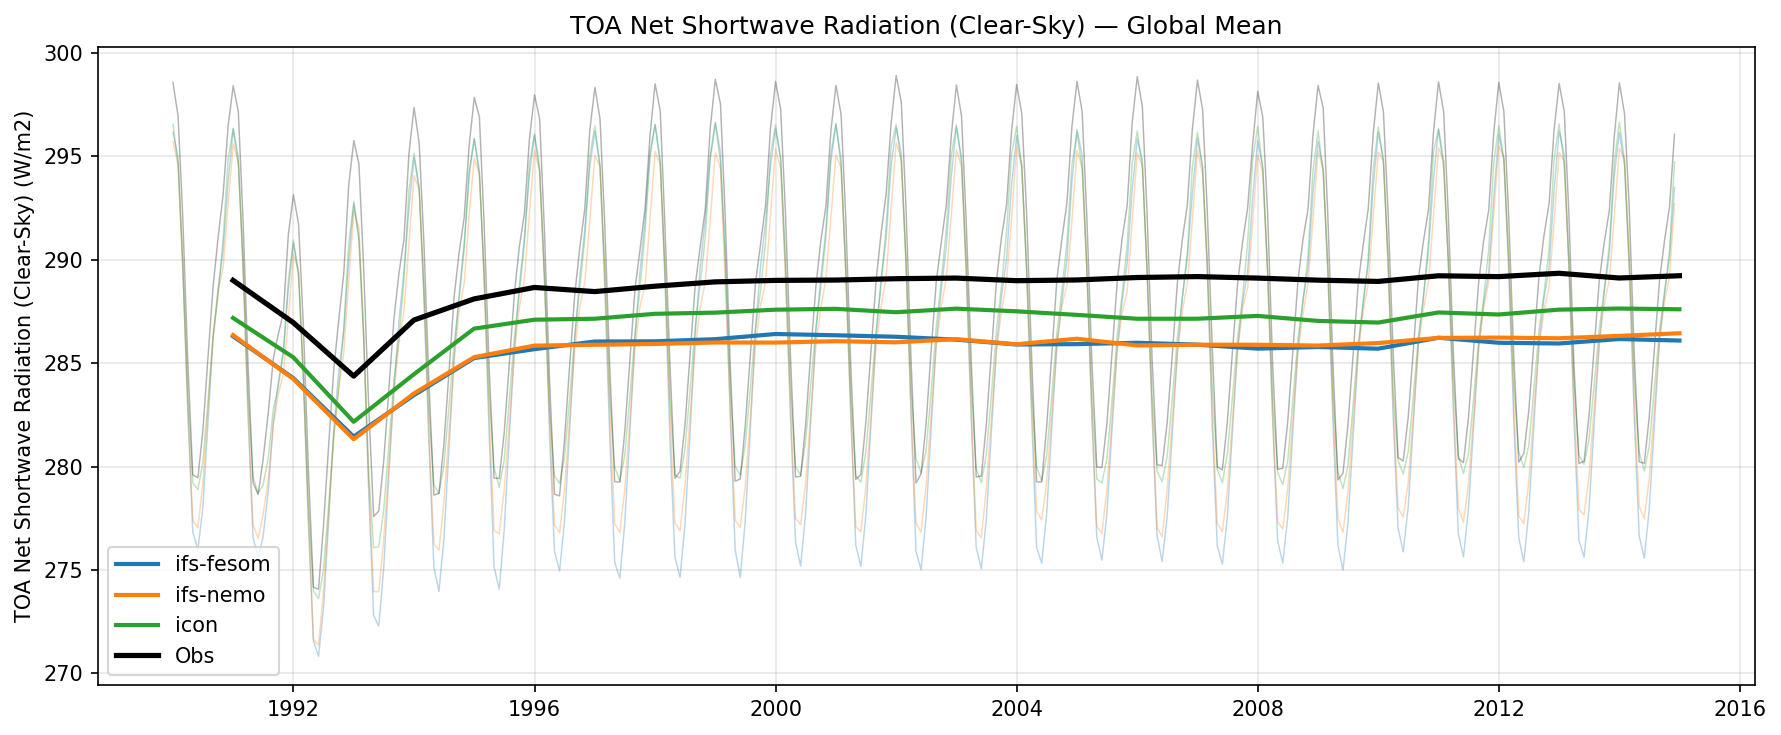
| Variables | rstcs |
|---|---|
| Models | ifs-fesom, ifs-nemo, icon |
| Reference Dataset | ERA5 |
| Units | W/m2 |
| Period | 1990–2014 |
Summary high
Time series analysis of global mean clear-sky TOA net shortwave radiation (1990–2014) comparing three high-resolution models against ERA5 reanalysis, highlighting volcanic forcing response and static biases.
Key Findings
- All models and observations show a distinct ~5 W/m² reduction in clear-sky net shortwave radiation during 1991–1993, correctly capturing the radiative forcing from the Mt. Pinatubo volcanic eruption.
- Models exhibit a systematic negative bias relative to ERA5 (obs ~289 W/m²): ICON is closest (~287.5 W/m², bias -1.5 W/m²), while both IFS variants are lower (~286 W/m², bias -3 W/m²).
- IFS-FESOM and IFS-NEMO time series are virtually identical, confirming that global mean clear-sky SW radiation is dominated by the atmospheric component (IFS) and is insensitive to the choice of ocean model (FESOM vs. NEMO).
Spatial Patterns
N/A (Global mean time series). The temporal pattern is dominated by the seasonal cycle (Earth-Sun distance and hemispheric albedo asymmetry) and the singular Pinatubo event.
Model Agreement
High correlation in temporal variability (seasonal cycle and volcanic response) across all datasets. However, there is a persistent offset in magnitude, with ICON showing better agreement with ERA5 than the IFS-based models.
Physical Interpretation
The reduction in Net SW during the early 1990s reflects increased scattering of incoming solar radiation by stratospheric sulfate aerosols from the Pinatubo eruption, increasing planetary albedo even under clear-sky conditions. The negative bias in models implies they have a slightly higher clear-sky planetary albedo (either due to surface albedo parameterizations or atmospheric aerosol/water vapor scattering) compared to ERA5.
Caveats
- Differences in 'clear-sky' definitions (e.g., aerosol treatment) between models and reanalysis can contribute to biases.
- ERA5 is a reanalysis product; direct satellite observations (e.g., CERES) might provide a slightly different absolute reference.
2m Temperature Global Mean Time Series

| Variables | tas |
|---|---|
| Models | ifs-fesom, ifs-nemo, icon |
| Reference Dataset | ERA5 |
| Units | K |
| Period | 1990–2014 |
Summary high
Time series analysis of global mean 2m temperature (1990–2014) comparing three high-resolution models against ERA5 reanalysis and the CMIP6 multi-model mean. The IFS-based models track observations closely, while ICON exhibits a systematic cold bias.
Key Findings
- ICON displays a persistent global mean cold bias of approximately 0.7–0.8 K relative to ERA5 throughout the simulation period.
- IFS-FESOM shows the highest skill in reproducing the observed global mean temperature and interannual variability, tracking ERA5 very closely (typically within 0.1–0.2 K).
- IFS-NEMO captures the general magnitude well but exhibits a slight multi-decadal cooling drift between 2000–2010 before recovering, deviating more from observations than IFS-FESOM.
- The seasonal cycle amplitude in ICON is larger than observed, with deeper seasonal minima (NH winter dominance) contributing significantly to its overall cold bias.
Spatial Patterns
The time series is dominated by the annual seasonal cycle (thin lines), driven by the Northern Hemisphere landmass thermal response. Interannual variability, such as the post-Pinatubo cooling (~1992–1993), is visible in both observations and models, indicating appropriate external forcing integration.
Model Agreement
IFS-FESOM and IFS-NEMO are in good agreement with ERA5 and the CMIP6 MMM baseline. ICON is a distinct outlier, separated from the other models and observations by a consistent negative offset, though it shares the same phase and similar interannual trend features.
Physical Interpretation
The systematic cold bias in ICON suggests a global energy balance issue, potentially arising from excessive planetary albedo (cloud radiative effects) or insufficient ocean heat retention. The amplified seasonal cycle in ICON (specifically colder minima) points to stronger cooling over Northern Hemisphere land masses or excessive sea ice extent in winter. The IFS models demonstrate well-tuned radiative balances at this resolution.
Caveats
- Global mean metrics can mask significant compensating regional biases (e.g., warm tropics canceling cold poles).
- The cause of ICON's cold bias cannot be fully diagnosed without radiation budget or sea ice extent figures.
10m U Wind Global Mean Time Series
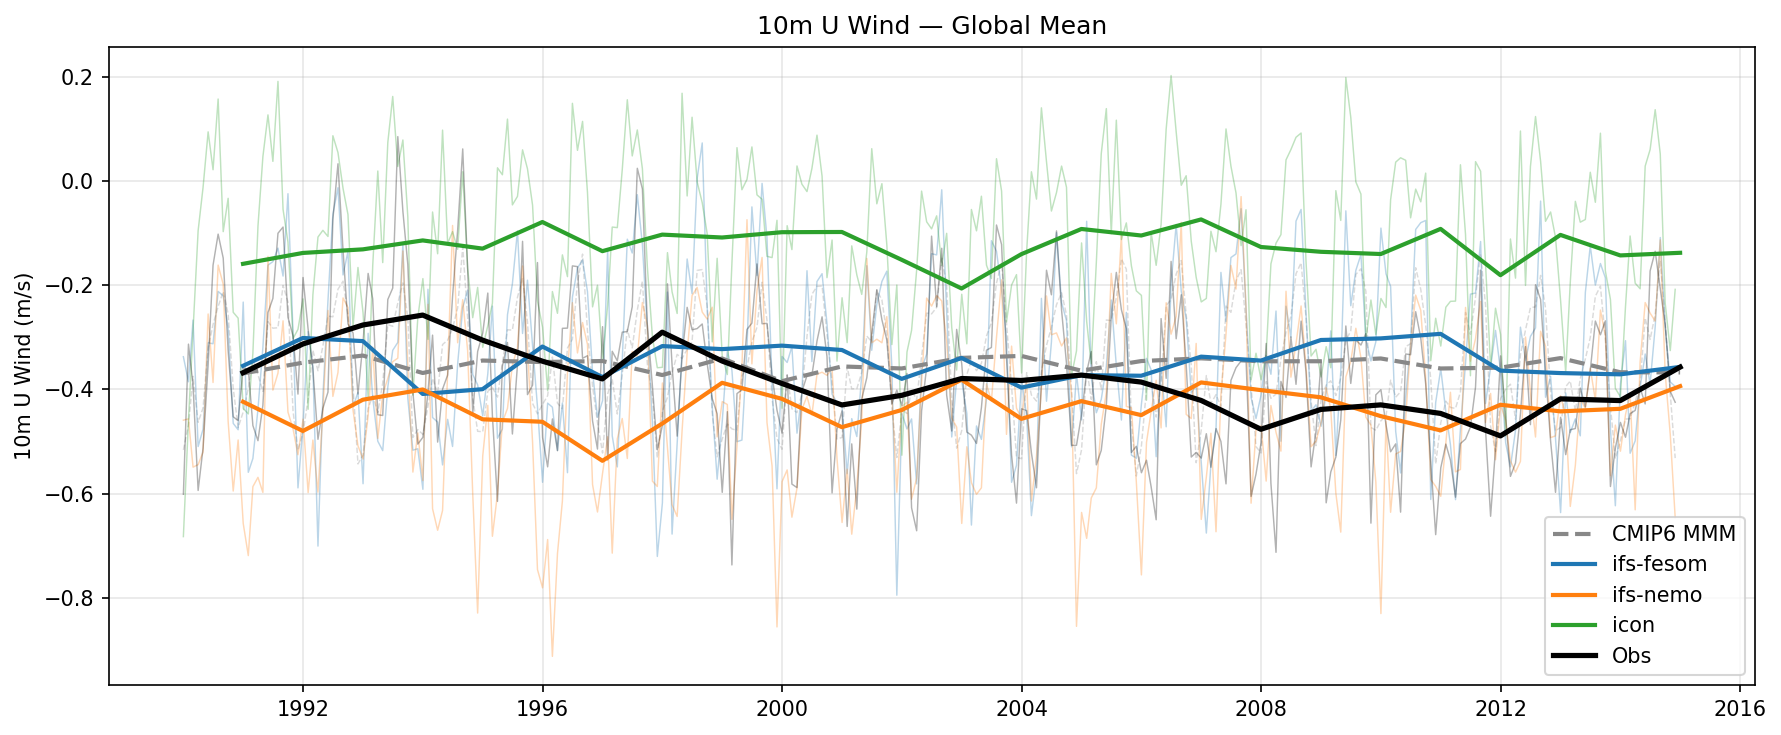
| Variables | uas |
|---|---|
| Models | ifs-fesom, ifs-nemo, icon |
| Reference Dataset | ERA5 |
| Units | m/s |
| Period | 1990–2014 |
Summary high
Time series analysis of global mean 10m zonal wind (U-wind) for 1990–2014 comparing three high-resolution coupled models against ERA5 reanalysis and the CMIP6 multi-model mean.
Key Findings
- The global mean 10m U-wind is negative (~ -0.4 m/s) in observations, reflecting the dominance of tropical easterlies over mid-latitude westerlies by surface area.
- ICON displays a substantial systematic positive bias (~ +0.25 m/s), indicating significantly weaker net easterlies or stronger westerlies than observed.
- IFS-FESOM shows the best agreement with ERA5 in terms of climatological mean, with a very slight positive bias (< 0.05 m/s), while IFS-NEMO exhibits a slight negative bias (~ -0.05 m/s).
- Internal variability on interannual timescales is evident in the individual models and observations, contrasting with the smooth CMIP6 multi-model mean.
Spatial Patterns
While this is a global mean time series, the temporal evolution shows distinct interannual fluctuations (amplitude ~0.1 m/s). The IFS-based models (FESOM and NEMO) show similar decadal variability tendencies to each other, which differ from ICON, likely due to their shared atmospheric core.
Model Agreement
IFS-FESOM and IFS-NEMO bracket the observational curve, showing high skill in capturing the mean state. ICON is a clear outlier with a mean state roughly 50% lower in magnitude (less negative) than the reference.
Physical Interpretation
The global negative mean results from the large surface area of the trade winds. The difference between IFS-FESOM and IFS-NEMO—which likely share the same atmospheric physics (IFS)—demonstrates the sensitivity of surface winds to the underlying ocean state (SSTs) and sea-ice coupling provided by the different ocean models. ICON's positive bias suggests a fundamental structural difference, possibly in surface drag parameterization or the strength of the Hadley circulation.
Caveats
- Global averaging obscures regional error compensation (e.g., trade wind bias vs. storm track bias).
- As these are likely free-running coupled simulations, the phasing of interannual variability (e.g., ENSO) is not expected to match historical observations year-for-year.
10m V Wind Global Mean Time Series
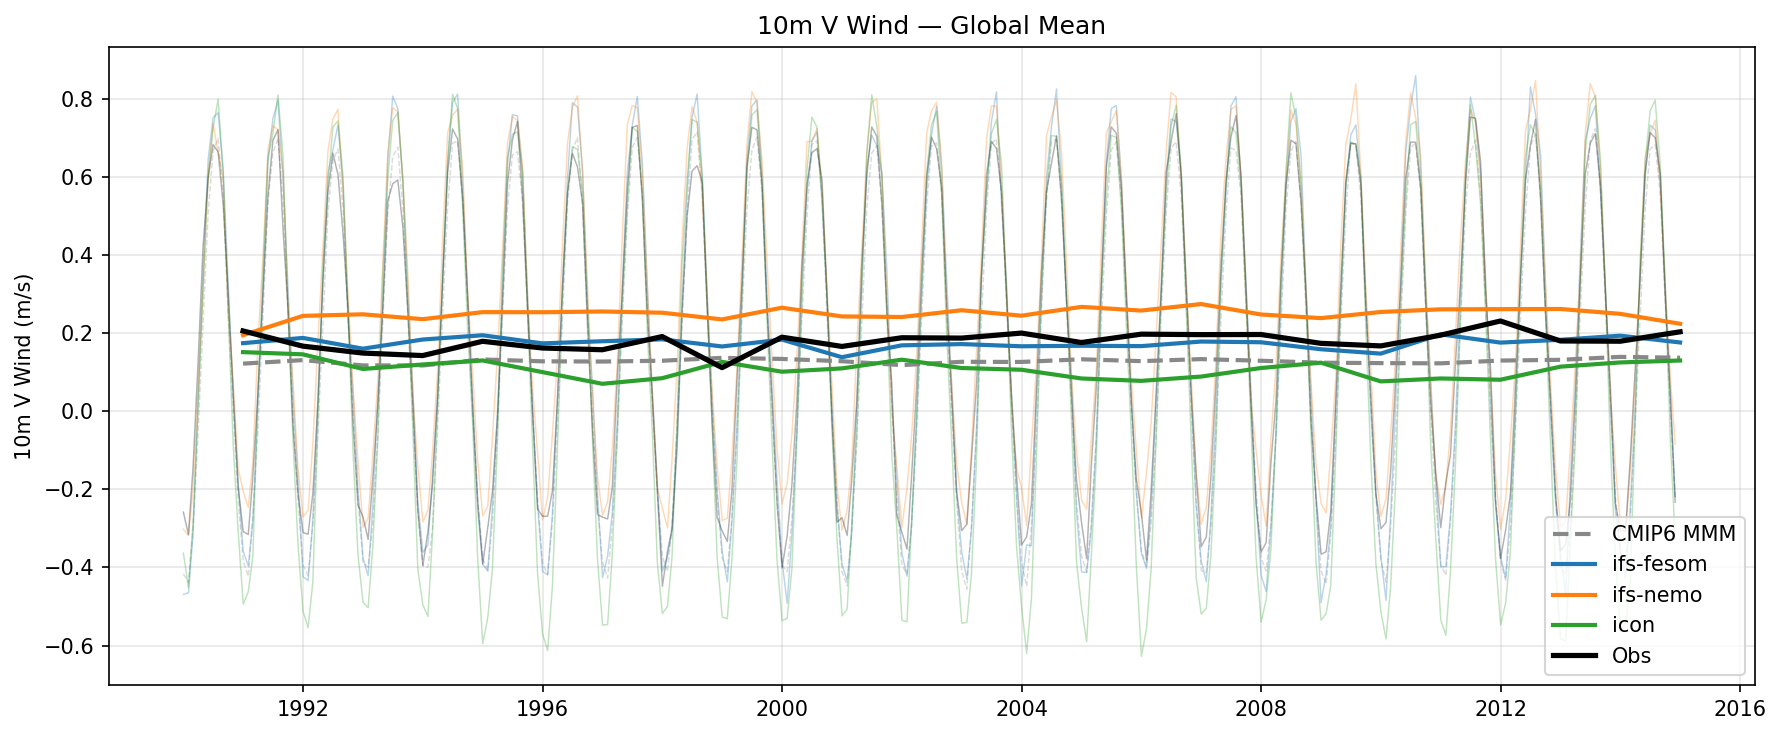
| Variables | vas |
|---|---|
| Models | ifs-fesom, ifs-nemo, icon |
| Reference Dataset | ERA5 |
| Units | m/s |
| Period | 1990–2014 |
Summary high
Time series of global mean 10m meridional (V) wind (1990–2014) showing a consistent net northward surface flow across all datasets, modulated by a strong seasonal cycle.
Key Findings
- ifs-fesom shows excellent agreement with ERA5 observations, closely tracking the annual mean magnitude (~0.18 m/s) and interannual variability.
- ifs-nemo exhibits a systematic positive bias, overestimating the net northward flow (~0.25 m/s) compared to ERA5.
- icon and the CMIP6 MMM both underestimate the net northward flow (biases of roughly -0.05 to -0.08 m/s relative to ERA5), showing a flatter annual mean profile.
- Despite sharing the same atmospheric component (IFS), ifs-fesom and ifs-nemo diverge significantly, indicating that ocean model coupling (FESOM vs NEMO) strongly influences surface wind residuals.
Spatial Patterns
The data exhibits a large amplitude seasonal cycle (~1.2 m/s peak-to-peak), oscillating between strong net northward and weaker/southward phases, likely driven by the seasonal migration of the ITCZ and hemispheric asymmetries in monsoon circulations.
Model Agreement
ifs-fesom provides the best match to observations. ifs-nemo is the outlier on the high side, while icon and CMIP6 cluster on the low side. All models capture the phase of the seasonal cycle accurately.
Physical Interpretation
The non-zero global mean positive V wind indicates a net cross-equatorial or hemispheric asymmetry in surface air flow, likely directed towards the Northern Hemisphere (potentially due to land-ocean contrasts and Hadley cell asymmetry). The divergence between models implies differences in how surface stresses or SST gradients modulate trade winds and cross-equatorial flow.
Caveats
- Global mean V wind is a residual of large opposing hemispheric flows; small regional shifts (e.g., ITCZ location) can heavily influence this metric.
- Magnitudes are small (fractions of m/s), so relative biases appear large despite small absolute errors.