Evaluation Global Linear Trends CMIP6
CMIP6 Multi-Model Mean Context
Comparison with CMIP6 ensemble mean from 10 members.
Contributing models: ACCESS-ESM1-5, AWI-CM-1-1-MR, CNRM-CM6-1, CNRM-ESM2-1, EC-Earth3, GISS-E2-1-G, INM-CM5-0, IPSL-CM6A-LR, MPI-ESM1-2-LR, MRI-ESM2-0
Synthesis
Related diagnostics
10m U Wind Annual Linear Trend
| Variables | avg_10u |
|---|---|
| Models | ifs-fesom, ifs-nemo, icon, CMIP6 MMM, MPI-ESM1-2-LR/r1i1p1f1, GISS-E2-1-G/r1i1p1f2, IPSL-CM6A-LR/r1i1p1f1, ACCESS-ESM1-5/r1i1p1f1, EC-Earth3/r1i1p1f1, CNRM-CM6-1/r1i1p1f2, AWI-CM-1-1-MR/r1i1p1f1, CNRM-ESM2-1/r1i1p1f2, INM-CM5-0/r1i1p1f1, MRI-ESM2-0/r1i1p1f1 |
| Reference Dataset | ERA5 |
| Units | m/s/decade |
| Period | 1990–2014 |
| ifs-fesom | Global Mean Trend: -0.00 · Global Mean Trend Diff: 0.06 · Trend Rmse: 0.22 |
| ifs-nemo | Global Mean Trend: 0.01 · Global Mean Trend Diff: 0.07 · Trend Rmse: 0.25 |
| icon | Global Mean Trend: -0.00 · Global Mean Trend Diff: 0.06 · Trend Rmse: 0.24 |
| CMIP6 MMM | Global Mean Trend Diff: 0.06 · Trend Rmse: 0.21 |
| MPI-ESM1-2-LR/r1i1p1f1 | Global Mean Trend Diff: 0.04 · Trend Rmse: 0.23 |
| GISS-E2-1-G/r1i1p1f2 | Global Mean Trend Diff: 0.06 · Trend Rmse: 0.27 |
| IPSL-CM6A-LR/r1i1p1f1 | Global Mean Trend Diff: 0.05 · Trend Rmse: 0.23 |
| ACCESS-ESM1-5/r1i1p1f1 | Global Mean Trend Diff: 0.07 · Trend Rmse: 0.27 |
| EC-Earth3/r1i1p1f1 | Global Mean Trend Diff: 0.05 · Trend Rmse: 0.23 |
| CNRM-CM6-1/r1i1p1f2 | Global Mean Trend Diff: 0.07 · Trend Rmse: 0.24 |
| AWI-CM-1-1-MR/r1i1p1f1 | Global Mean Trend Diff: 0.05 · Trend Rmse: 0.26 |
| CNRM-ESM2-1/r1i1p1f2 | Global Mean Trend Diff: 0.07 · Trend Rmse: 0.25 |
| INM-CM5-0/r1i1p1f1 | Global Mean Trend Diff: 0.08 · Trend Rmse: 0.25 |
| MRI-ESM2-0/r1i1p1f1 | Global Mean Trend Diff: 0.06 · Trend Rmse: 0.22 |
Summary high
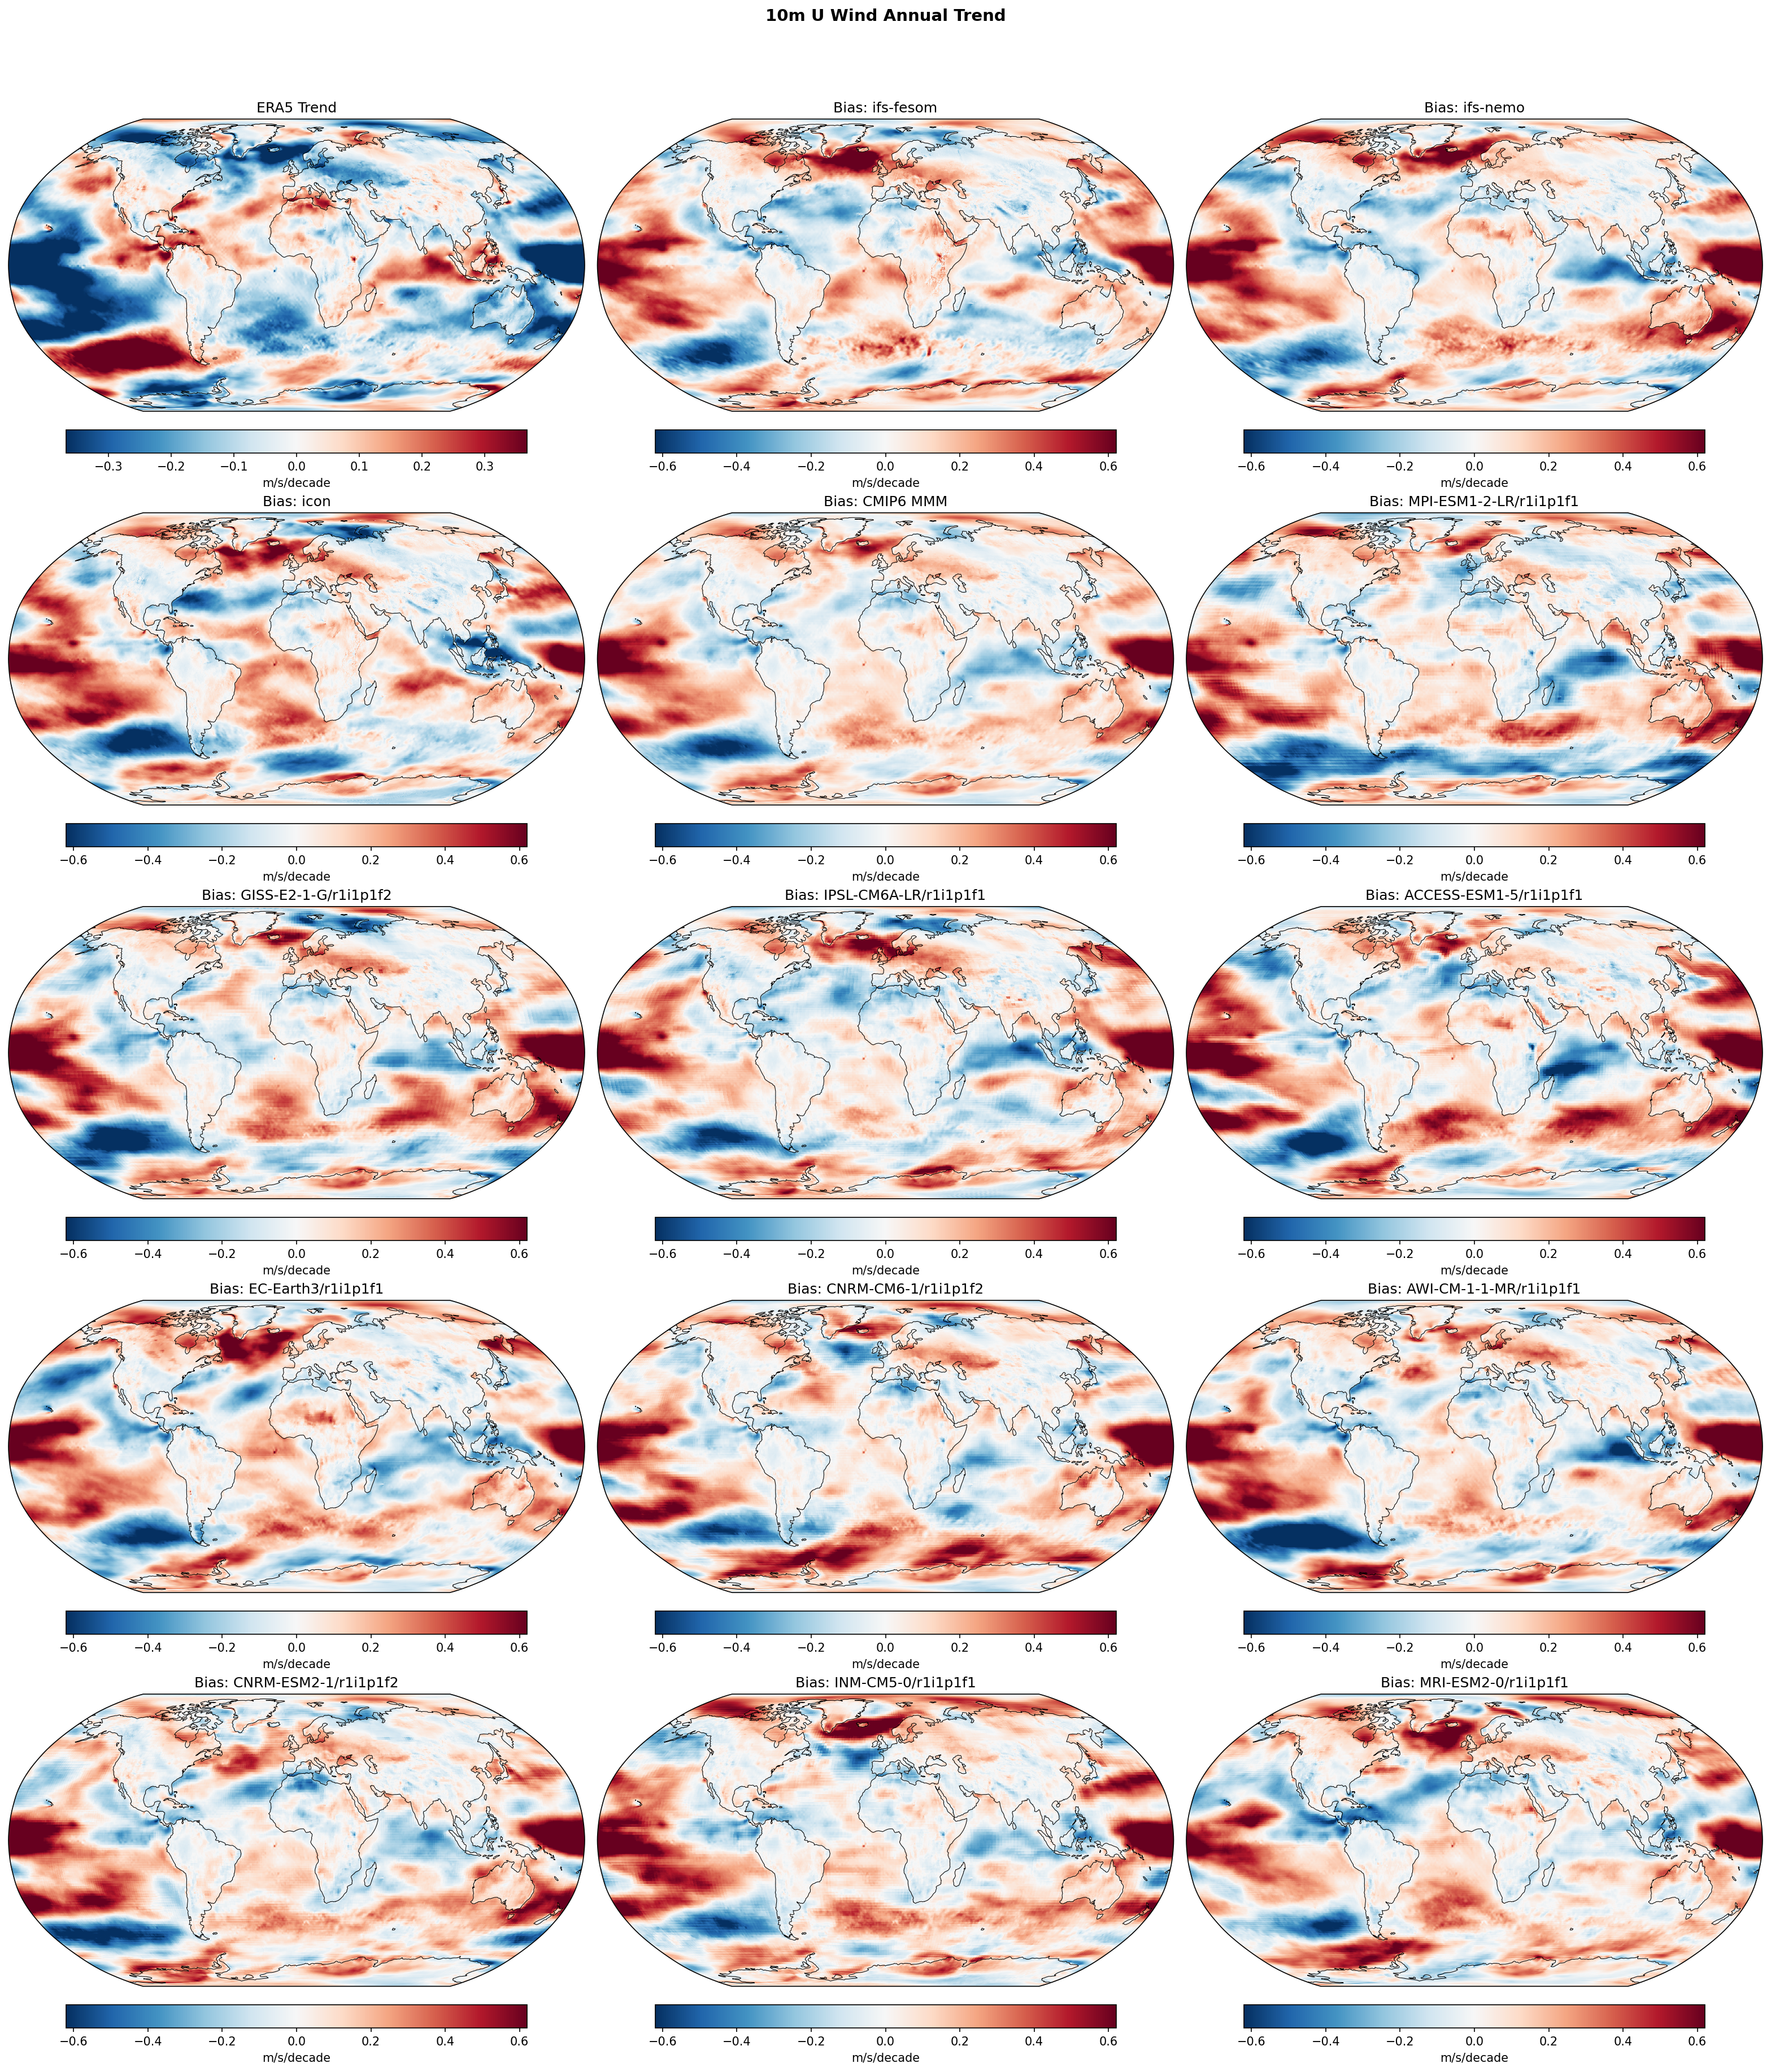
This figure compares annual linear trends in 10m zonal (U) wind over the period 1990–2014 between ERA5 reanalysis, three high-resolution DestinE models (IFS-FESOM, IFS-NEMO, ICON), and the CMIP6 ensemble. The analysis reveals a systematic inability across all models, regardless of resolution, to capture the observed strengthening of the Pacific trade winds during this period.
Key Findings
- All models exhibit a prominent positive trend bias (red) in the tropical Pacific, indicating they fail to reproduce the observed strengthening of easterly trade winds (negative trend in ERA5).
- IFS-FESOM achieves the lowest trend RMSE (0.22 m/s/decade) among the DestinE models, outperforming ICON (0.24) and IFS-NEMO (0.25), and performing comparably to the best individual CMIP6 models.
- The magnitude of the trend biases (up to ±0.6 m/s/decade) often exceeds the magnitude of the observed trends (±0.3 m/s/decade), suggesting limited skill in reproducing specific decadal variability phases.
- IFS-NEMO displays stronger, more widespread positive biases in the Southern Hemisphere and North Pacific compared to IFS-FESOM and ICON.
Spatial Patterns
ERA5 (top left) shows a distinct strengthening of the Walker circulation, characterized by a negative trend (strengthening easterlies, blue) in the central/western equatorial Pacific and strengthening westerlies (positive trend, red) in the Southern Ocean. The model bias maps are dominated by a 'red' positive bias in the tropical Pacific, meaning the models predict either weakening trades or insufficient strengthening. High-latitude biases are mixed, though IFS-NEMO shows notable positive biases (excessive westerly trend) in the South Pacific/Southern Ocean sector.
Model Agreement
There is high structural agreement between the DestinE models and the CMIP6 ensemble regarding the sign of the error in the tropical Pacific. The CMIP6 Multi-Model Mean (MMM) has the lowest RMSE (0.21), likely because averaging reduces noise from internal variability, but it shares the same systematic zonal bias pattern as the high-resolution models. IFS-FESOM aligns closest to the CMIP6 MMM performance, while IFS-NEMO is an outlier with higher RMSE.
Physical Interpretation
The pervasive positive bias in the tropical Pacific reflects the known difficulty coupled models have in capturing the 1990–2014 'global warming hiatus' pattern, which featured La Niña-like cooling and intensified trade winds (negative IPO phase). Since these simulations are likely free-running coupled runs (not initialized to the 1990 ocean state), they are not phased with the observed internal variability (IPO/PDO). Consequently, the high resolution (~5 km) does not resolve this discrepancy, as it stems from internal variability phasing or fundamental missing feedback mechanisms rather than grid spacing.
Caveats
- The analysis period (25 years) is short and dominated by internal multidecadal variability (e.g., IPO), making it a test of variability phasing rather than forced climate change trends.
- Trend bias magnitudes are large relative to the signal, indicating low predictive skill for regional decadal wind trends in free-running simulations.
10m U Wind DJF Linear Trend
| Variables | avg_10u |
|---|---|
| Models | ifs-fesom, ifs-nemo, icon, CMIP6 MMM, MPI-ESM1-2-LR/r1i1p1f1, GISS-E2-1-G/r1i1p1f2, IPSL-CM6A-LR/r1i1p1f1, ACCESS-ESM1-5/r1i1p1f1, EC-Earth3/r1i1p1f1, CNRM-CM6-1/r1i1p1f2, AWI-CM-1-1-MR/r1i1p1f1, CNRM-ESM2-1/r1i1p1f2, INM-CM5-0/r1i1p1f1, MRI-ESM2-0/r1i1p1f1 |
| Reference Dataset | ERA5 |
| Units | m/s/decade |
| Period | 1990–2014 |
| CMIP6 MMM | Global Mean Trend Diff: 0.05 · Trend Rmse: None |
| MPI-ESM1-2-LR/r1i1p1f1 | Global Mean Trend Diff: 0.01 · Trend Rmse: None |
| GISS-E2-1-G/r1i1p1f2 | Global Mean Trend Diff: 0.05 · Trend Rmse: None |
| IPSL-CM6A-LR/r1i1p1f1 | Global Mean Trend Diff: 0.05 · Trend Rmse: None |
| ACCESS-ESM1-5/r1i1p1f1 | Global Mean Trend Diff: 0.07 · Trend Rmse: None |
| EC-Earth3/r1i1p1f1 | Global Mean Trend Diff: 0.02 · Trend Rmse: None |
| CNRM-CM6-1/r1i1p1f2 | Global Mean Trend Diff: 0.05 · Trend Rmse: None |
| AWI-CM-1-1-MR/r1i1p1f1 | Global Mean Trend Diff: 0.04 · Trend Rmse: None |
| CNRM-ESM2-1/r1i1p1f2 | Global Mean Trend Diff: 0.04 · Trend Rmse: None |
| INM-CM5-0/r1i1p1f1 | Global Mean Trend Diff: 0.07 · Trend Rmse: None |
| MRI-ESM2-0/r1i1p1f1 | Global Mean Trend Diff: 0.06 · Trend Rmse: None |
Summary high
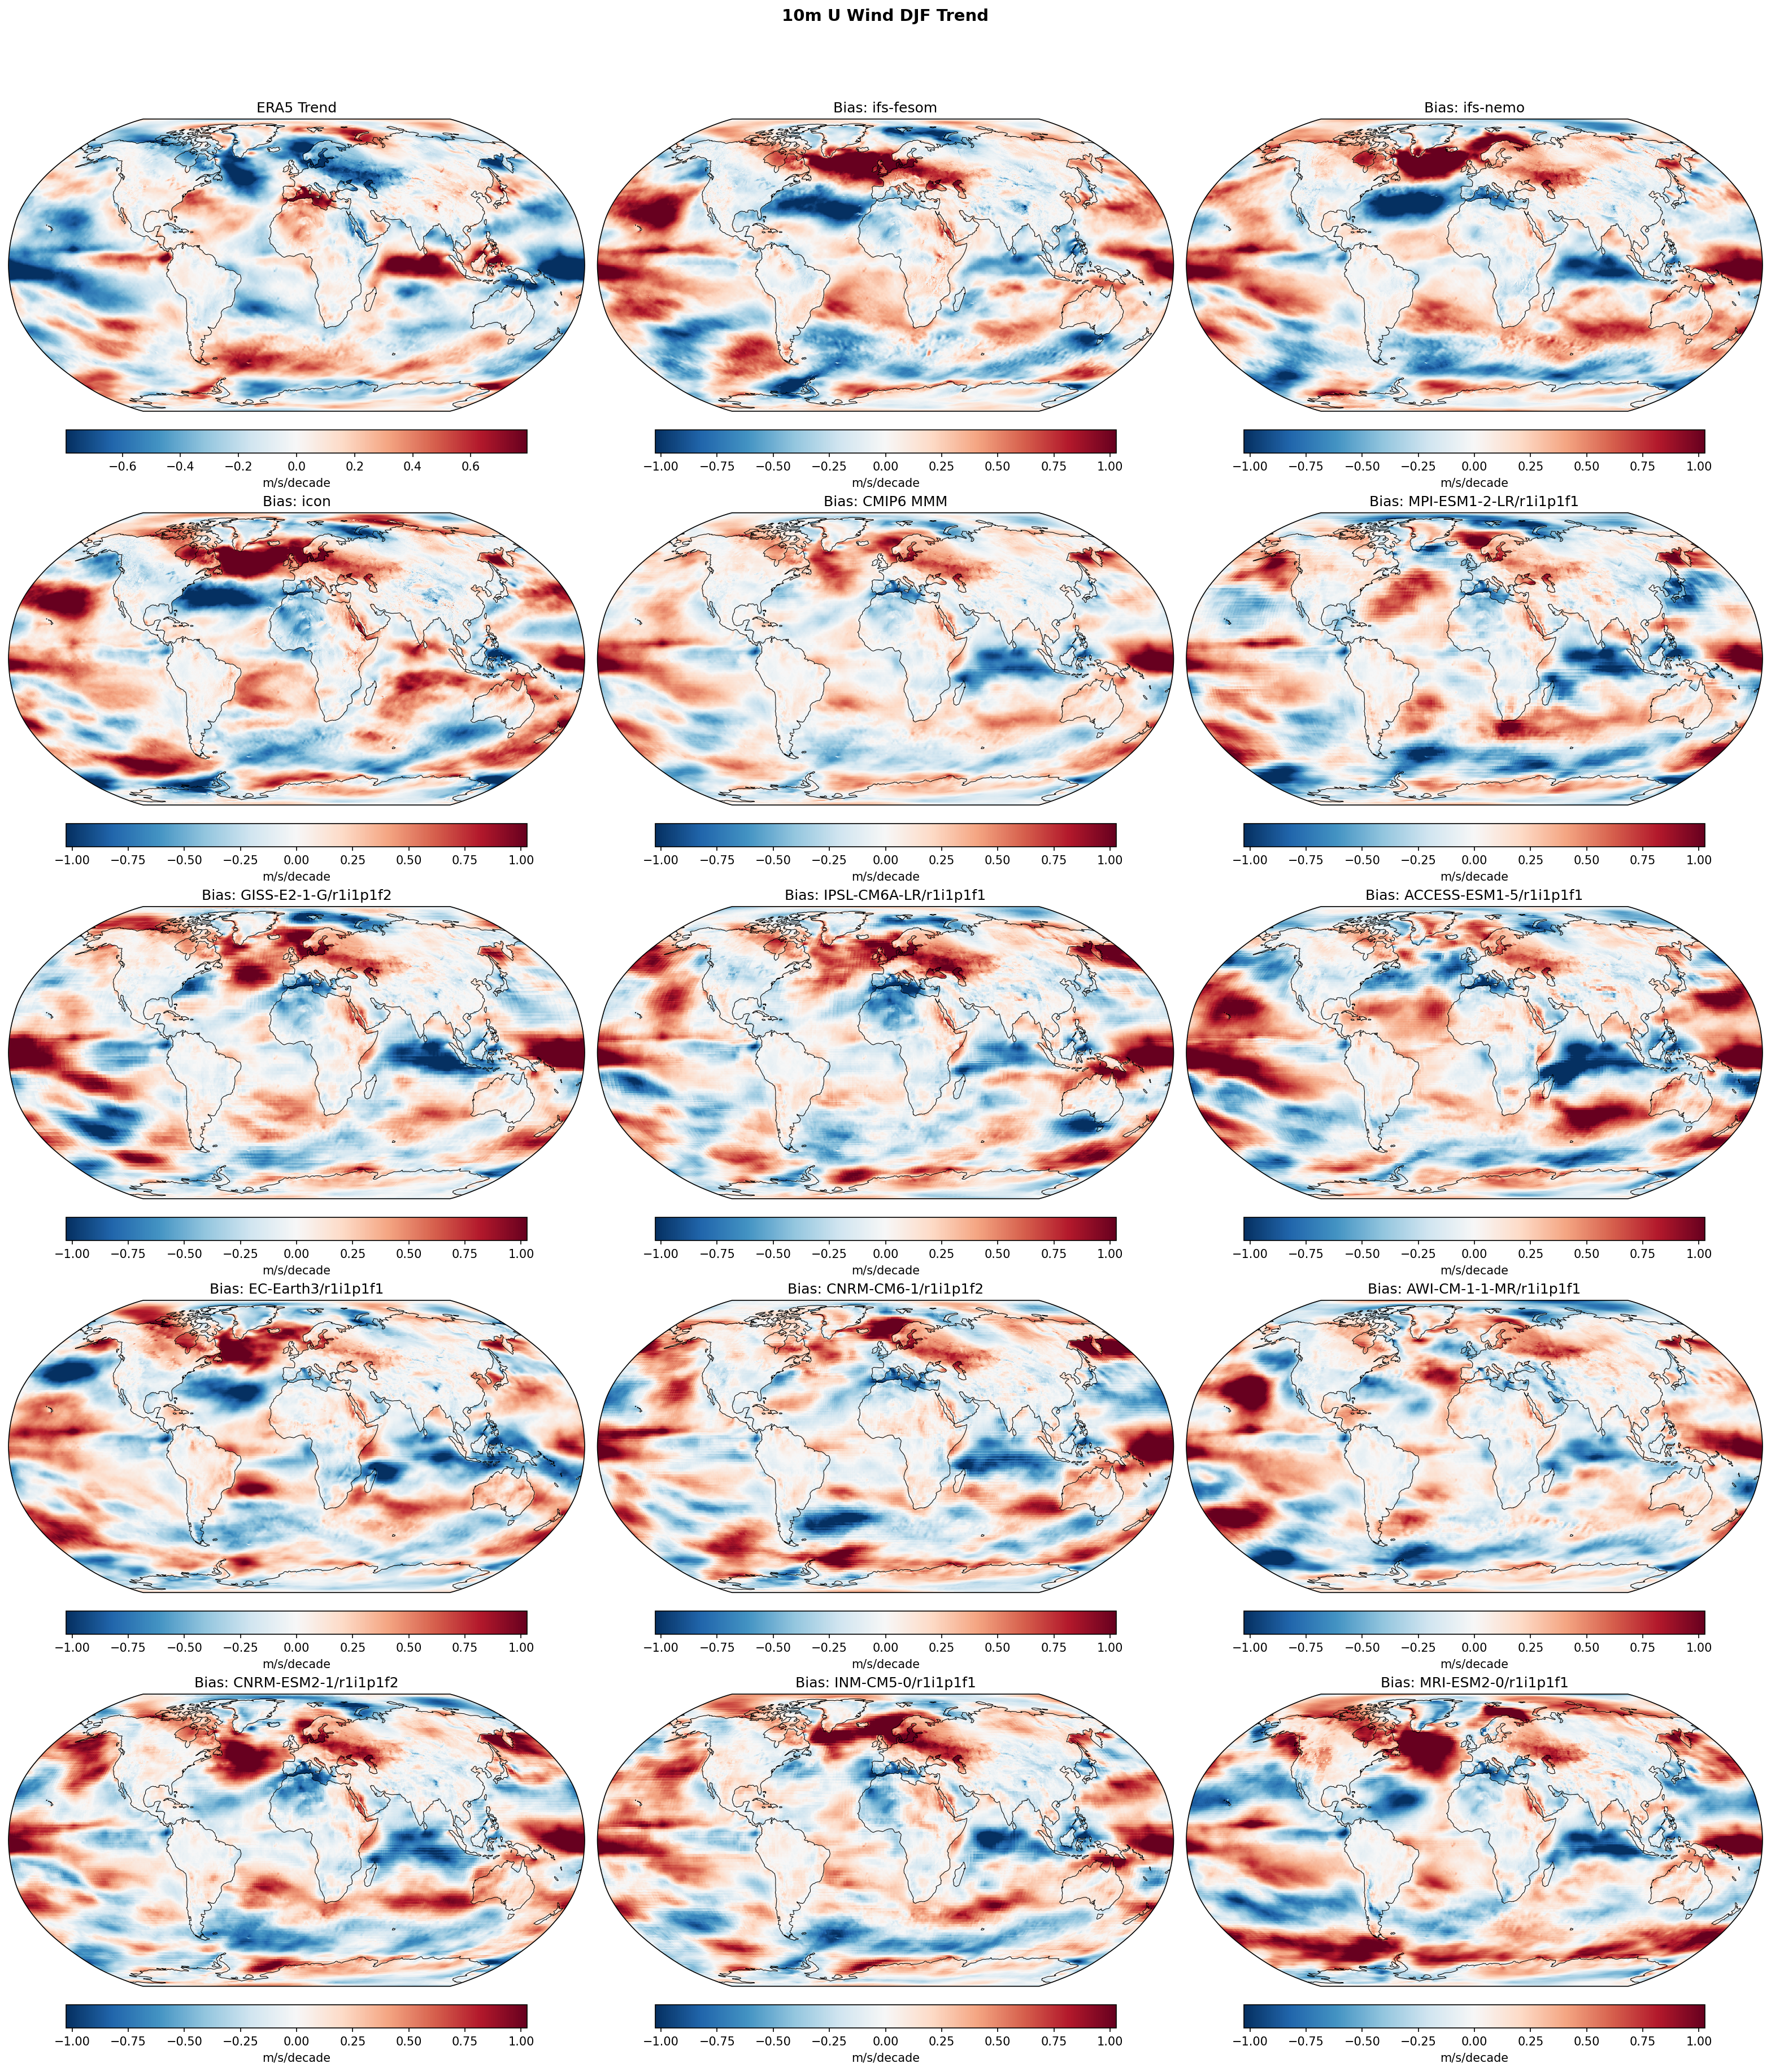
This diagnostic compares DJF 10m zonal wind trends (1990–2014) from three high-resolution DestinE models and various CMIP6 models against ERA5, revealing systematic discrepancies driven largely by internal variability phases.
Key Findings
- A widespread positive trend bias (red) exists across the North Pacific and Tropical Pacific in almost all models (DestinE and CMIP6), indicating simulated trends are more westerly (or less easterly) than the observed strong trade wind intensification.
- IFS-NEMO and ICON exhibit a distinct, strong negative bias (dark blue) in the North Atlantic subpolar gyre region, implying they simulate a significantly stronger easterly trend (or weakening of westerlies) than observed, contrasting with the positive bias seen in IFS-FESOM.
- DestinE models and sensitive CMIP6 members (e.g., ACCESS-ESM1-5) show broad positive biases in the Southern Ocean, suggesting an overestimation of the westerly jet strengthening or poleward shift relative to ERA5 over this specific period.
Spatial Patterns
The dominant pattern is a basin-wide discrepancy in the Pacific (red bias), where models fail to capture the observed negative trend (blue in ERA5 panel). In the North Atlantic, a complex dipole appears in observations, which models capture with varying signs—IFS-NEMO/ICON strongly negative, IFS-FESOM positive.
Model Agreement
There is high agreement between DestinE and CMIP6 models regarding the Pacific mismatch, pointing to a common limitation in capturing historical internal variability phases. In the North Atlantic, the DestinE models diverge, with IFS-FESOM behaving differently from the coherent IFS-NEMO/ICON pair.
Physical Interpretation
The pervasive Pacific bias is a signature of the 'pattern effect' and internal variability mismatch: the 1990–2014 period featured a negative Interdecadal Pacific Oscillation (IPO) phase with strengthening trade winds (La Niña-like trends), whereas free-running coupled models generally produce neutral or El Niño-like warming trends. High resolution (5 km) does not correct this intrinsic phase mismatch.
Caveats
- The 1990–2014 period is short (25 years) and dominated by multidecadal internal variability (e.g., IPO, AMO), making it a difficult test for free-running coupled models which are not expected to sync with observed variability phases.
- Biases reflect trend mismatches (slope differences), not necessarily mean state biases.
10m U Wind JJA Linear Trend
| Variables | avg_10u |
|---|---|
| Models | ifs-fesom, ifs-nemo, icon, CMIP6 MMM, MPI-ESM1-2-LR/r1i1p1f1, GISS-E2-1-G/r1i1p1f2, IPSL-CM6A-LR/r1i1p1f1, ACCESS-ESM1-5/r1i1p1f1, EC-Earth3/r1i1p1f1, CNRM-CM6-1/r1i1p1f2, AWI-CM-1-1-MR/r1i1p1f1, CNRM-ESM2-1/r1i1p1f2, INM-CM5-0/r1i1p1f1, MRI-ESM2-0/r1i1p1f1 |
| Reference Dataset | ERA5 |
| Units | m/s/decade |
| Period | 1990–2014 |
| CMIP6 MMM | Global Mean Trend Diff: 0.08 · Trend Rmse: None |
| MPI-ESM1-2-LR/r1i1p1f1 | Global Mean Trend Diff: 0.08 · Trend Rmse: None |
| GISS-E2-1-G/r1i1p1f2 | Global Mean Trend Diff: 0.07 · Trend Rmse: None |
| IPSL-CM6A-LR/r1i1p1f1 | Global Mean Trend Diff: 0.06 · Trend Rmse: None |
| ACCESS-ESM1-5/r1i1p1f1 | Global Mean Trend Diff: 0.05 · Trend Rmse: None |
| EC-Earth3/r1i1p1f1 | Global Mean Trend Diff: 0.08 · Trend Rmse: None |
| CNRM-CM6-1/r1i1p1f2 | Global Mean Trend Diff: 0.09 · Trend Rmse: None |
| AWI-CM-1-1-MR/r1i1p1f1 | Global Mean Trend Diff: 0.08 · Trend Rmse: None |
| CNRM-ESM2-1/r1i1p1f2 | Global Mean Trend Diff: 0.10 · Trend Rmse: None |
| INM-CM5-0/r1i1p1f1 | Global Mean Trend Diff: 0.11 · Trend Rmse: None |
| MRI-ESM2-0/r1i1p1f1 | Global Mean Trend Diff: 0.07 · Trend Rmse: None |
Summary high
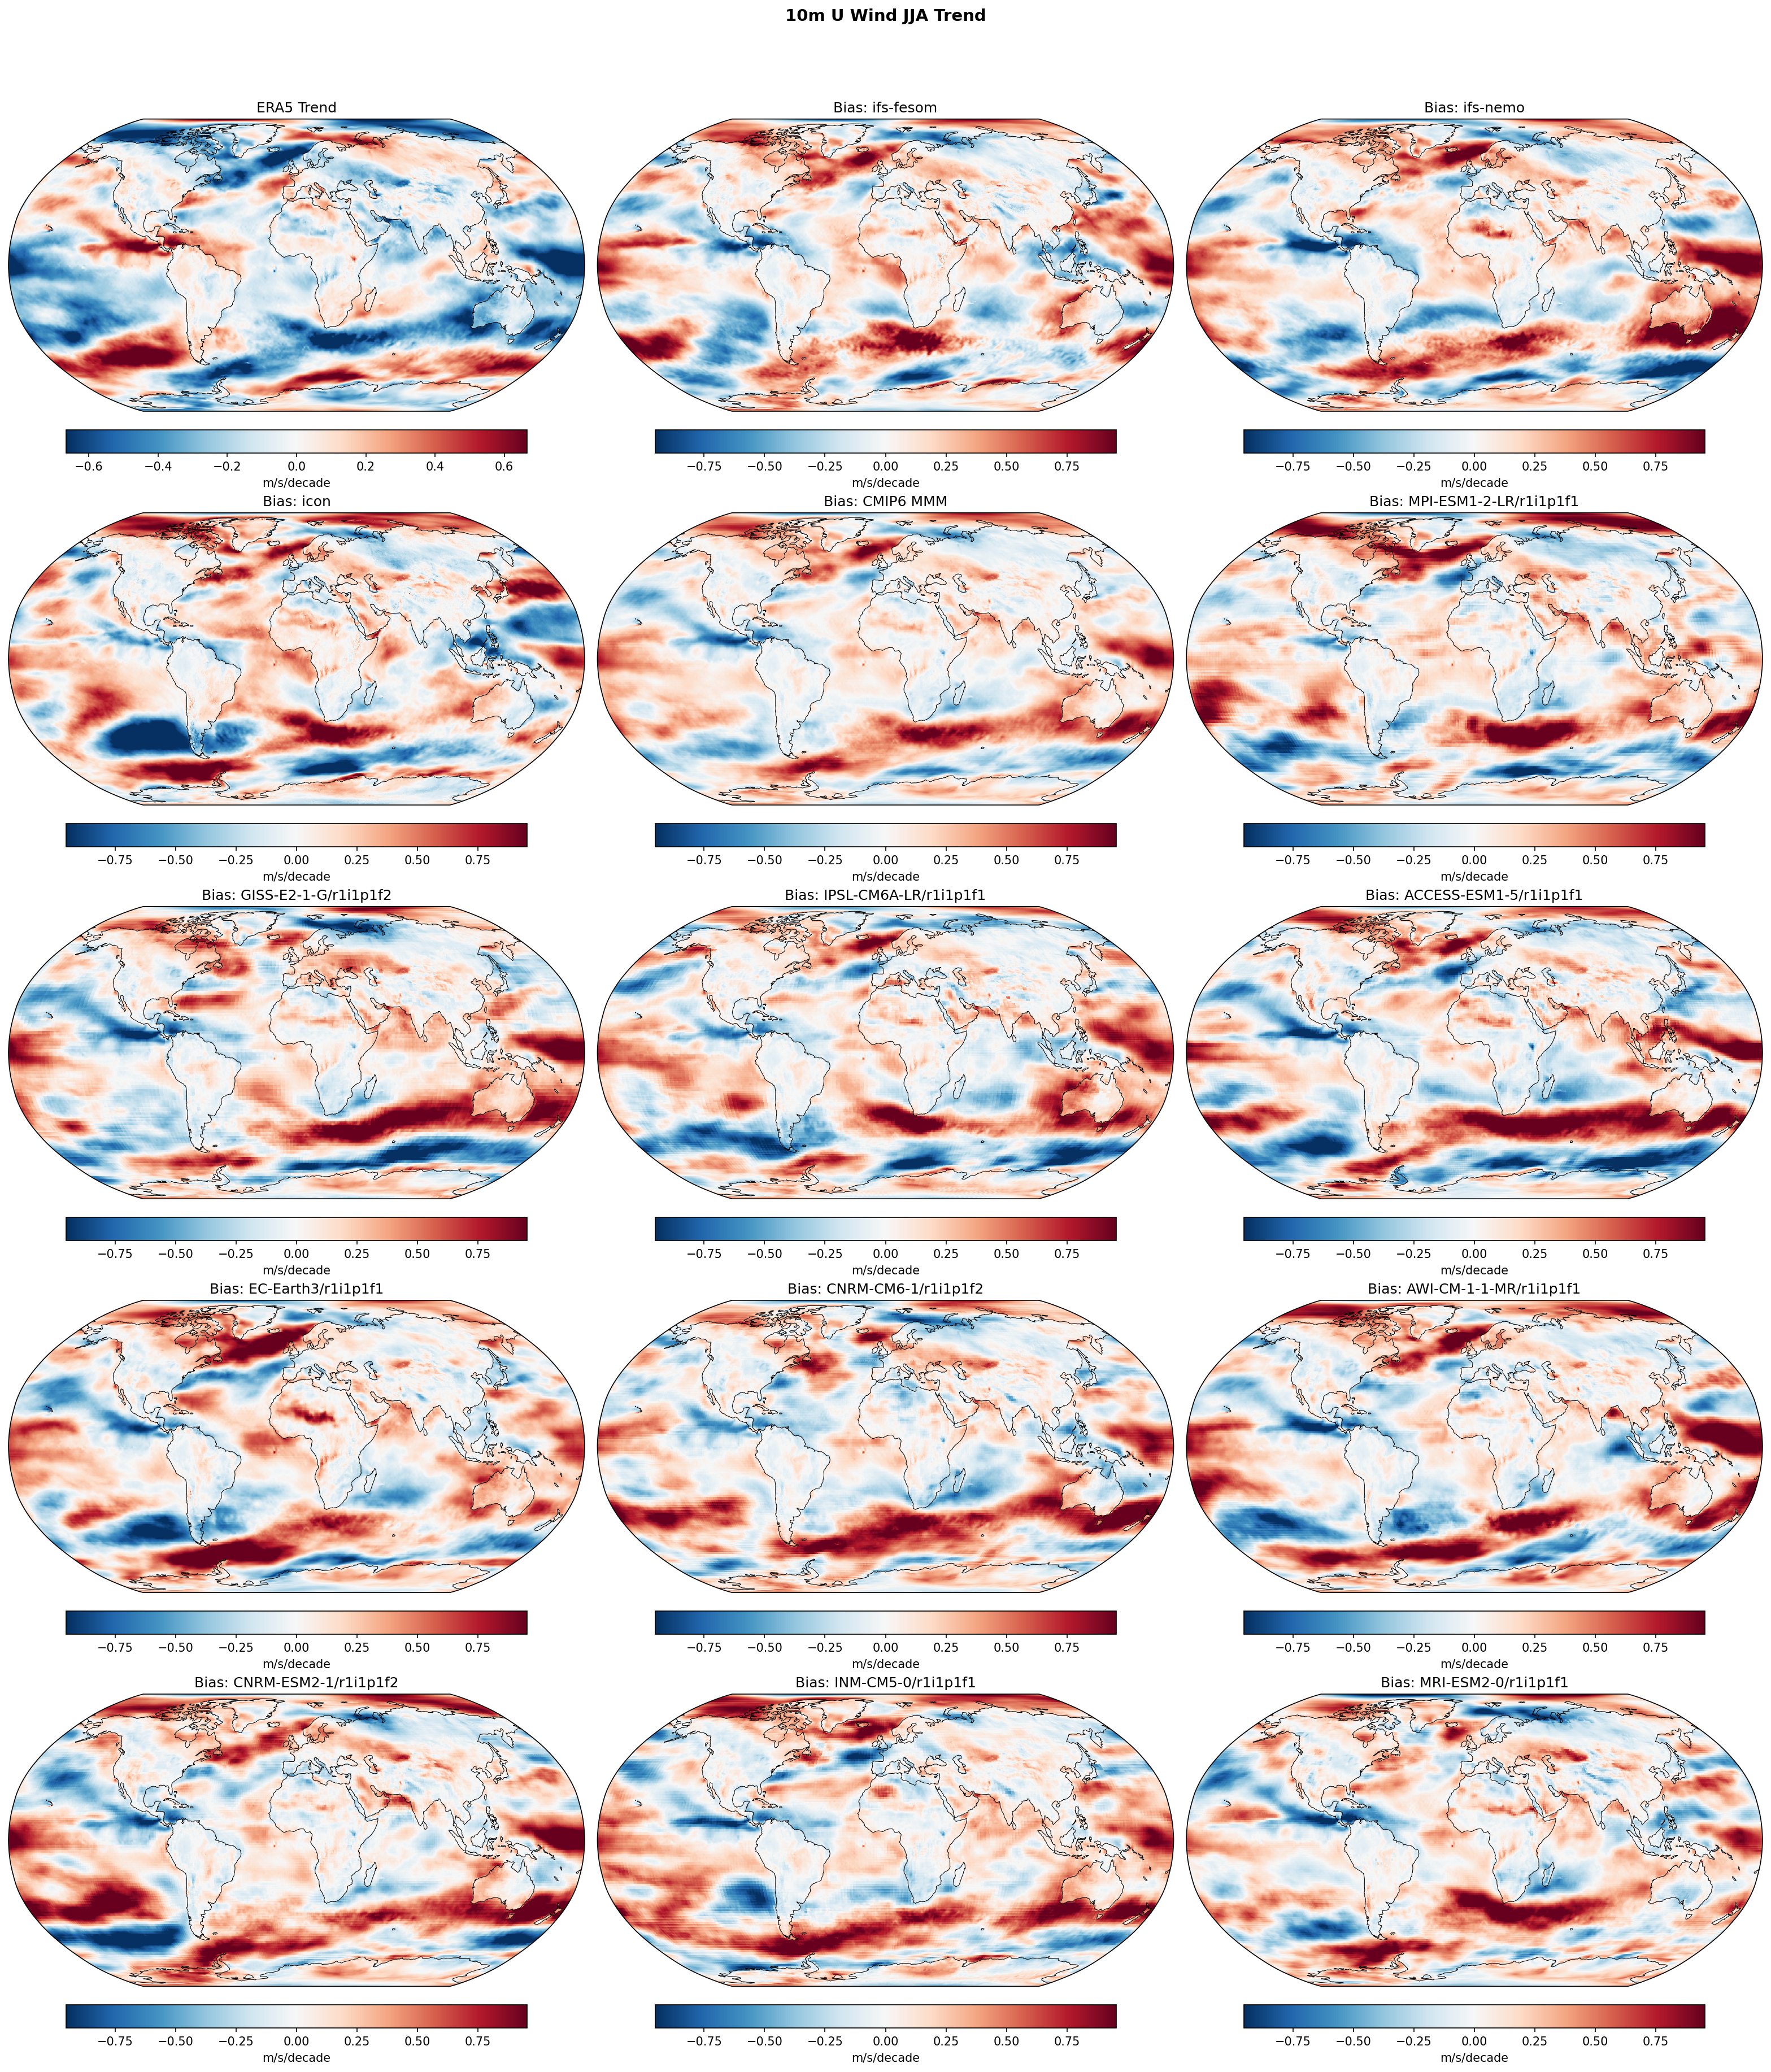
This figure evaluates linear trends in June-July-August (JJA) 10m zonal wind (U) over the period 1990–2014, comparing ERA5 reanalysis against DestinE high-resolution models (IFS-FESOM, IFS-NEMO, ICON) and a suite of CMIP6 models.
Key Findings
- Systematic failure to capture Tropical Pacific trends: ERA5 shows a strong strengthening of easterly trade winds (negative trend, blue) in the equatorial Pacific, which all models fail to reproduce, resulting in a prominent positive (red) trend bias.
- Southern Hemisphere circulation mismatch: ERA5 displays a distinct wave-train pattern in Southern Ocean westerly trends (alternating strengthening/weakening). Models show large dipole errors here, indicating a misalignment of the jet stream shifts.
- Resolution independence of trend bias: The high-resolution DestinE models (IFS, ICON) exhibit the same systematic biases as the coarser CMIP6 ensemble, particularly in the tropics, suggesting the discrepancy is not resolved by spatial resolution alone.
Spatial Patterns
The observational panel (ERA5) is characterized by a strong negative trend (strengthening easterlies) in the central/western equatorial Pacific and a wave-3 pattern in the Southern Hemisphere westerlies. The bias panels are dominated by a zonal band of positive bias (red) along the equator, indicating models have weaker easterly trends or spurious westerly trends. In the Southern Ocean, biases appear as large-scale dipoles, with ICON showing a notably strong negative bias patch in the South Pacific (~60°S).
Model Agreement
There is high inter-model agreement on the sign of the error in the tropical Pacific—virtually every model (DestinE and CMIP6) exhibits the positive trend bias. The CMIP6 Multi-Model Mean (MMM) smooths out extratropical noise but retains the strong tropical error, confirming it is a systematic feature of the ensemble. IFS-FESOM and IFS-NEMO show very similar bias patterns to each other.
Physical Interpretation
The 1990–2014 period coincides with a specific phase of the Interdecadal Pacific Oscillation (IPO) characterized by strengthened trade winds (the so-called 'hiatus' pattern). Free-running coupled climate models generate their own internal decadal variability phases which are not synchronized with the real world. Consequently, the widespread 'bias' primarily reflects a phase mismatch between the observed IPO evolution and the models' random internal trajectories, rather than a fundamental deficiency in model physics that resolution would fix.
Caveats
- The analysis period (25 years) is short relative to decadal variability timescales; 'biases' in trends are expected due to internal variability phasing.
- Trends are linear fits and may be sensitive to start/end dates.
10m V Wind Annual Linear Trend
| Variables | avg_10v |
|---|---|
| Models | ifs-fesom, ifs-nemo, icon, CMIP6 MMM, MPI-ESM1-2-LR/r1i1p1f1, GISS-E2-1-G/r1i1p1f2, IPSL-CM6A-LR/r1i1p1f1, ACCESS-ESM1-5/r1i1p1f1, EC-Earth3/r1i1p1f1, CNRM-CM6-1/r1i1p1f2, AWI-CM-1-1-MR/r1i1p1f1, CNRM-ESM2-1/r1i1p1f2, INM-CM5-0/r1i1p1f1, MRI-ESM2-0/r1i1p1f1 |
| Reference Dataset | ERA5 |
| Units | m/s/decade |
| Period | 1990–2014 |
| ifs-fesom | Global Mean Trend: -0.00 · Global Mean Trend Diff: -0.01 · Trend Rmse: 0.15 |
| ifs-nemo | Global Mean Trend: 0.01 · Global Mean Trend Diff: -0.01 · Trend Rmse: 0.15 |
| icon | Global Mean Trend: -0.01 · Global Mean Trend Diff: -0.02 · Trend Rmse: 0.18 |
| CMIP6 MMM | Global Mean Trend Diff: -0.01 · Trend Rmse: 0.14 |
| MPI-ESM1-2-LR/r1i1p1f1 | Global Mean Trend Diff: -0.00 · Trend Rmse: 0.16 |
| GISS-E2-1-G/r1i1p1f2 | Global Mean Trend Diff: -0.01 · Trend Rmse: 0.17 |
| IPSL-CM6A-LR/r1i1p1f1 | Global Mean Trend Diff: -0.01 · Trend Rmse: 0.15 |
| ACCESS-ESM1-5/r1i1p1f1 | Global Mean Trend Diff: -0.01 · Trend Rmse: 0.18 |
| EC-Earth3/r1i1p1f1 | Global Mean Trend Diff: -0.00 · Trend Rmse: 0.17 |
| CNRM-CM6-1/r1i1p1f2 | Global Mean Trend Diff: -0.01 · Trend Rmse: 0.15 |
| AWI-CM-1-1-MR/r1i1p1f1 | Global Mean Trend Diff: -0.01 · Trend Rmse: 0.16 |
| CNRM-ESM2-1/r1i1p1f2 | Global Mean Trend Diff: -0.01 · Trend Rmse: 0.16 |
| INM-CM5-0/r1i1p1f1 | Global Mean Trend Diff: -0.02 · Trend Rmse: 0.16 |
| MRI-ESM2-0/r1i1p1f1 | Global Mean Trend Diff: -0.02 · Trend Rmse: 0.19 |
Summary medium
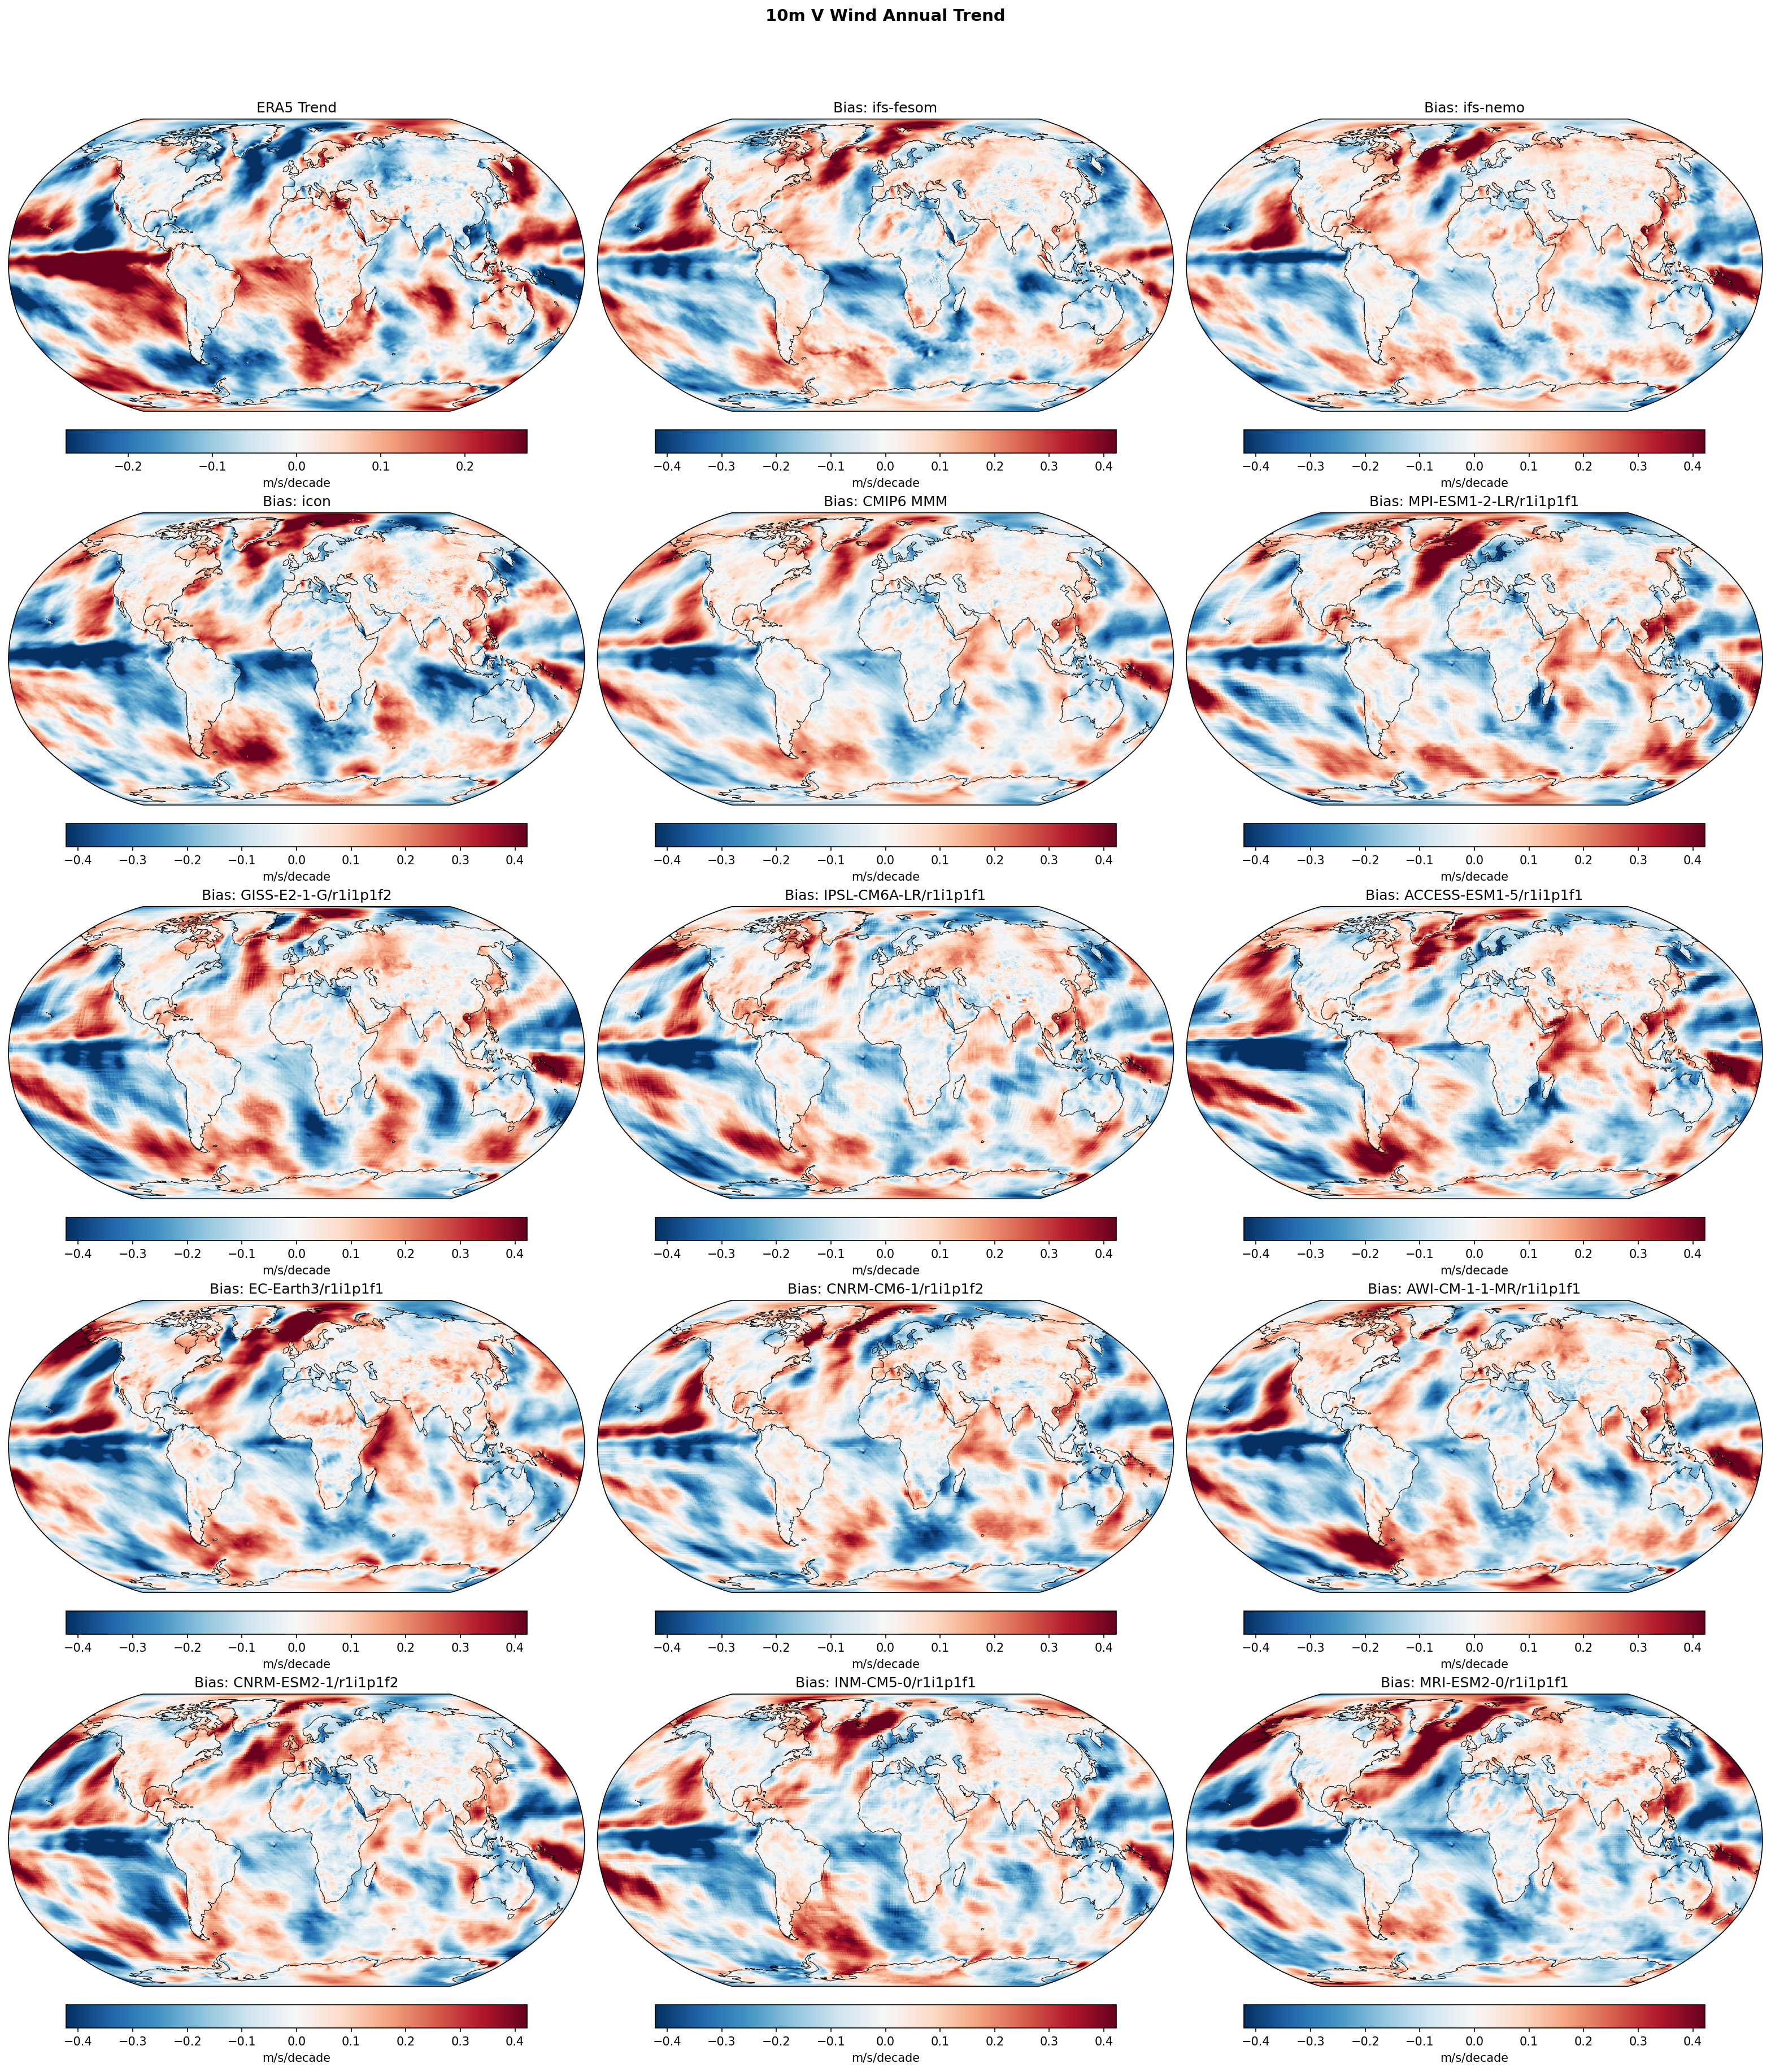
This figure evaluates annual linear trends in 10m meridional (V) wind over the period 1990–2014, comparing three high-resolution DestinE models (IFS-FESOM, IFS-NEMO, ICON) and a suite of CMIP6 models against ERA5 reanalysis. The diagnostic highlights spatial discrepancies in decadal circulation changes, particularly in the tropical Pacific.
Key Findings
- Systematic Tropical Pacific Bias: All models, including the CMIP6 Multi-Model Mean (MMM), exhibit a prominent dipole bias in the tropical Pacific—overestimating northward trend components in the East (red bias) and southward components in the Central Pacific (blue bias) relative to ERA5.
- DestinE Model Comparison: IFS-NEMO performs best among the high-resolution models with a global trend RMSE of 0.147 m/s/decade, followed by IFS-FESOM (0.154) and ICON (0.176). ICON shows stronger discrepancies in the Southern Ocean compared to the IFS variants.
- Signal-to-Noise Ratio: The magnitude of the trend biases (colorbar range ±0.4 m/s/decade) often exceeds the magnitude of the observed trends (ERA5 range ±0.2 m/s/decade), indicating that reproducing specific decadal circulation evolution remains challenging for free-running models.
Spatial Patterns
The most coherent pattern is the zonal dipole in the tropical Pacific trend bias. While ERA5 shows specific bands of strengthening/weakening meridional flow (e.g., eastern Pacific southerly intensification), the models show 'bias' patterns of the same sign, implying they significantly overestimate the amplitude of these observed circulation shifts. High-latitude regions (North Atlantic, Southern Ocean) show noisy, less coherent bias patterns indicative of shifts in storm track positioning.
Model Agreement
There is strong inter-model qualitative agreement regarding the tropical Pacific bias pattern; the DestinE models closely resemble the CMIP6 MMM structure in this region. Quantitatively, the CMIP6 MMM achieves the lowest RMSE (0.137), likely because ensemble averaging suppresses unforced internal variability, whereas single realizations (DestinE and individual CMIP6) are penalized for phase mismatch.
Physical Interpretation
The bias patterns suggest that models are simulating a stronger intensification of the Walker Circulation (and associated meridional trade wind components) than observed during the 1990–2014 period. This era coincided with a negative phase of the Interdecadal Pacific Oscillation (IPO) characterized by strengthened trade winds; the 'same-sign' bias implies models may be over-responding to forcings or generating internal variability phases with excessive amplitude in the tropical overturning circulation.
Caveats
- Trend analysis over short periods (25 years) is dominated by internal climate variability (e.g., ENSO/PDO phases); discrepancies often reflect phase mismatches rather than fundamental physics errors.
- The color scales differ between the observation panel (±0.2) and bias panels (±0.4), visually emphasizing the errors.
10m V Wind DJF Linear Trend
| Variables | avg_10v |
|---|---|
| Models | ifs-fesom, ifs-nemo, icon, CMIP6 MMM, MPI-ESM1-2-LR/r1i1p1f1, GISS-E2-1-G/r1i1p1f2, IPSL-CM6A-LR/r1i1p1f1, ACCESS-ESM1-5/r1i1p1f1, EC-Earth3/r1i1p1f1, CNRM-CM6-1/r1i1p1f2, AWI-CM-1-1-MR/r1i1p1f1, CNRM-ESM2-1/r1i1p1f2, INM-CM5-0/r1i1p1f1, MRI-ESM2-0/r1i1p1f1 |
| Reference Dataset | ERA5 |
| Units | m/s/decade |
| Period | 1990–2014 |
| CMIP6 MMM | Global Mean Trend Diff: 0.01 · Trend Rmse: None |
| MPI-ESM1-2-LR/r1i1p1f1 | Global Mean Trend Diff: 0.01 · Trend Rmse: None |
| GISS-E2-1-G/r1i1p1f2 | Global Mean Trend Diff: 0.01 · Trend Rmse: None |
| IPSL-CM6A-LR/r1i1p1f1 | Global Mean Trend Diff: 0.00 · Trend Rmse: None |
| ACCESS-ESM1-5/r1i1p1f1 | Global Mean Trend Diff: 0.02 · Trend Rmse: None |
| EC-Earth3/r1i1p1f1 | Global Mean Trend Diff: 0.02 · Trend Rmse: None |
| CNRM-CM6-1/r1i1p1f2 | Global Mean Trend Diff: 0.01 · Trend Rmse: None |
| AWI-CM-1-1-MR/r1i1p1f1 | Global Mean Trend Diff: 0.01 · Trend Rmse: None |
| CNRM-ESM2-1/r1i1p1f2 | Global Mean Trend Diff: 0.02 · Trend Rmse: None |
| INM-CM5-0/r1i1p1f1 | Global Mean Trend Diff: 0.00 · Trend Rmse: None |
| MRI-ESM2-0/r1i1p1f1 | Global Mean Trend Diff: -0.00 · Trend Rmse: None |
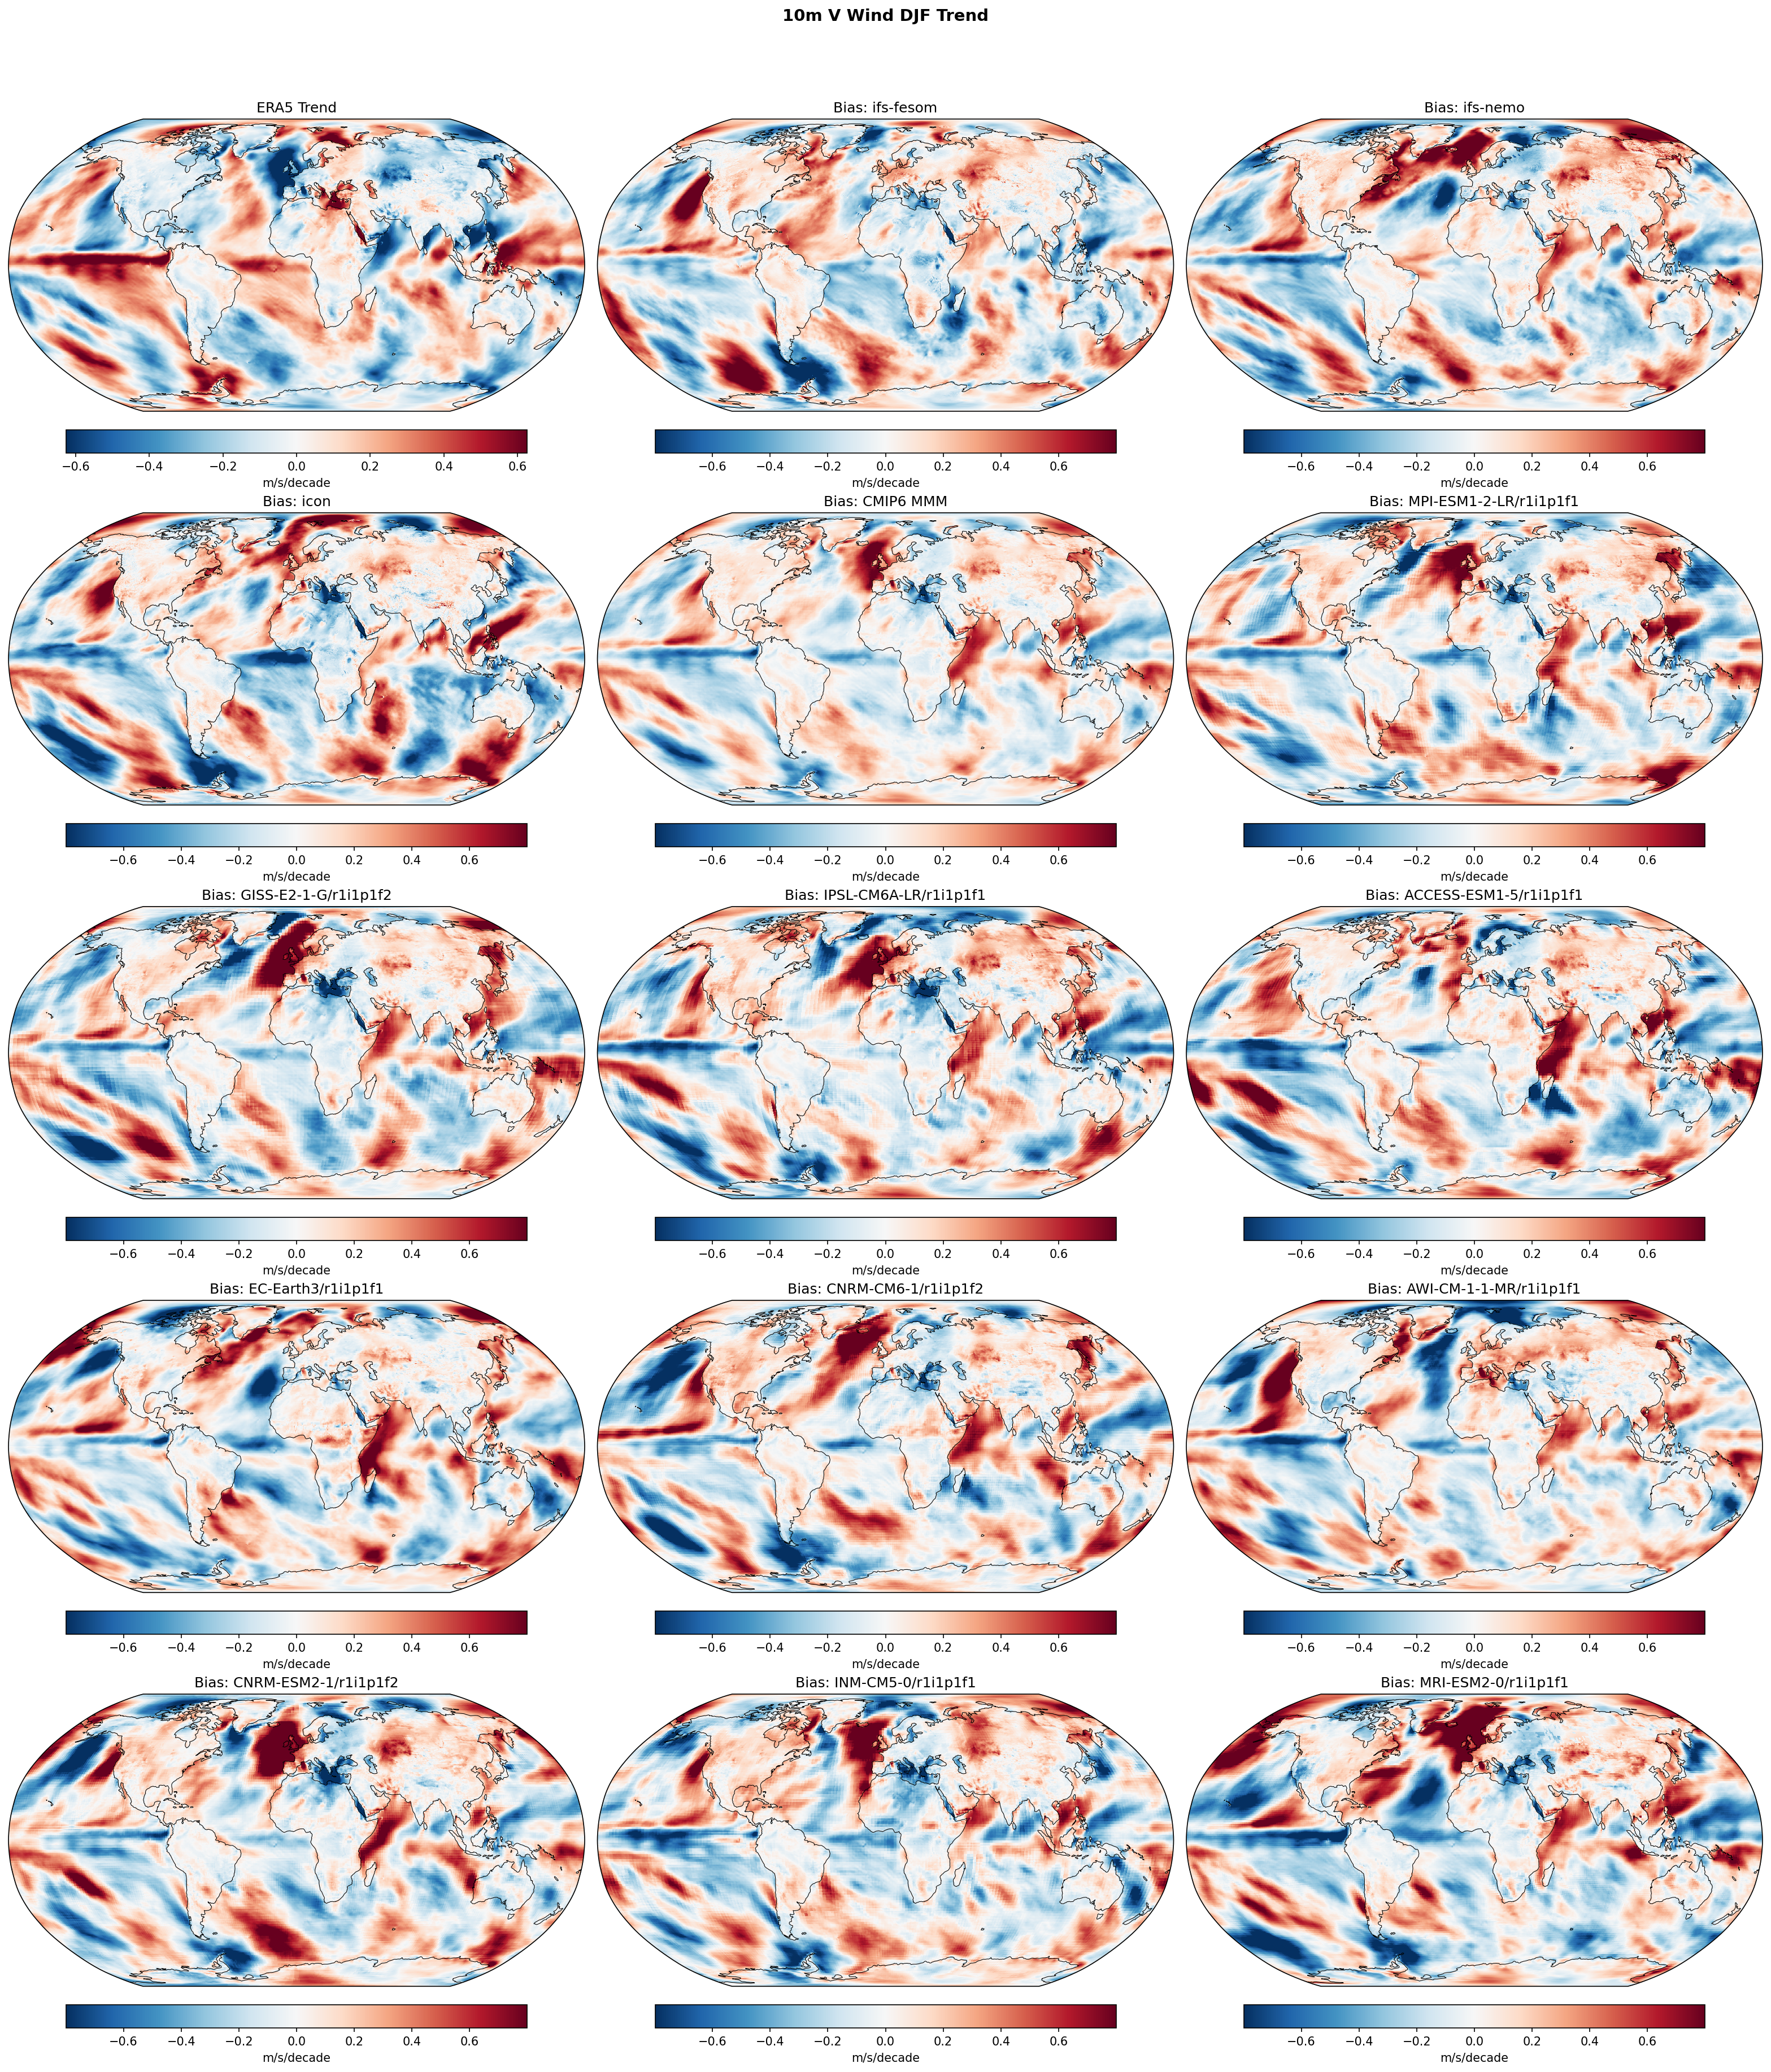
Summary high
This figure displays the linear trend in DJF meridional (10m V) wind over the 1990–2014 period for ERA5 reanalysis and the trend difference (bias) for DestinE and CMIP6 models. The analysis reveals substantial discrepancies between modeled and observed trends, characterized by large-scale regional dipoles rather than a uniform global bias.
Key Findings
- The ERA5 trend shows strong regional circulation shifts, notably a pronounced negative (northerly) trend in the North Atlantic and wave-train patterns in the Southern Hemisphere.
- All models, including high-resolution DestinE simulations (IFS-FESOM, IFS-NEMO, ICON) and CMIP6 members, exhibit large trend biases (differences > 0.4 m/s/decade), often comparable in magnitude to the observed trends.
- There is little spatial agreement among the individual models or between models and observations, indicating that the 25-year trends are dominated by internal climate variability rather than a robust forced signal.
Spatial Patterns
ERA5 exhibits distinct wave-like trend structures in the Southern Ocean and a strong dipole in the North Atlantic/European sector. The bias maps for the models frequently show the inverse of these patterns (e.g., a positive/red bias in the North Atlantic where ERA5 is negative/blue), suggesting the models generally predict weak or randomly phased trends compared to the strong specific realization of variability in observations.
Model Agreement
Model-observation agreement is low, and inter-model agreement is also poor. The CMIP6 Multi-Model Mean (MMM) bias closely resembles the inverse of the ERA5 trend, confirming that the forced signal (captured by the MMM) is weak relative to the observed internal variability. DestinE models do not show significantly better agreement than standard resolution CMIP6 models for this metric.
Physical Interpretation
Meridional wind trends over a short 25-year period are heavily influenced by unforced internal variability modes (e.g., NAO, ENSO, SAM). Since free-running coupled models generate their own stochastic phasing of these modes, they are not expected to reproduce the specific historical trend realization seen in ERA5. The large 'biases' primarily reflect this mismatch in variability phasing rather than systematic errors in model physics or resolution.
Caveats
- Trend differences in free-running simulations over short periods (1990-2014) are expected due to internal variability and should not be interpreted as structural model deficiencies.
- The 10m wind field is highly noisy; 25 years is insufficient to separate forced climate change signals from decadal variability.
10m V Wind JJA Linear Trend
| Variables | avg_10v |
|---|---|
| Models | ifs-fesom, ifs-nemo, icon, CMIP6 MMM, MPI-ESM1-2-LR/r1i1p1f1, GISS-E2-1-G/r1i1p1f2, IPSL-CM6A-LR/r1i1p1f1, ACCESS-ESM1-5/r1i1p1f1, EC-Earth3/r1i1p1f1, CNRM-CM6-1/r1i1p1f2, AWI-CM-1-1-MR/r1i1p1f1, CNRM-ESM2-1/r1i1p1f2, INM-CM5-0/r1i1p1f1, MRI-ESM2-0/r1i1p1f1 |
| Reference Dataset | ERA5 |
| Units | m/s/decade |
| Period | 1990–2014 |
| CMIP6 MMM | Global Mean Trend Diff: -0.02 · Trend Rmse: None |
| MPI-ESM1-2-LR/r1i1p1f1 | Global Mean Trend Diff: -0.00 · Trend Rmse: None |
| GISS-E2-1-G/r1i1p1f2 | Global Mean Trend Diff: -0.02 · Trend Rmse: None |
| IPSL-CM6A-LR/r1i1p1f1 | Global Mean Trend Diff: -0.02 · Trend Rmse: None |
| ACCESS-ESM1-5/r1i1p1f1 | Global Mean Trend Diff: -0.00 · Trend Rmse: None |
| EC-Earth3/r1i1p1f1 | Global Mean Trend Diff: -0.01 · Trend Rmse: None |
| CNRM-CM6-1/r1i1p1f2 | Global Mean Trend Diff: -0.02 · Trend Rmse: None |
| AWI-CM-1-1-MR/r1i1p1f1 | Global Mean Trend Diff: -0.01 · Trend Rmse: None |
| CNRM-ESM2-1/r1i1p1f2 | Global Mean Trend Diff: -0.02 · Trend Rmse: None |
| INM-CM5-0/r1i1p1f1 | Global Mean Trend Diff: -0.02 · Trend Rmse: None |
| MRI-ESM2-0/r1i1p1f1 | Global Mean Trend Diff: -0.04 · Trend Rmse: None |
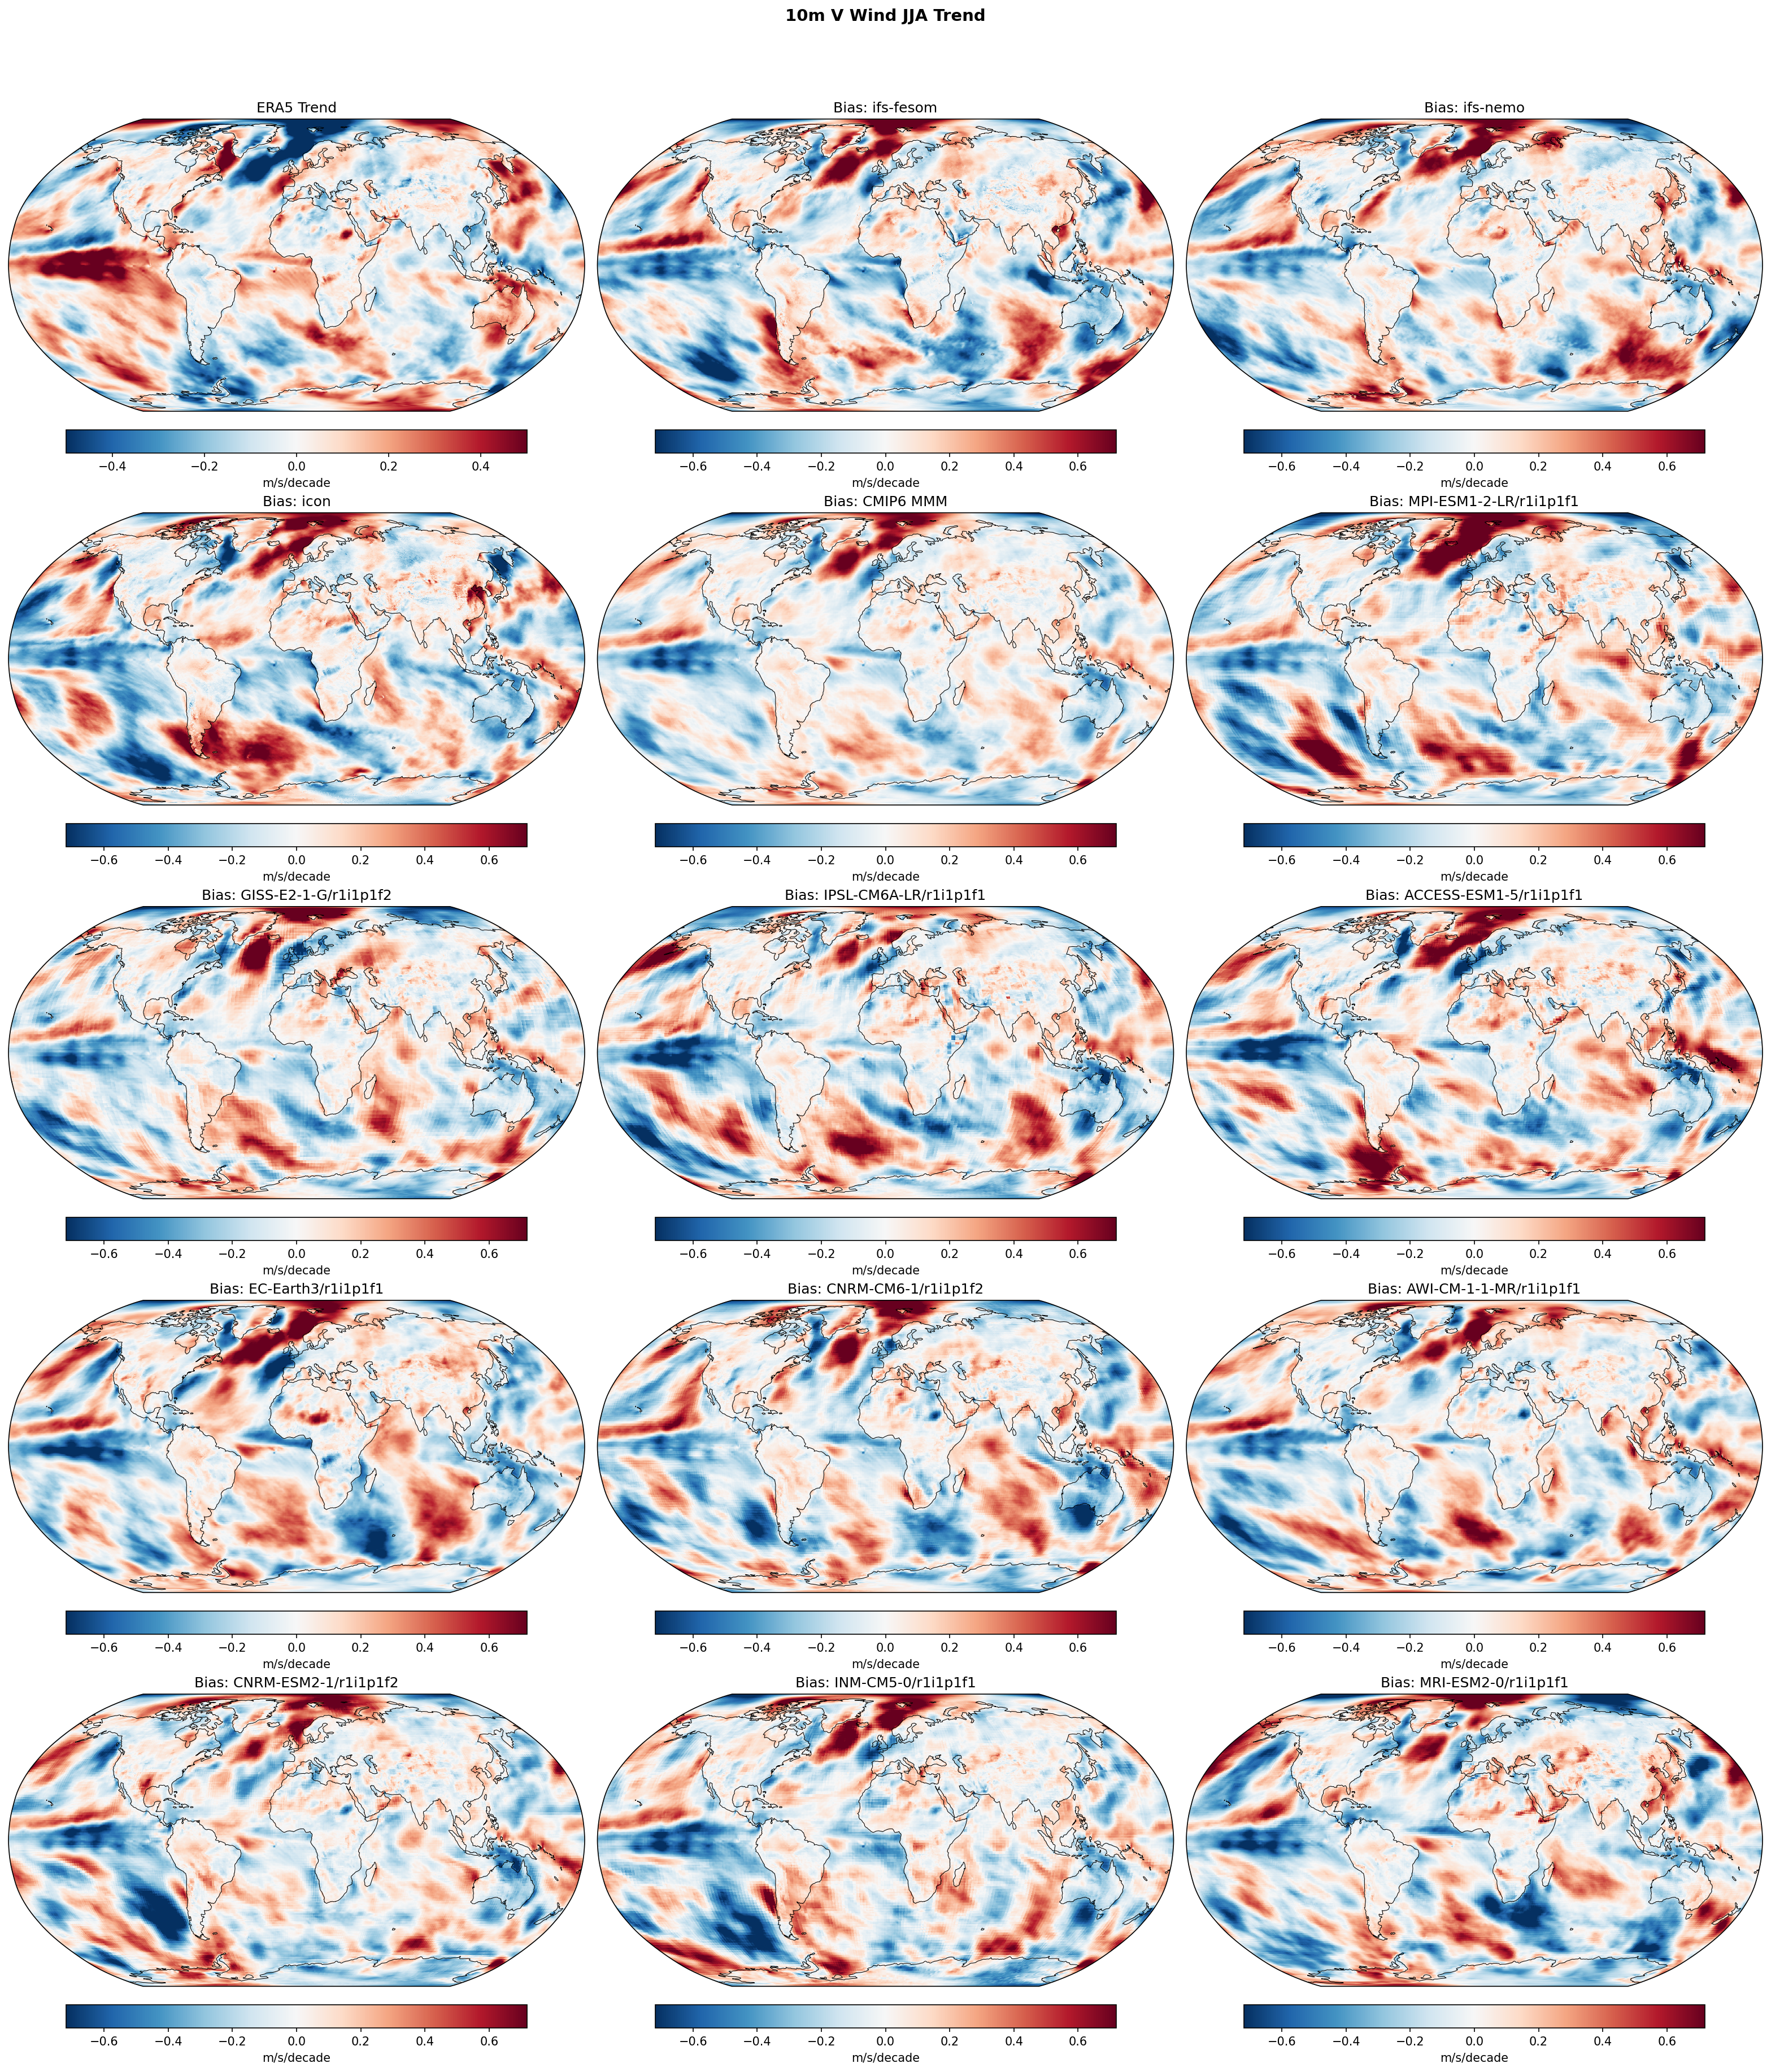
Summary high
This figure evaluates linear trends in JJA 10m meridional (V) wind from 1990–2014, comparing ERA5 observations against high-resolution DestinE models and the CMIP6 ensemble. The analysis reveals widespread discrepancies between modeled and observed trends, dominated by internal climate variability and a systematic inability of models to capture observed circulation changes in the tropical Pacific.
Key Findings
- **Dominance of Internal Variability:** Large trend differences (biases) exceeding +/- 0.6 m/s/decade are ubiquitous across all models (DestinE and CMIP6). This is expected for free-running coupled models over a short 25-year period, as they generate their own phases of internal variability (e.g., ENSO, IPO) that do not synchronize with the historical realization.
- **Systematic Pacific Discrepancy:** A robust systematic error appears in the central/eastern equatorial Pacific. ERA5 shows a positive trend (strengthening southerly component, red), while almost all models, including the CMIP6 MMM, show a strong negative trend difference (blue). This indicates the models fail to simulate the observed intensification of Pacific circulation during this period.
- **No Resolution Benefit for Decadal Trends:** The ~5 km DestinE models (IFS-FESOM, IFS-NEMO, ICON) exhibit similar error magnitudes and spatial patterns to standard-resolution CMIP6 models, confirming that higher resolution does not automatically correct discrepancies driven by multidecadal variability phases or large-scale coupled response errors.
Spatial Patterns
ERA5 shows a distinct positive trend (red) in the central equatorial Pacific and western Indian Ocean (Somali Jet region). The model bias maps are dominated by a 'blue blob' in the central Pacific, indicating modeled trends are significantly more negative (or less positive) than observed. High-latitude regions, particularly the Southern Ocean, show noisy, high-magnitude dipole errors reflecting shifts in the storm tracks that differ randomly between models.
Model Agreement
There is high inter-model variability in the extratropics, consistent with stochastic noise. However, there is strong inter-model agreement on the *sign* of the error in the tropical Pacific (negative bias), shared by IFS-FESOM, IFS-NEMO, ICON, and the CMIP6 Mean. IFS-FESOM and IFS-NEMO show very similar bias patterns, suggesting the atmospheric component (IFS) or common coupled biases dominate over ocean grid differences.
Physical Interpretation
The 1990–2014 period coincided with a negative phase of the Interdecadal Pacific Oscillation (IPO), characterized by cooling eastern Pacific SSTs and strengthened trade winds. Coupled models generally fail to capture this specific historical multidecadal variability, often predicting a weakening Walker circulation (El Niño-like trend) instead. The systematic negative bias in meridional wind trends in the Pacific reflects this common failure to capture the observed strengthening of the trade winds.
Caveats
- The 25-year analysis period (1990–2014) is short relative to multidecadal variability timescales; 'biases' largely represent phase mismatches in uninitialized simulations rather than purely structural errors.
- Trend significance is not overlaid, so it is unclear which features in the ERA5 baseline are statistically robust versus noise.
2m Temperature Annual Linear Trend
| Variables | avg_2t |
|---|---|
| Models | ifs-fesom, ifs-nemo, icon, CMIP6 MMM, MPI-ESM1-2-LR/r1i1p1f1, GISS-E2-1-G/r1i1p1f2, IPSL-CM6A-LR/r1i1p1f1, ACCESS-ESM1-5/r1i1p1f1, EC-Earth3/r1i1p1f1, CNRM-CM6-1/r1i1p1f2, AWI-CM-1-1-MR/r1i1p1f1, CNRM-ESM2-1/r1i1p1f2, FGOALS-g3/r1i1p1f1, INM-CM5-0/r1i1p1f1, MRI-ESM2-0/r1i1p1f1 |
| Reference Dataset | ERA5 |
| Units | K/decade |
| Period | 1990–2014 |
| ifs-fesom | Global Mean Trend: 0.20 · Global Mean Trend Diff: 0.03 · Trend Rmse: 0.32 |
| ifs-nemo | Global Mean Trend: 0.19 · Global Mean Trend Diff: 0.01 · Trend Rmse: 0.30 |
| icon | Global Mean Trend: 0.25 · Global Mean Trend Diff: 0.08 · Trend Rmse: 0.33 |
| CMIP6 MMM | Global Mean Trend Diff: 0.12 · Trend Rmse: 0.25 |
| MPI-ESM1-2-LR/r1i1p1f1 | Global Mean Trend Diff: 0.01 · Trend Rmse: 0.26 |
| GISS-E2-1-G/r1i1p1f2 | Global Mean Trend Diff: 0.10 · Trend Rmse: 0.31 |
| IPSL-CM6A-LR/r1i1p1f1 | Global Mean Trend Diff: 0.13 · Trend Rmse: 0.36 |
| ACCESS-ESM1-5/r1i1p1f1 | Global Mean Trend Diff: 0.22 · Trend Rmse: 0.39 |
| EC-Earth3/r1i1p1f1 | Global Mean Trend Diff: 0.32 · Trend Rmse: 0.51 |
| CNRM-CM6-1/r1i1p1f2 | Global Mean Trend Diff: 0.01 · Trend Rmse: 0.39 |
| AWI-CM-1-1-MR/r1i1p1f1 | Global Mean Trend Diff: 0.14 · Trend Rmse: 0.31 |
| CNRM-ESM2-1/r1i1p1f2 | Global Mean Trend Diff: 0.09 · Trend Rmse: 0.29 |
| FGOALS-g3/r1i1p1f1 | Global Mean Trend Diff: 0.13 · Trend Rmse: 0.34 |
| INM-CM5-0/r1i1p1f1 | Global Mean Trend Diff: 0.04 · Trend Rmse: 0.29 |
| MRI-ESM2-0/r1i1p1f1 | Global Mean Trend Diff: 0.10 · Trend Rmse: 0.30 |
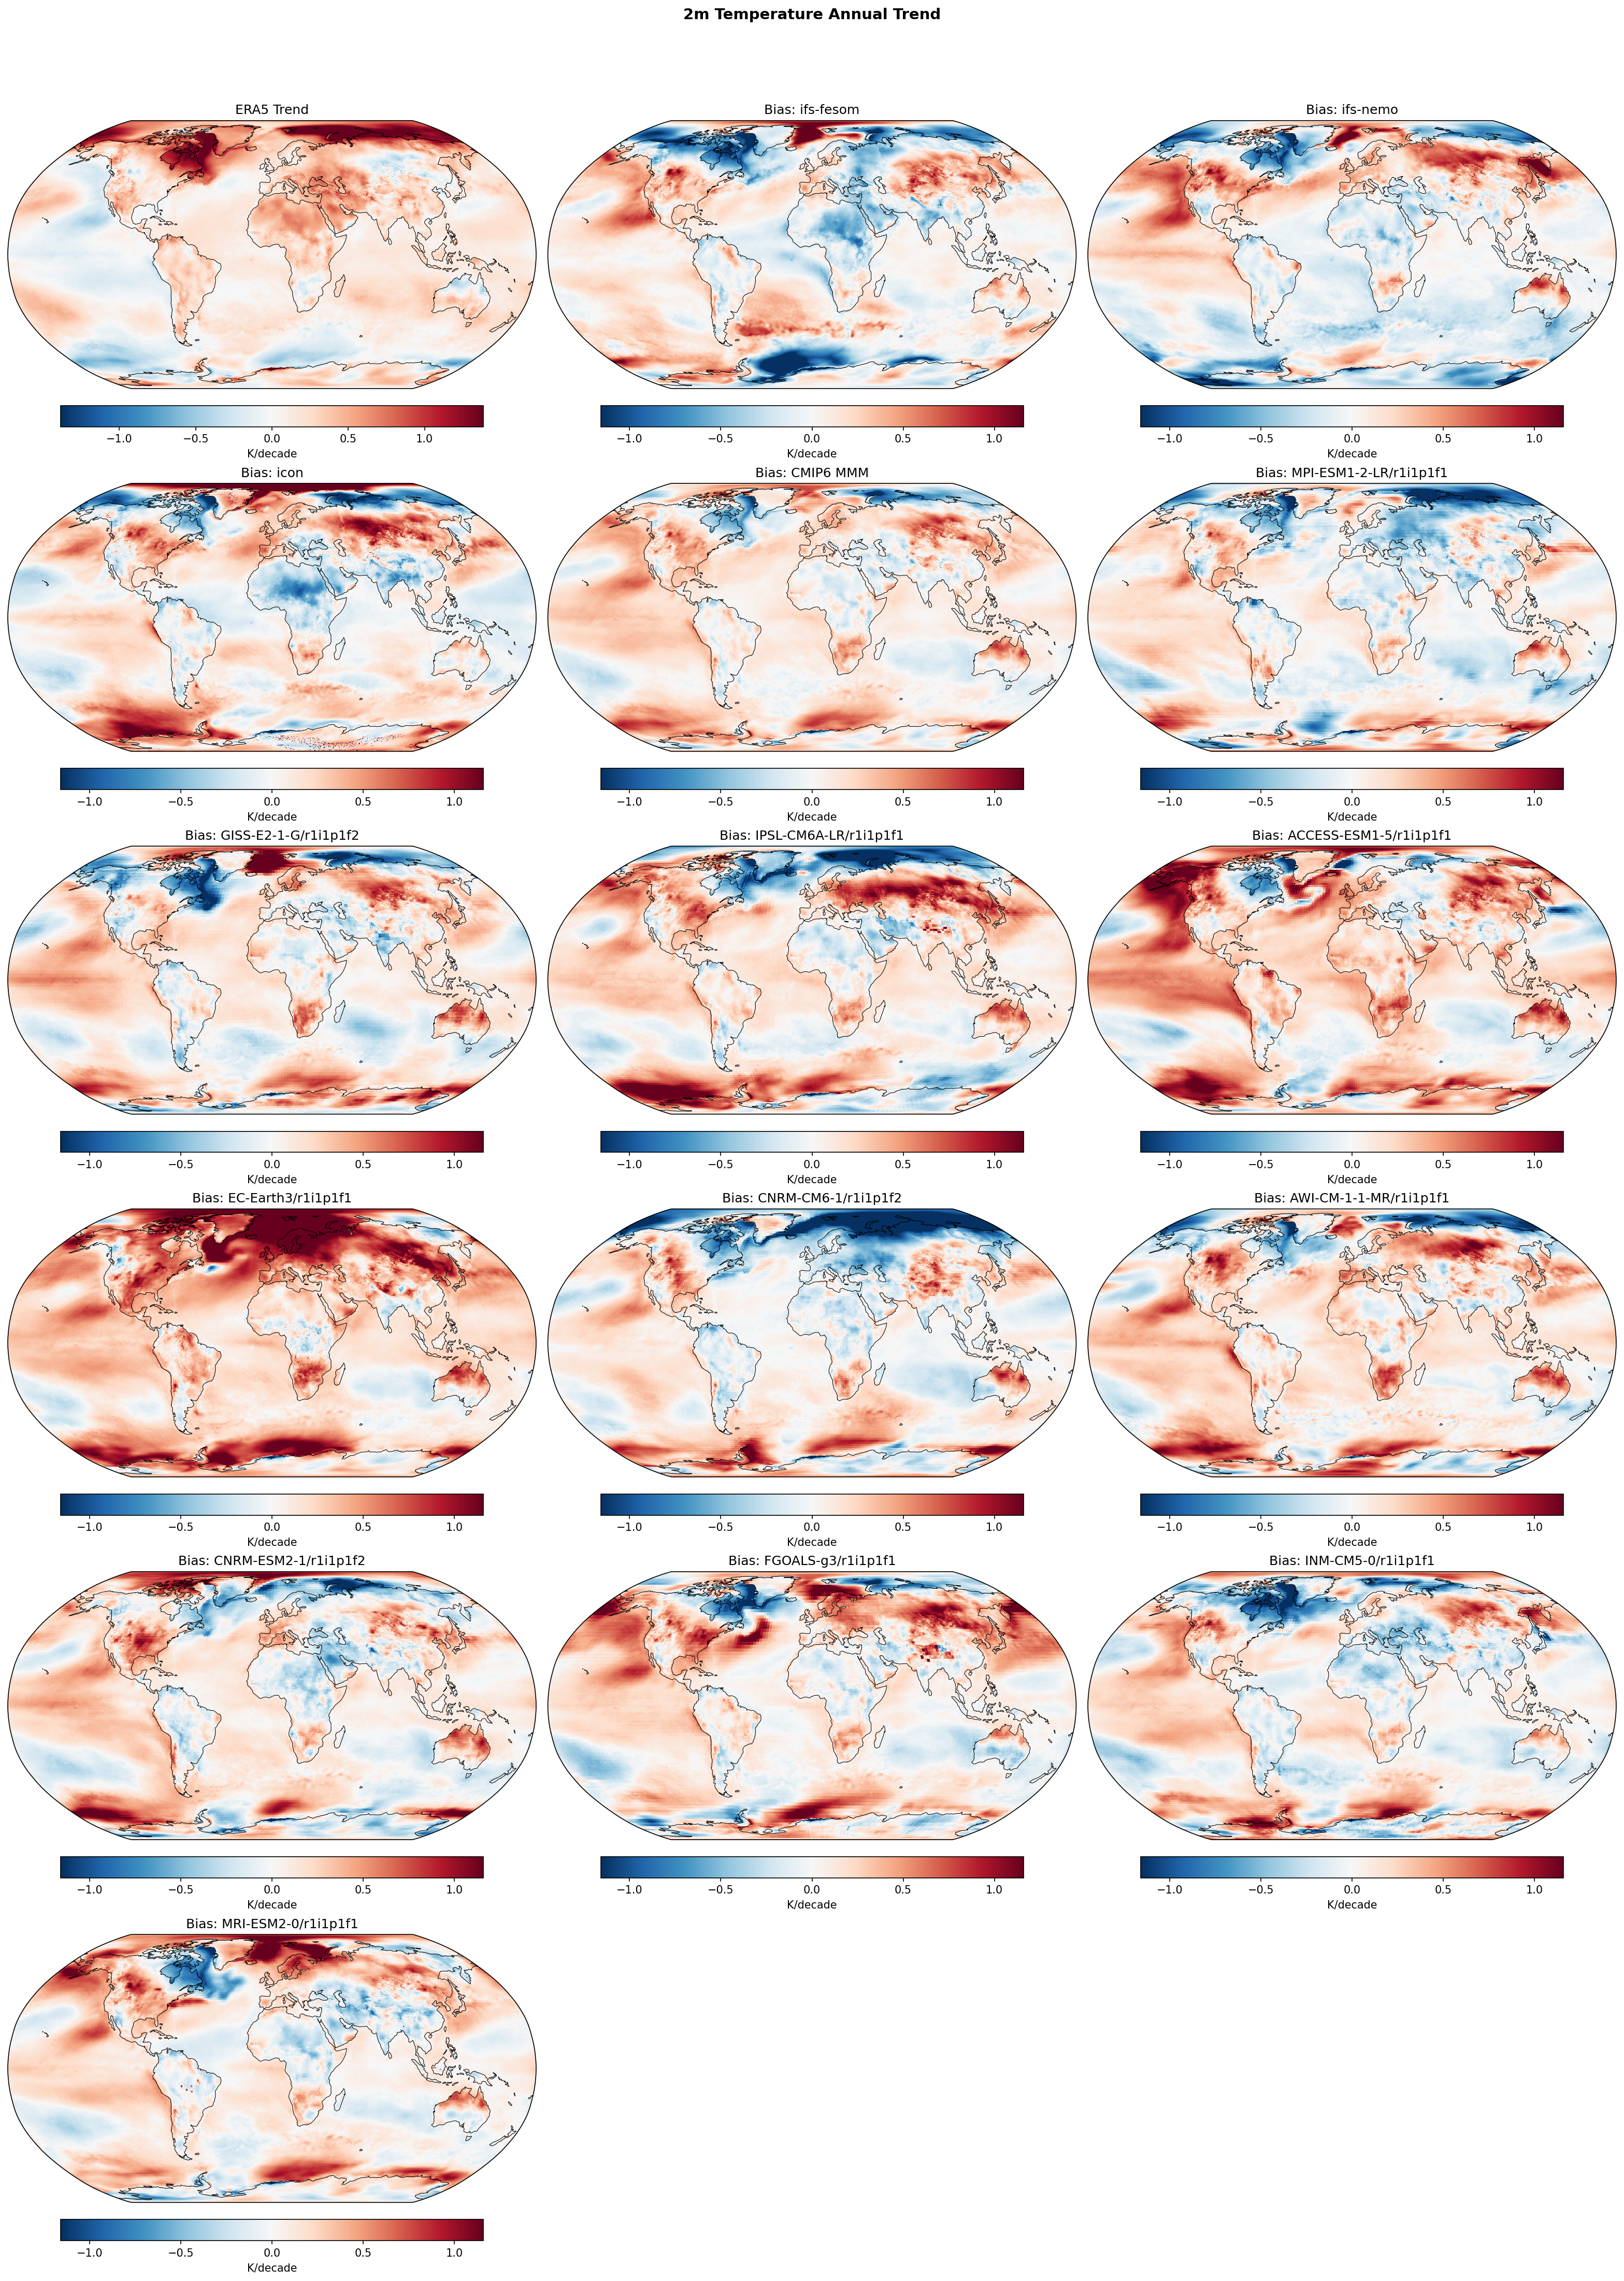
Summary high
This diagnostic evaluates annual linear trends in 2m temperature over the 1990–2014 period, comparing DestinE coupled models (IFS-FESOM, IFS-NEMO, ICON) against ERA5 reanalysis and the CMIP6 ensemble. The analysis focuses on the ability of high-resolution models to capture regional warming rates and the global warming hiatus/slowdown features characteristic of this specific observational window.
Key Findings
- IFS-NEMO exhibits excellent agreement with the observed global mean warming rate (difference of +0.015 K/decade), outperforming the CMIP6 Multi-Model Mean (+0.118 K/decade) and matching the best-performing CMIP6 models (e.g., MPI-ESM1-2-LR).
- DestinE models (especially ICON and IFS-NEMO) capture a cooling trend in the North Atlantic 'warming hole' region (indicated by blue bias or neutral signal), whereas the CMIP6 MMM displays a red bias (warming) in this region, suggesting high resolution better resolves the associated gyre/AMOC dynamics.
- While ERA5 shows intense Arctic Amplification, the DestinE models show a negative (blue) trend bias in the Barents-Kara sector, indicating they underestimate the magnitude of recent Arctic warming compared to observations.
- ICON displays stronger regional biases than the IFS variants, particularly a pronounced cold bias in the North Atlantic trend and excessive warming in the Southern Ocean.
Spatial Patterns
ERA5 shows strong Arctic warming and cooling in the Eastern Pacific (PDO/IPO negative phase) and North Atlantic. Most coupled models (DestinE and CMIP6) show a positive (red) trend bias in the Eastern Pacific, indicating they do not reproduce the specific phase of internal variability (cooling) observed 1990–2014. In the Southern Hemisphere, DestinE models tend to warm the Southern Ocean more than observed (red bias), while the North Atlantic shows distinct cooling signals in high-res models (blue bias in ICON/IFS) compared to warming biases in the standard-resolution CMIP6 MMM.
Model Agreement
IFS-NEMO and IFS-FESOM show strong consistency with each other and closest agreement with ERA5 regarding global magnitude, with IFS-NEMO having the lowest RMSE (0.298 K/decade) among DestinE models. ICON is an outlier with higher RMSE (0.325 K/decade) and sharper regional contrasts. The CMIP6 ensemble is generally 'hotter' (redder bias maps) than the DestinE models, driven by high-sensitivity members like EC-Earth3.
Physical Interpretation
The pervasive positive bias in the Eastern Pacific across models reflects the difficulty free-running coupled simulations have in synchronizing with observed decadal variability (e.g., the 'hiatus' driven by trade wind intensification). The 'warming hole' in the North Atlantic is physically linked to AMOC slowdown and subpolar gyre dynamics; the high-resolution DestinE models resolve these gradients more sharply, leading to a stronger cooling trend (or even excessive cooling in ICON) compared to coarser CMIP6 models which diffuse this feature. The underestimation of Arctic warming in DestinE models suggests sea ice loss or high-latitude feedbacks are less amplified in these simulations than in reality.
Caveats
- The analysis period (1990–2014) is relatively short (25 years) and dominated by internal variability (PDO/IPO), making trend comparisons sensitive to unforced variability phases.
- Biases in trends do not necessarily imply biases in mean state, but rather in the rate of change (sensitivity or drift).
2m Temperature DJF Linear Trend
| Variables | avg_2t |
|---|---|
| Models | ifs-fesom, ifs-nemo, icon, CMIP6 MMM, MPI-ESM1-2-LR/r1i1p1f1, GISS-E2-1-G/r1i1p1f2, IPSL-CM6A-LR/r1i1p1f1, ACCESS-ESM1-5/r1i1p1f1, EC-Earth3/r1i1p1f1, CNRM-CM6-1/r1i1p1f2, AWI-CM-1-1-MR/r1i1p1f1, CNRM-ESM2-1/r1i1p1f2, FGOALS-g3/r1i1p1f1, INM-CM5-0/r1i1p1f1, MRI-ESM2-0/r1i1p1f1 |
| Reference Dataset | ERA5 |
| Units | K/decade |
| Period | 1990–2014 |
| CMIP6 MMM | Global Mean Trend Diff: 0.13 · Trend Rmse: None |
| MPI-ESM1-2-LR/r1i1p1f1 | Global Mean Trend Diff: -0.01 · Trend Rmse: None |
| GISS-E2-1-G/r1i1p1f2 | Global Mean Trend Diff: 0.09 · Trend Rmse: None |
| IPSL-CM6A-LR/r1i1p1f1 | Global Mean Trend Diff: 0.12 · Trend Rmse: None |
| ACCESS-ESM1-5/r1i1p1f1 | Global Mean Trend Diff: 0.27 · Trend Rmse: None |
| EC-Earth3/r1i1p1f1 | Global Mean Trend Diff: 0.36 · Trend Rmse: None |
| CNRM-CM6-1/r1i1p1f2 | Global Mean Trend Diff: -0.01 · Trend Rmse: None |
| AWI-CM-1-1-MR/r1i1p1f1 | Global Mean Trend Diff: 0.14 · Trend Rmse: None |
| CNRM-ESM2-1/r1i1p1f2 | Global Mean Trend Diff: 0.13 · Trend Rmse: None |
| FGOALS-g3/r1i1p1f1 | Global Mean Trend Diff: 0.14 · Trend Rmse: None |
| INM-CM5-0/r1i1p1f1 | Global Mean Trend Diff: 0.07 · Trend Rmse: None |
| MRI-ESM2-0/r1i1p1f1 | Global Mean Trend Diff: 0.11 · Trend Rmse: None |
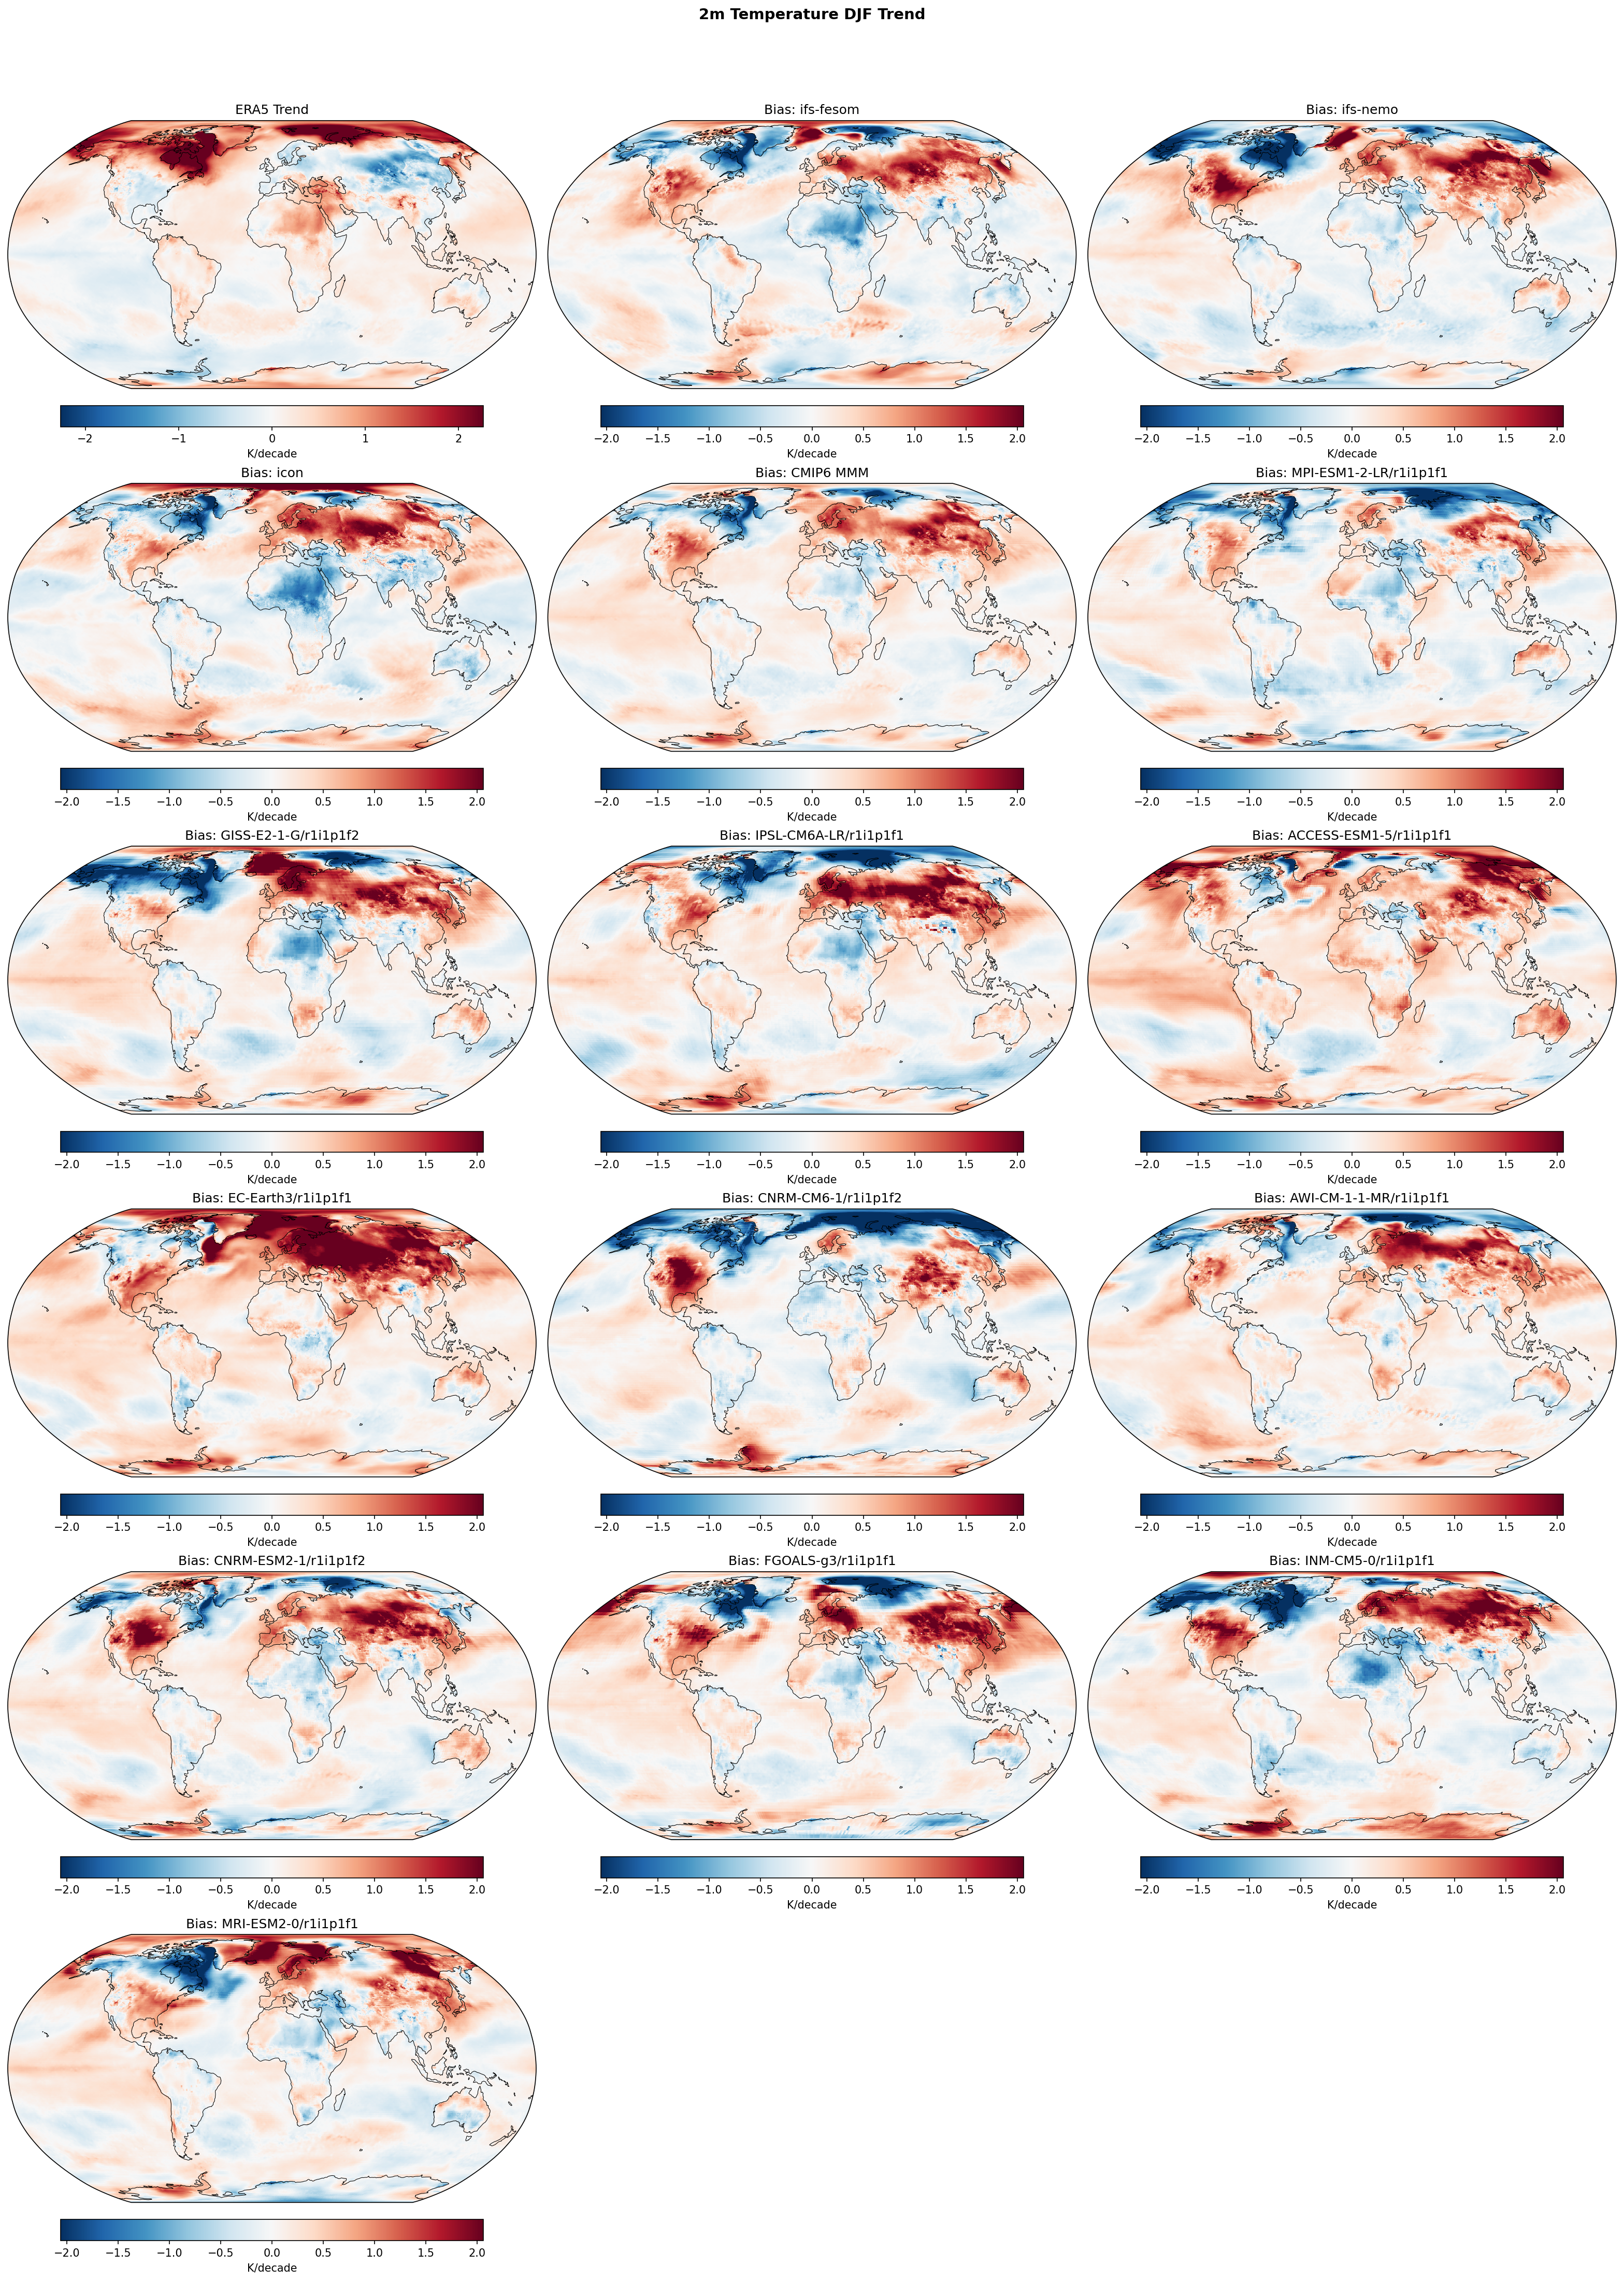
Summary high
This diagnostic evaluates boreal winter (DJF) 2m temperature linear trends from 1990–2014, revealing a systematic divergence where models simulate widespread warming over Northern Hemisphere continents while observations show regional cooling.
Key Findings
- Most models (DestinE and CMIP6) strongly overestimate warming trends over Northern Eurasia and North America compared to ERA5, which shows cooling in these regions for this specific period.
- The DestinE model `ifs-fesom` exhibits smaller trend biases than `ifs-nemo` and `icon`, showing better agreement with observations over the oceans and less extreme warming biases over land.
- Many models, including the CMIP6 Multi-Model Mean and `ifs-nemo`, underestimate the intensity of observed warming in the Barents-Kara Sea region (Arctic Amplification), appearing as a local cooling bias.
Spatial Patterns
The difference maps are dominated by strong positive (red) trend biases (> +1.5 K/decade) over Siberia and Canada. In contrast, tropical and subtropical ocean trends show much better agreement (pale colors). A distinct 'blue' bias (underestimated warming) appears in the Barents Sea sector for several models.
Model Agreement
There is high consistency across both high-resolution DestinE models and the CMIP6 ensemble in missing the observed NH land cooling pattern. `EC-Earth3` and `ACCESS-ESM1-5` show the most severe warming biases, while `ifs-fesom` is comparable to better-performing CMIP6 members like `MPI-ESM1-2-LR`.
Physical Interpretation
The discrepancies likely stem from internal climate variability (e.g., NAO/AO phases) dominating the short 1990–2014 observed record, causing dynamic cooling over NH land. Free-running coupled models capture the forced greenhouse gas warming signal but cannot match the specific phase of random internal variability, resulting in apparent warming biases.
Caveats
- The 25-year analysis period is too short to robustly disentangle forced climate trends from multi-decadal internal variability.
- Trend differences here largely reflect phase mismatches in variability rather than fundamental errors in model physics.
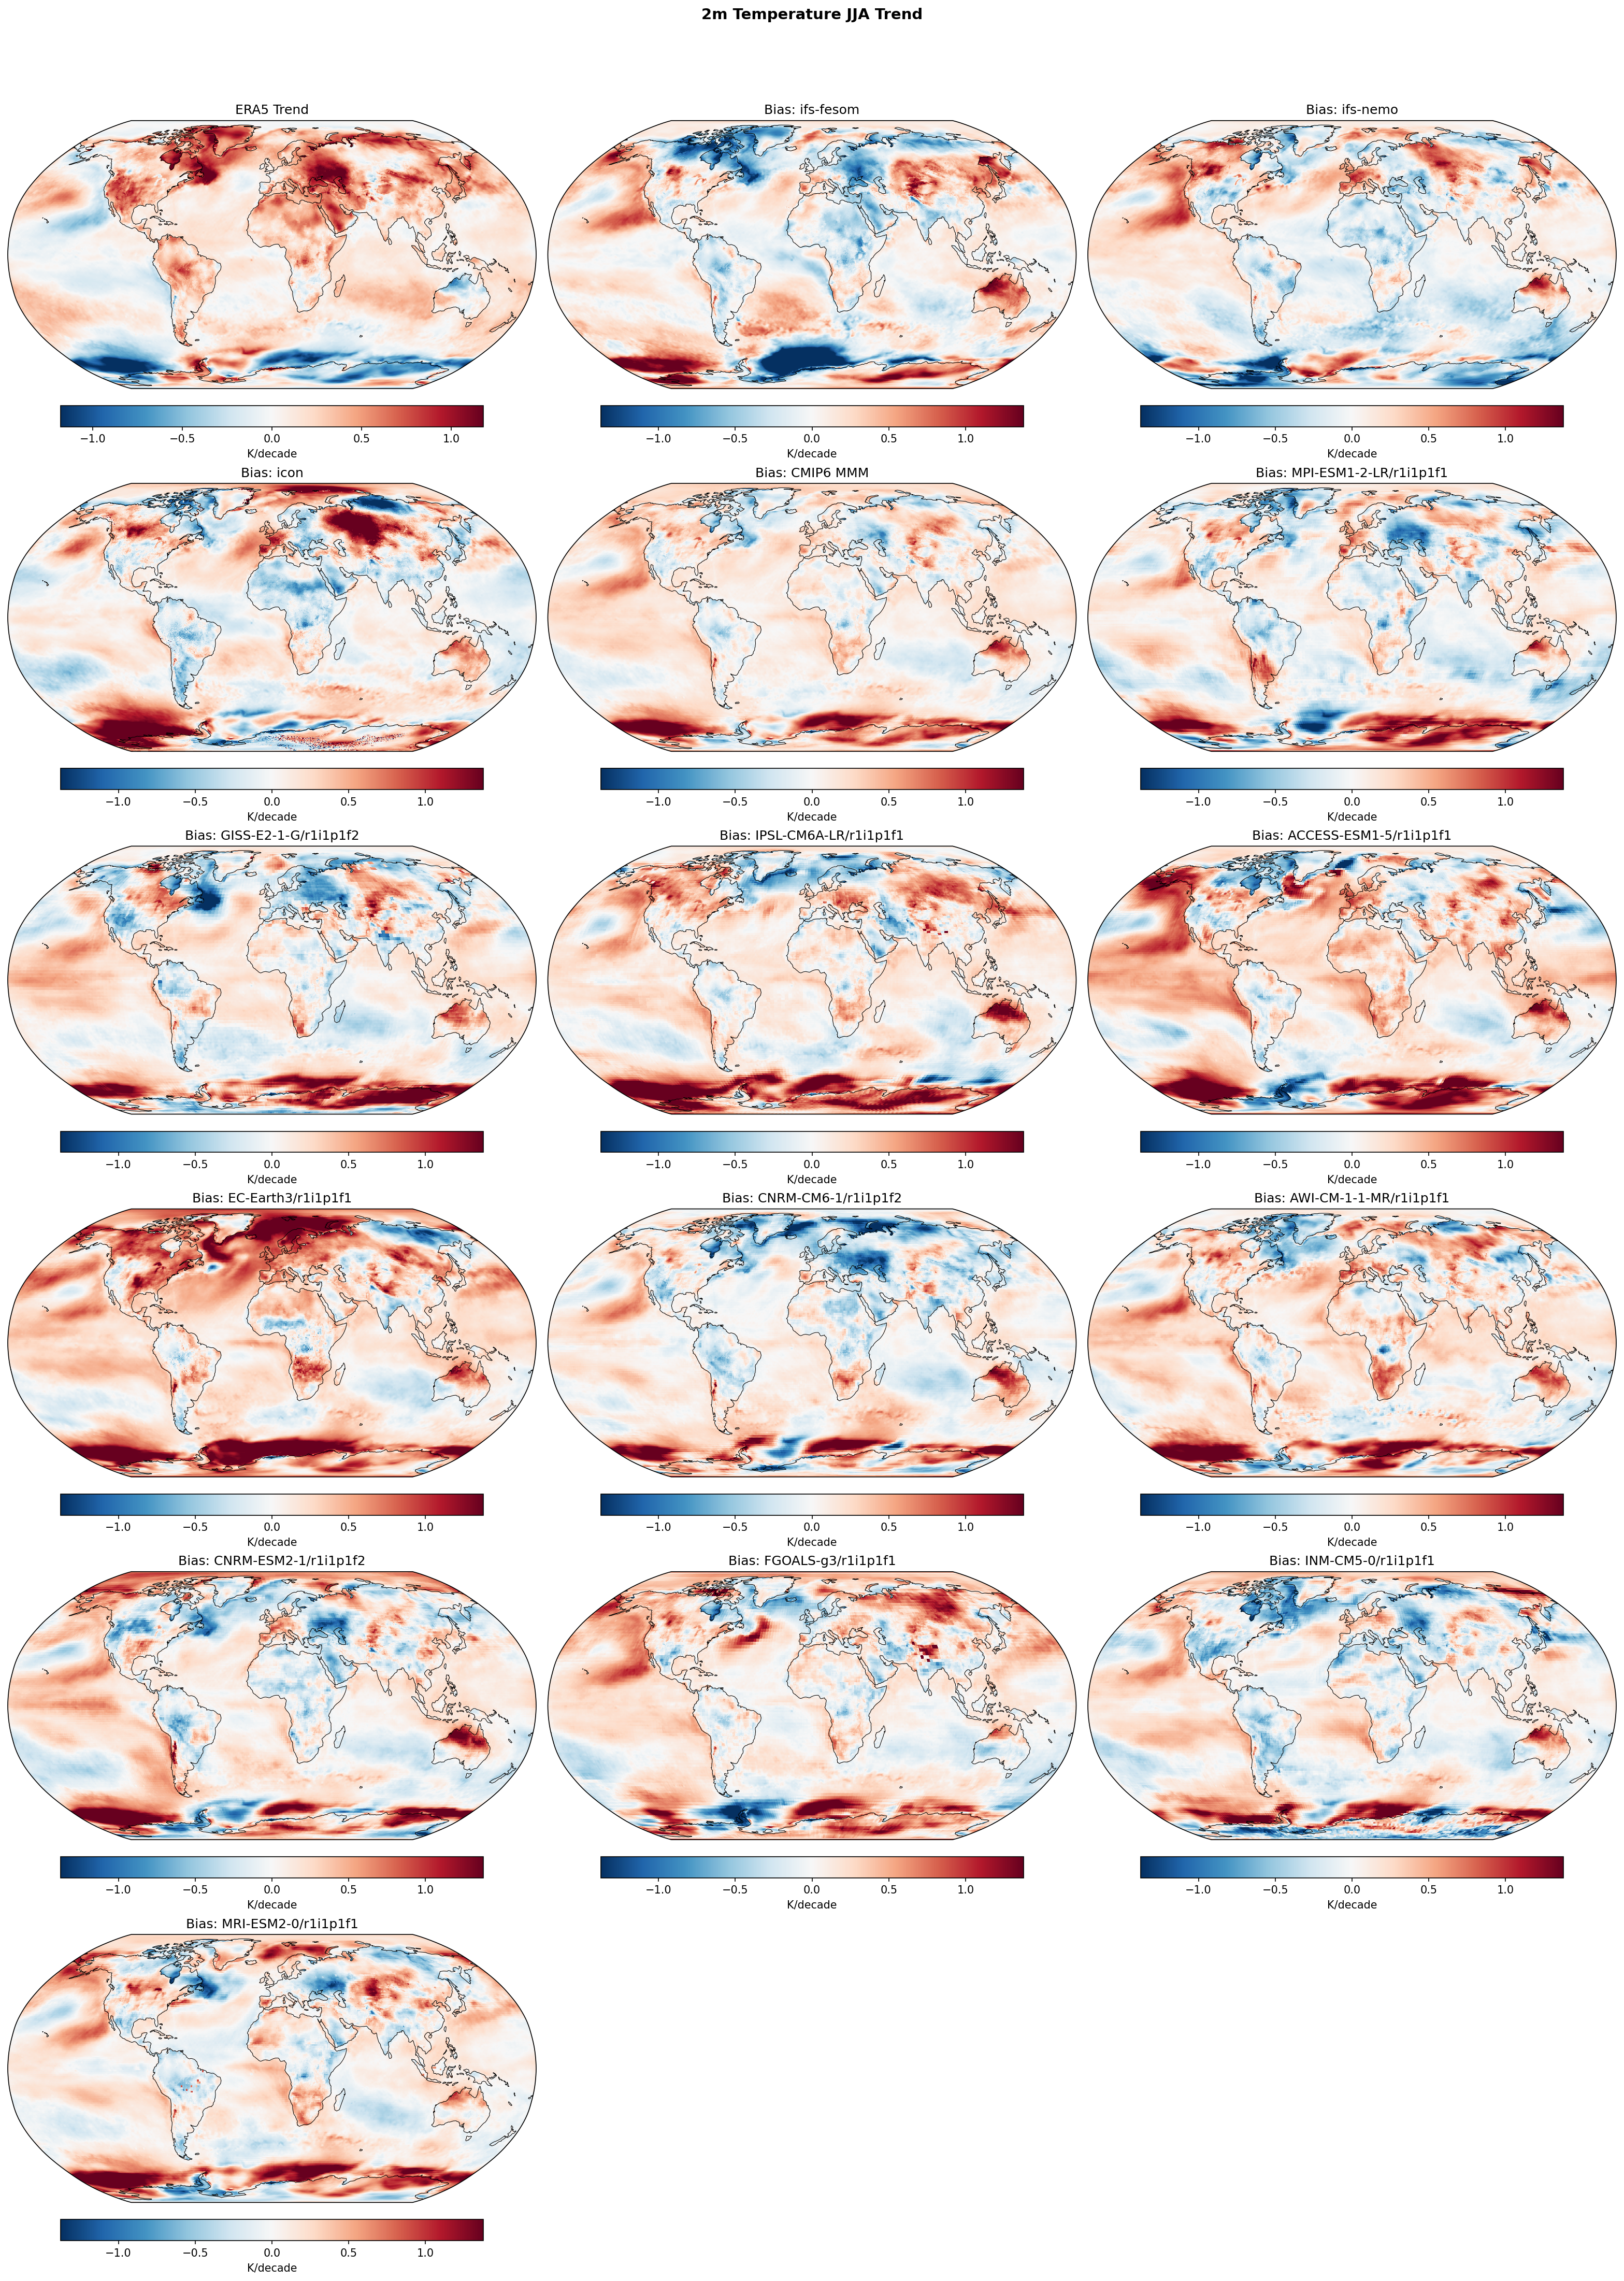
2m Temperature JJA Linear Trend
| Variables | avg_2t |
|---|---|
| Models | ifs-fesom, ifs-nemo, icon, CMIP6 MMM, MPI-ESM1-2-LR/r1i1p1f1, GISS-E2-1-G/r1i1p1f2, IPSL-CM6A-LR/r1i1p1f1, ACCESS-ESM1-5/r1i1p1f1, EC-Earth3/r1i1p1f1, CNRM-CM6-1/r1i1p1f2, AWI-CM-1-1-MR/r1i1p1f1, CNRM-ESM2-1/r1i1p1f2, FGOALS-g3/r1i1p1f1, INM-CM5-0/r1i1p1f1, MRI-ESM2-0/r1i1p1f1 |
| Reference Dataset | ERA5 |
| Units | K/decade |
| Period | 1990–2014 |
| CMIP6 MMM | Global Mean Trend Diff: 0.13 · Trend Rmse: None |
| MPI-ESM1-2-LR/r1i1p1f1 | Global Mean Trend Diff: 0.04 · Trend Rmse: None |
| GISS-E2-1-G/r1i1p1f2 | Global Mean Trend Diff: 0.10 · Trend Rmse: None |
| IPSL-CM6A-LR/r1i1p1f1 | Global Mean Trend Diff: 0.17 · Trend Rmse: None |
| ACCESS-ESM1-5/r1i1p1f1 | Global Mean Trend Diff: 0.22 · Trend Rmse: None |
| EC-Earth3/r1i1p1f1 | Global Mean Trend Diff: 0.30 · Trend Rmse: None |
| CNRM-CM6-1/r1i1p1f2 | Global Mean Trend Diff: 0.04 · Trend Rmse: None |
| AWI-CM-1-1-MR/r1i1p1f1 | Global Mean Trend Diff: 0.16 · Trend Rmse: None |
| CNRM-ESM2-1/r1i1p1f2 | Global Mean Trend Diff: 0.10 · Trend Rmse: None |
| FGOALS-g3/r1i1p1f1 | Global Mean Trend Diff: 0.13 · Trend Rmse: None |
| INM-CM5-0/r1i1p1f1 | Global Mean Trend Diff: 0.04 · Trend Rmse: None |
| MRI-ESM2-0/r1i1p1f1 | Global Mean Trend Diff: 0.12 · Trend Rmse: None |
Summary medium
This figure displays the linear trend in June-August (JJA) 2-meter temperature from 1990–2014 for ERA5 observations and the difference (bias) for DestinE models (IFS-FESOM, IFS-NEMO, ICON) and various CMIP6 models. While ERA5 shows strong warming over Northern Hemisphere land and stability in the Southern Ocean, models generally overestimate Southern Ocean warming and show divergent behaviors over Northern Hemisphere continents.
Key Findings
- Systematic Southern Ocean bias: Nearly all models, including DestinE and CMIP6 members, overestimate warming trends (positive/red bias) in the Southern Ocean compared to the neutral/cooling trend in ERA5.
- Divergent Northern Hemisphere land trends: IFS-FESOM and IFS-NEMO underestimate the strong continental warming observed by ERA5 over Eurasia and North America (blue bias), whereas ICON substantially overestimates warming in the Arctic and Siberia (strong red bias).
- North Atlantic 'Warming Hole': A localized negative trend bias (blue) persists in the North Atlantic subpolar gyre across most models, indicating simulated trends are cooler than observations, potentially linked to AMOC dynamics.
Spatial Patterns
ERA5 observations (top-left) show distinct warming over Europe, North Africa, and the Arctic, with a 'warming hole' in the North Atlantic and minimal warming in the Southern Ocean. The model bias maps reveal a global mismatch: widespread positive trend biases (red) over the oceans (especially Southern Hemisphere) and negative trend biases (blue) over Northern Hemisphere mid-latitude land masses in the IFS and CMIP6 mean. ICON is an outlier spatially, showing intense positive trend biases over the high-latitude Arctic and land, contrasting with the negative biases of the IFS variants.
Model Agreement
There is broad qualitative agreement between IFS-FESOM, IFS-NEMO, and the CMIP6 Multi-Model Mean (MMM) regarding the underestimation of NH land warming and overestimation of SO warming. ICON disagrees with this consensus, showing a unique amplification of Arctic warming trends. Individual CMIP6 members show high variance (e.g., ACCESS-ESM1-5 is generally warmer/redder, while INM-CM5-0 is neutral), highlighting the significant role of internal variability in 25-year trend estimates.
Physical Interpretation
The widespread Southern Ocean warm bias suggests models fail to capture the observed delayed warming, likely due to difficulties in representing vertical mixing, cloud feedbacks, or wind-driven circulation changes (e.g., SAM trends). The underestimation of Eurasian warming in IFS models may result from internal decadal variability (e.g., atmospheric blocking patterns) not being in phase with observations, or deficiencies in land-surface feedbacks (drying/heating). ICON's excessive Arctic warming points to a potentially too-strong surface albedo feedback or cloud radiative effect in the polar summer.
Caveats
- The analysis period (1990–2014) is relatively short (25 years), meaning internal climate variability (e.g., IPO, AMO phases) significantly affects linear trends. Discrepancies may reflect phase mismatches in free-running models rather than structural errors.
- Trend significance is not shaded, so it is unclear which biases are statistically robust versus noise.
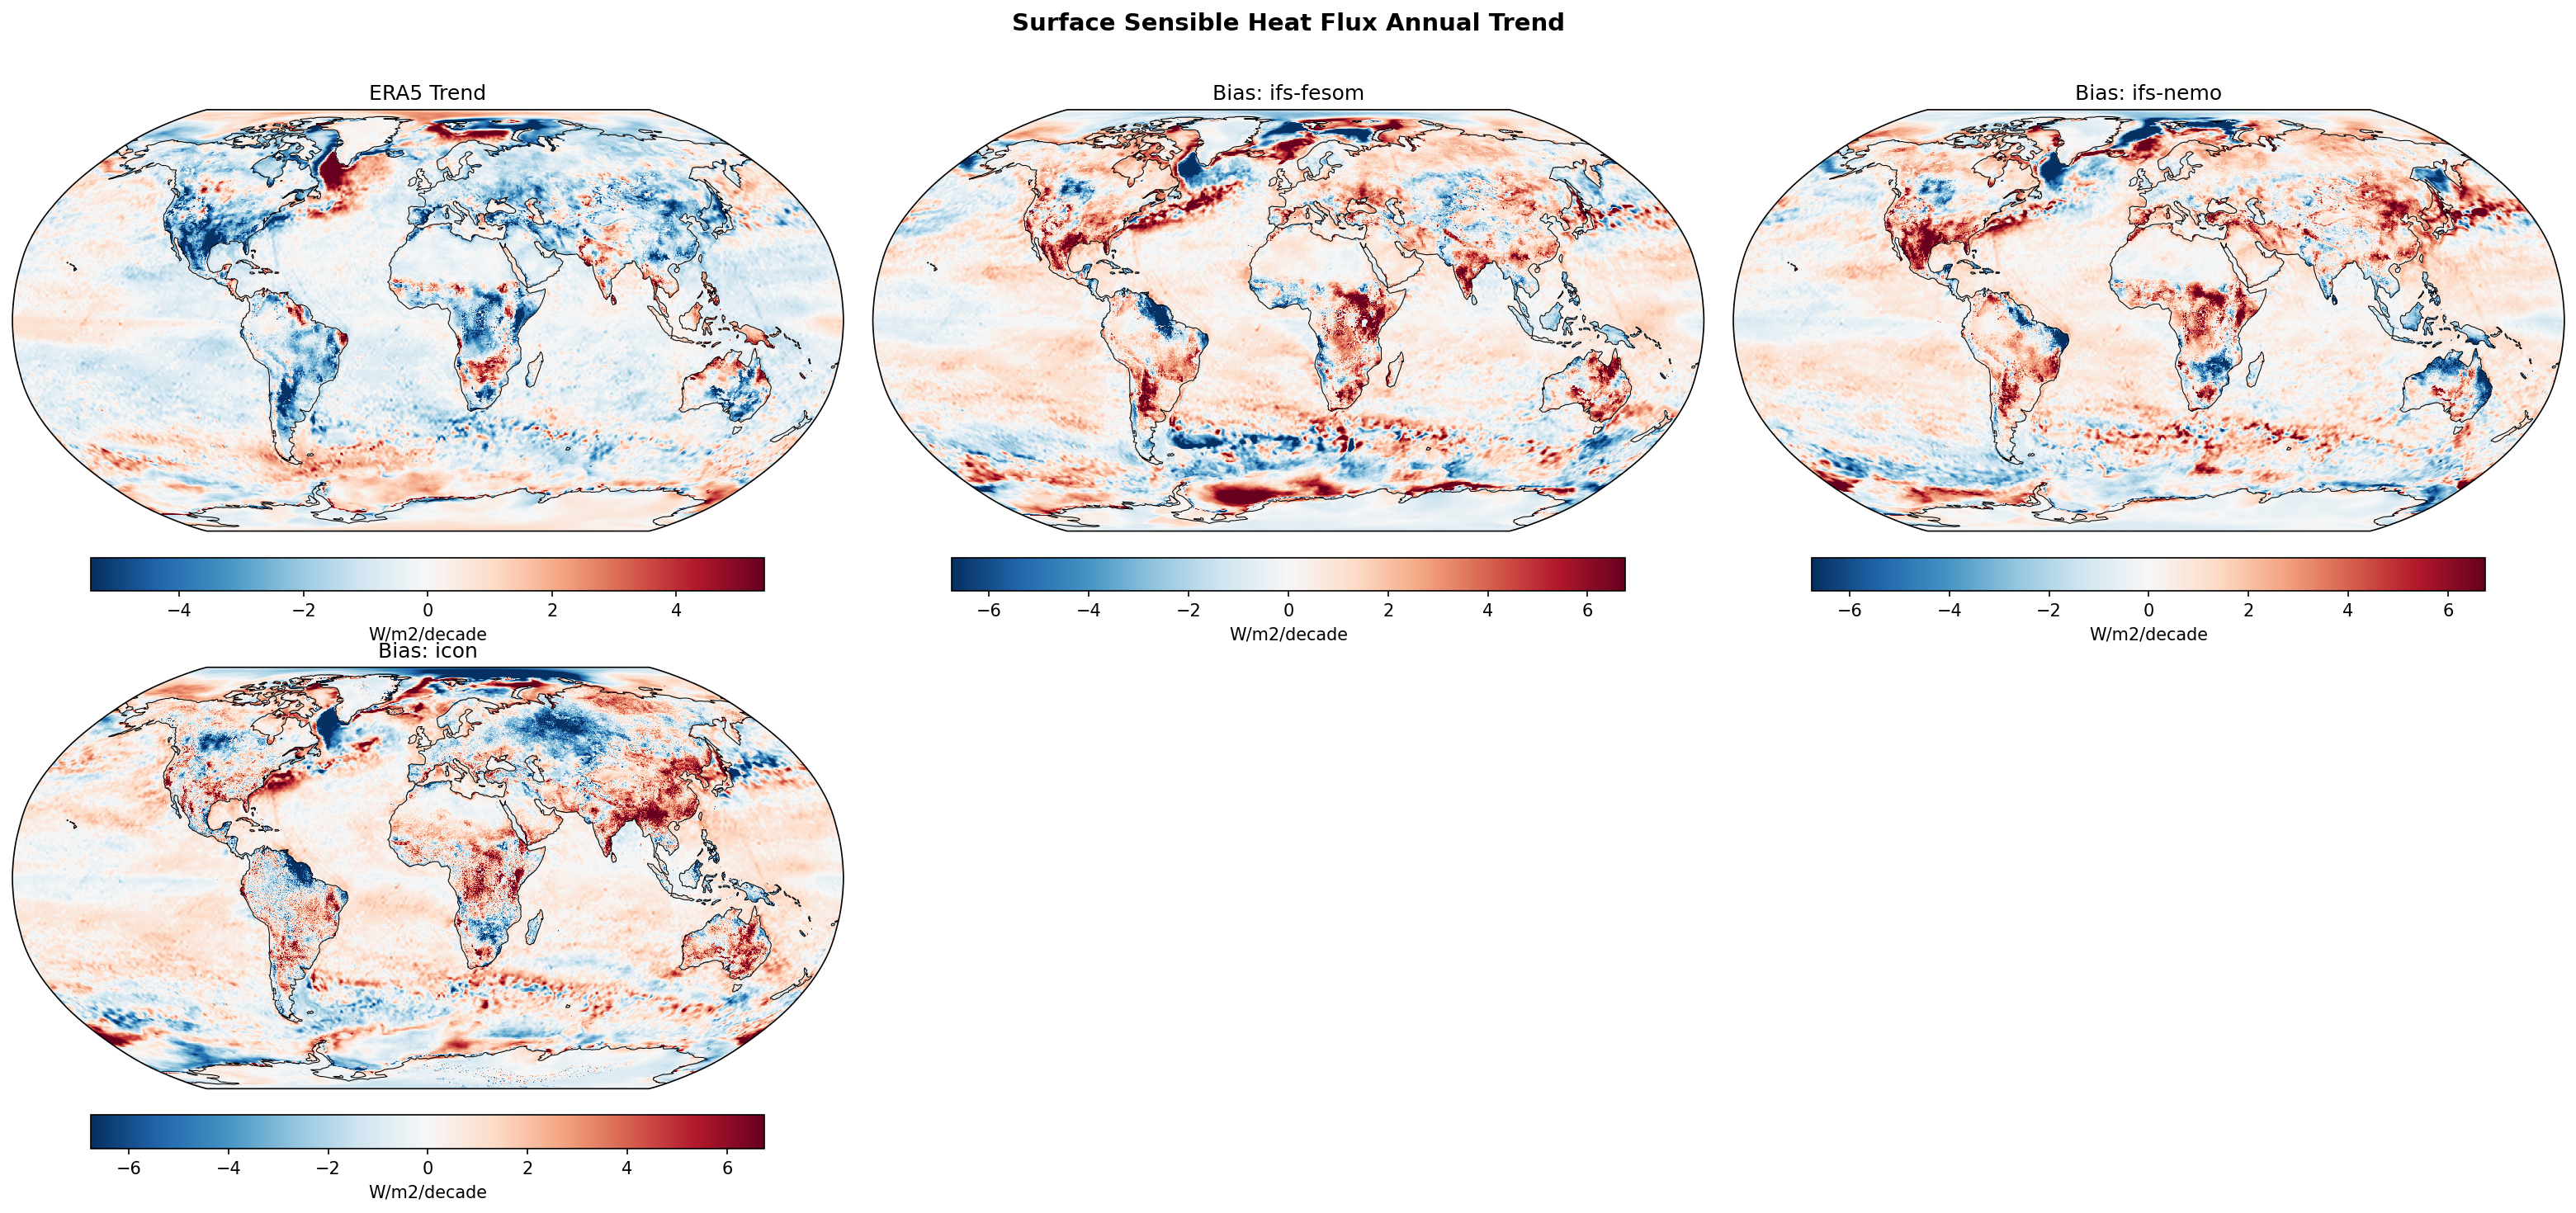
Surface Sensible Heat Flux Annual Linear Trend
| Variables | avg_ishf |
|---|---|
| Models | ifs-fesom, ifs-nemo, icon |
| Reference Dataset | ERA5 |
| Units | W/m2/decade |
| Period | 1990–2014 |
| ifs-fesom | Global Mean Trend: 0.07 · Global Mean Trend Diff: 0.45 · Trend Rmse: 2.07 |
| ifs-nemo | Global Mean Trend: 0.04 · Global Mean Trend Diff: 0.42 · Trend Rmse: 1.96 |
| icon | Global Mean Trend: -0.03 · Global Mean Trend Diff: 0.35 · Trend Rmse: 2.03 |
Summary medium
This figure displays annual linear trends in surface sensible heat flux (SSHF) for the period 1990–2014, comparing ERA5 reanalysis with three coupled models (IFS-FESOM, IFS-NEMO, ICON). The models exhibit systematic trend biases, generally overestimating the increase in sensible heat flux over land and underestimating the strong positive trend observed in the North Atlantic subpolar gyre.
Key Findings
- A prominent dipole bias exists in the North Atlantic: ERA5 shows a strong positive trend (increasing heat loss) south of Greenland which all models fail to capture, resulting in a widespread negative (blue) bias in that region.
- Over major land masses (North America, Amazonia, Central Africa), models consistently show a positive trend bias (red), indicating they simulate a greater increase in sensible heat flux (or weaker decrease) than observed in ERA5.
- IFS-FESOM and IFS-NEMO show remarkably similar bias patterns, suggesting that the atmospheric component (IFS) or land-surface coupling dominates the trend response over the ocean grid choice.
- ICON displays a unique negative trend bias over Scandinavia and Northern Europe, diverging from the IFS-based models in this region.
Spatial Patterns
ERA5 shows negative SSHF trends (blue) over much of North America, Siberia, and the Amazon, contrasting with a strong positive trend (red) in the North Atlantic subpolar gyre. The model bias maps (Model - Obs) are characterized by widespread positive values over global land surfaces (suggesting models favor higher SSHF over time) and strong negative values in the North Atlantic. Regional discrepancies also appear along sea-ice margins in the Southern Ocean.
Model Agreement
Inter-model agreement is high between IFS-FESOM and IFS-NEMO, which share almost identical spatial bias structures. ICON generally agrees with the IFS models on the broad land/ocean contrasts (positive land bias, negative North Atlantic bias) but differs in local details, such as over Europe. All models disagree with ERA5 regarding the sign and magnitude of the North Atlantic trend.
Physical Interpretation
The positive trend bias over land suggests the models may be partitioning more energy into sensible heat over the 1990–2014 period compared to ERA5, possibly due to a 'drying' bias (reduced latent heat) or stronger surface warming rates. The discrepancy in the North Atlantic is likely driven by the phase of internal variability (e.g., NAO, AMOC) in the short observational record—specifically, a period of increased convective heat loss in reality that free-running coupled models do not reproduce in phase.
Caveats
- The 25-year analysis period (1990–2014) is dominated by internal climate variability; trend differences likely reflect phase mismatches in modes like the AMO or PDO rather than structural model errors.
- Sign convention is assumed to be positive upwards (flux from surface to atmosphere) based on standard diagnostic usage; ERA5 positive trends in the North Atlantic imply increasing ocean heat loss.
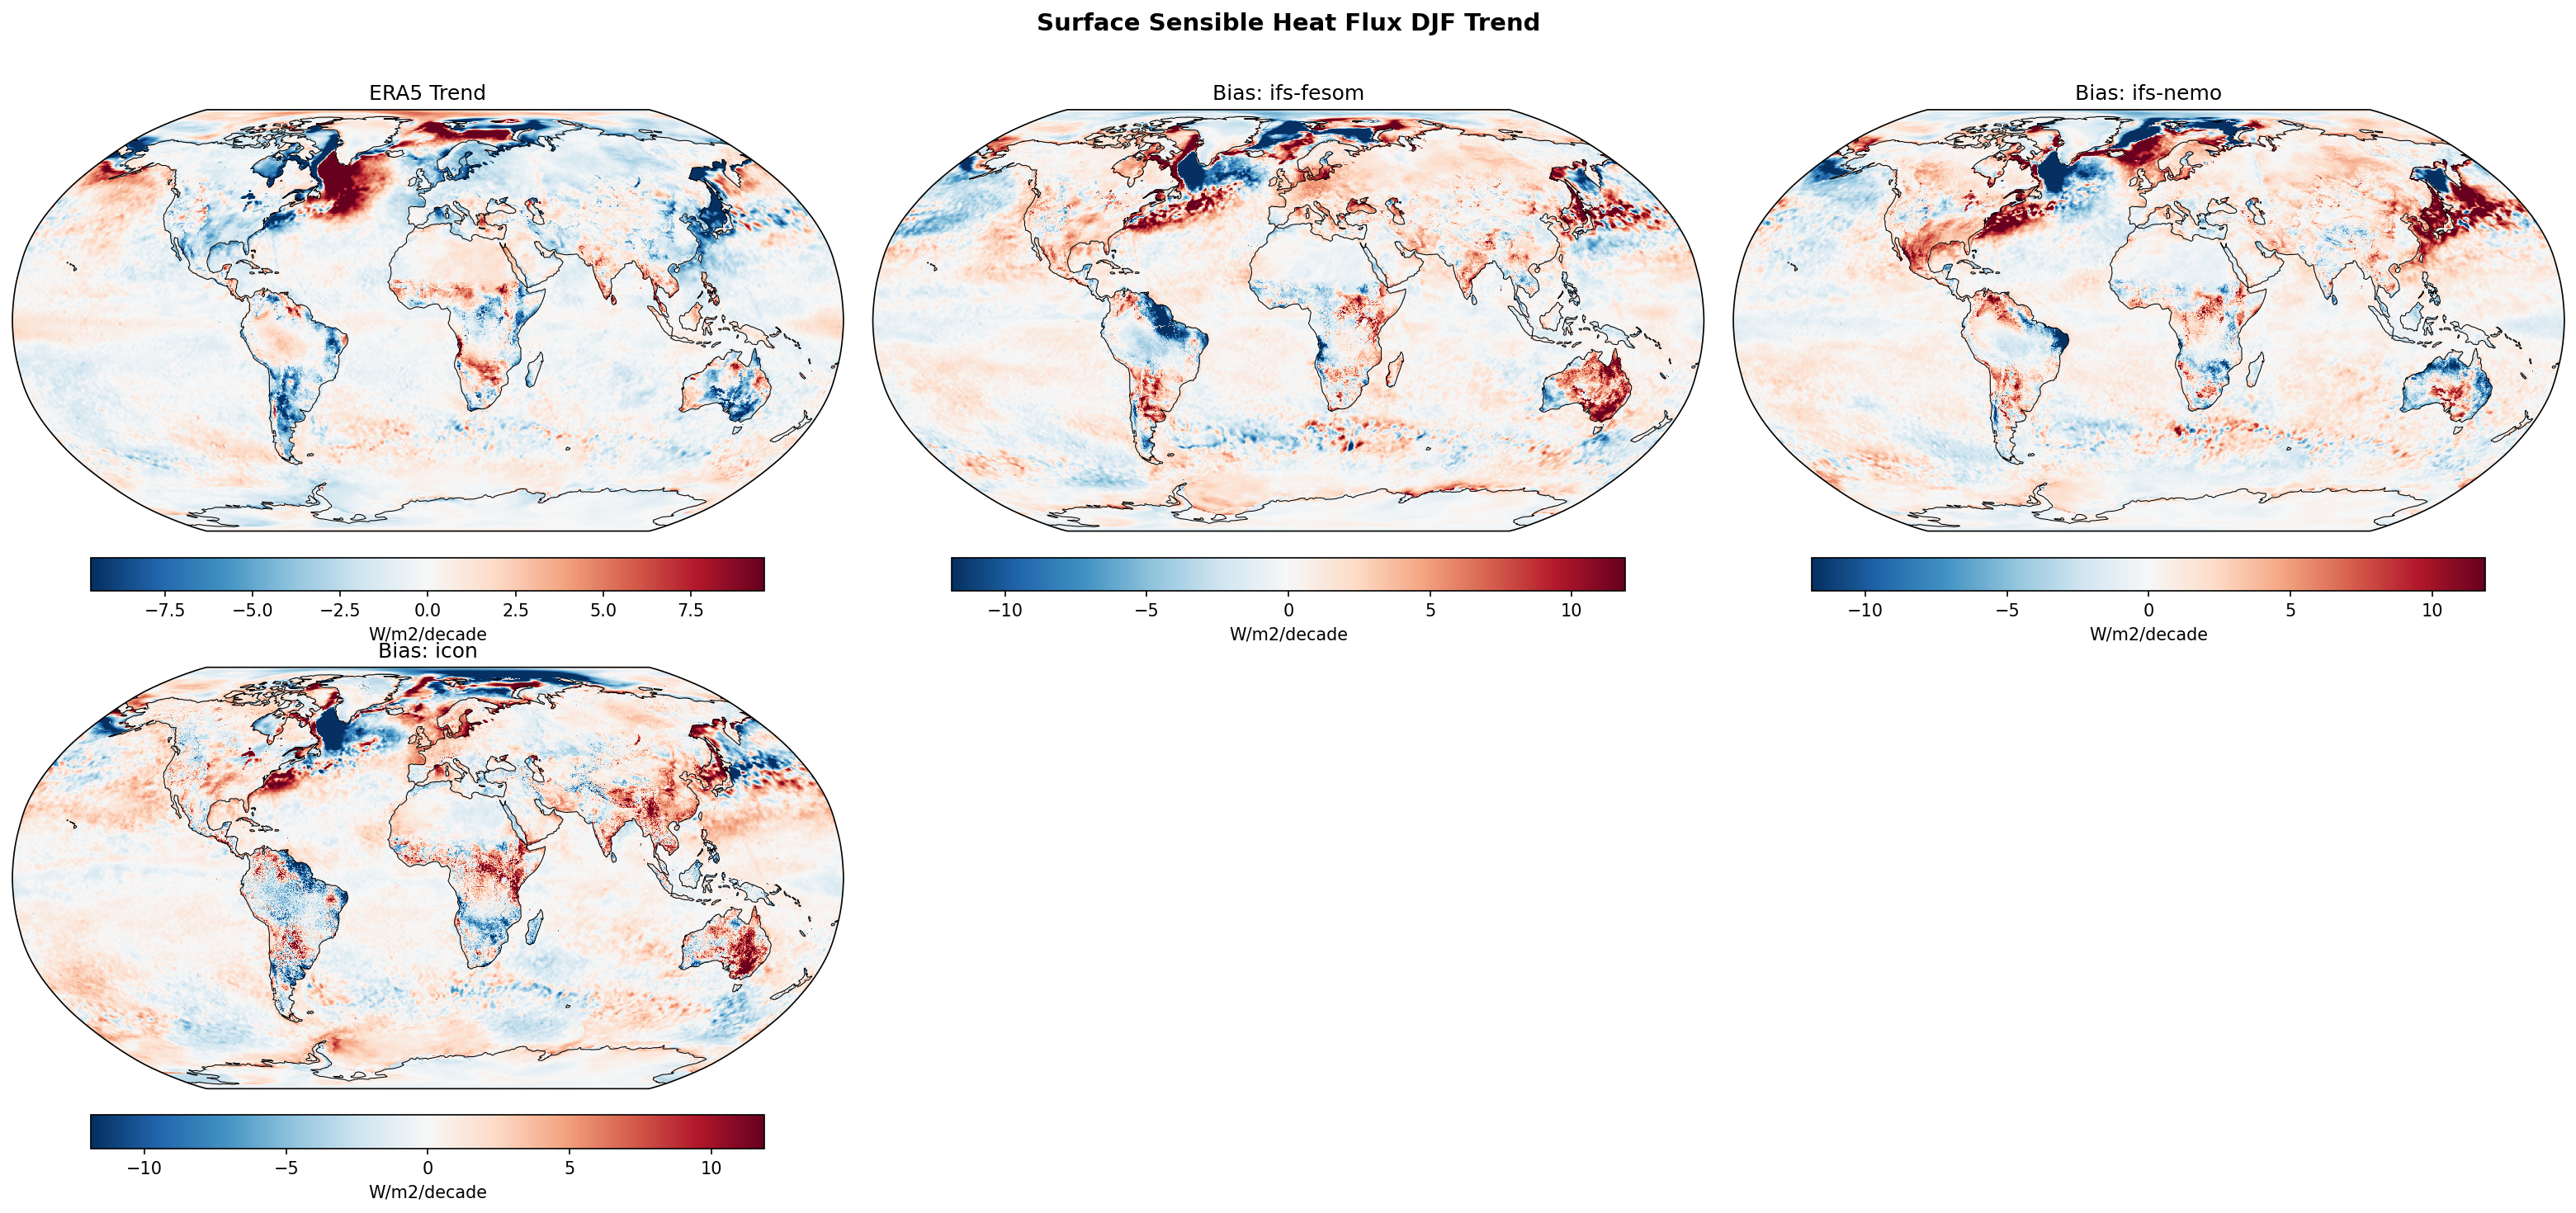
Surface Sensible Heat Flux DJF Linear Trend
| Variables | avg_ishf |
|---|---|
| Models | ifs-fesom, ifs-nemo, icon |
| Reference Dataset | ERA5 |
| Units | W/m2/decade |
| Period | 1990–2014 |
Summary high
The figure illustrates linear trends in Surface Sensible Heat Flux (SSHF) for DJF (1990–2014), comparing ERA5 reanalysis with three high-resolution DestinE models. While ERA5 shows distinct regions of increasing heat flux in the high-latitude North Atlantic and decreasing flux in the Western North Pacific, all three models exhibit systematic biases, most notably opposing the observed trends over Southern Hemisphere land masses and western boundary currents.
Key Findings
- Systematic Southern Hemisphere Land Bias: All models show a strong positive trend bias (red) over Australia, South America, and Southern Africa, implying they simulate increasing sensible heat flux (drying) where ERA5 shows decreasing trends.
- North Atlantic Dipole Mismatch: ERA5 displays a strong positive trend in SSHF in the subpolar North Atlantic; models underestimate this significantly (negative bias), while overestimating trends along the Gulf Stream path, creating a dipole bias pattern.
- Kuroshio Extension Discrepancy: In the North Pacific off Japan, ERA5 shows a negative trend in SSHF. Models exhibit a positive bias, indicating they simulate an increasing trend or fail to capture the observed reduction.
Spatial Patterns
The bias maps reveal distinct dipole structures associated with Western Boundary Currents (Gulf Stream, Kuroshio), likely due to shifts in current location or atmospheric circulation responses (NAO/PDO) over the 25-year period. Over land, the biases are continent-scale and coherent, particularly in the Southern Hemisphere summer (DJF).
Model Agreement
There is remarkably high agreement among the three models (IFS-FESOM, IFS-NEMO, ICON). The bias patterns are nearly identical spatially and in magnitude, suggesting that the discrepancies with ERA5 are driven by shared atmospheric forcings, common deficiencies in land-surface coupling, or the inherent difference between free-running simulations and data-assimilating reanalysis.
Physical Interpretation
The positive biases over SH land suggest the models may overestimate surface drying or underestimate precipitation trends in summer, shifting the Bowen ratio towards sensible heat. In the ocean, the strong dipoles in boundary current regions reflect the sensitivity of air-sea fluxes to the precise location of oceanic fronts and the overlying storm tracks; the mismatch suggests the free-running models did not replicate the specific phase of internal variability (e.g., NAO, AMV) present in the observed 1990–2014 record.
Caveats
- The analysis period (1990–2014) is relatively short (25 years), making trends highly susceptible to internal decadal variability (noise) rather than purely forced climate change signals.
- Free-running coupled models are not expected to reproduce the exact phase of historical internal variability (like ENSO or NAO) found in reanalysis, which likely explains the strong dynamic biases in the North Atlantic and Pacific.
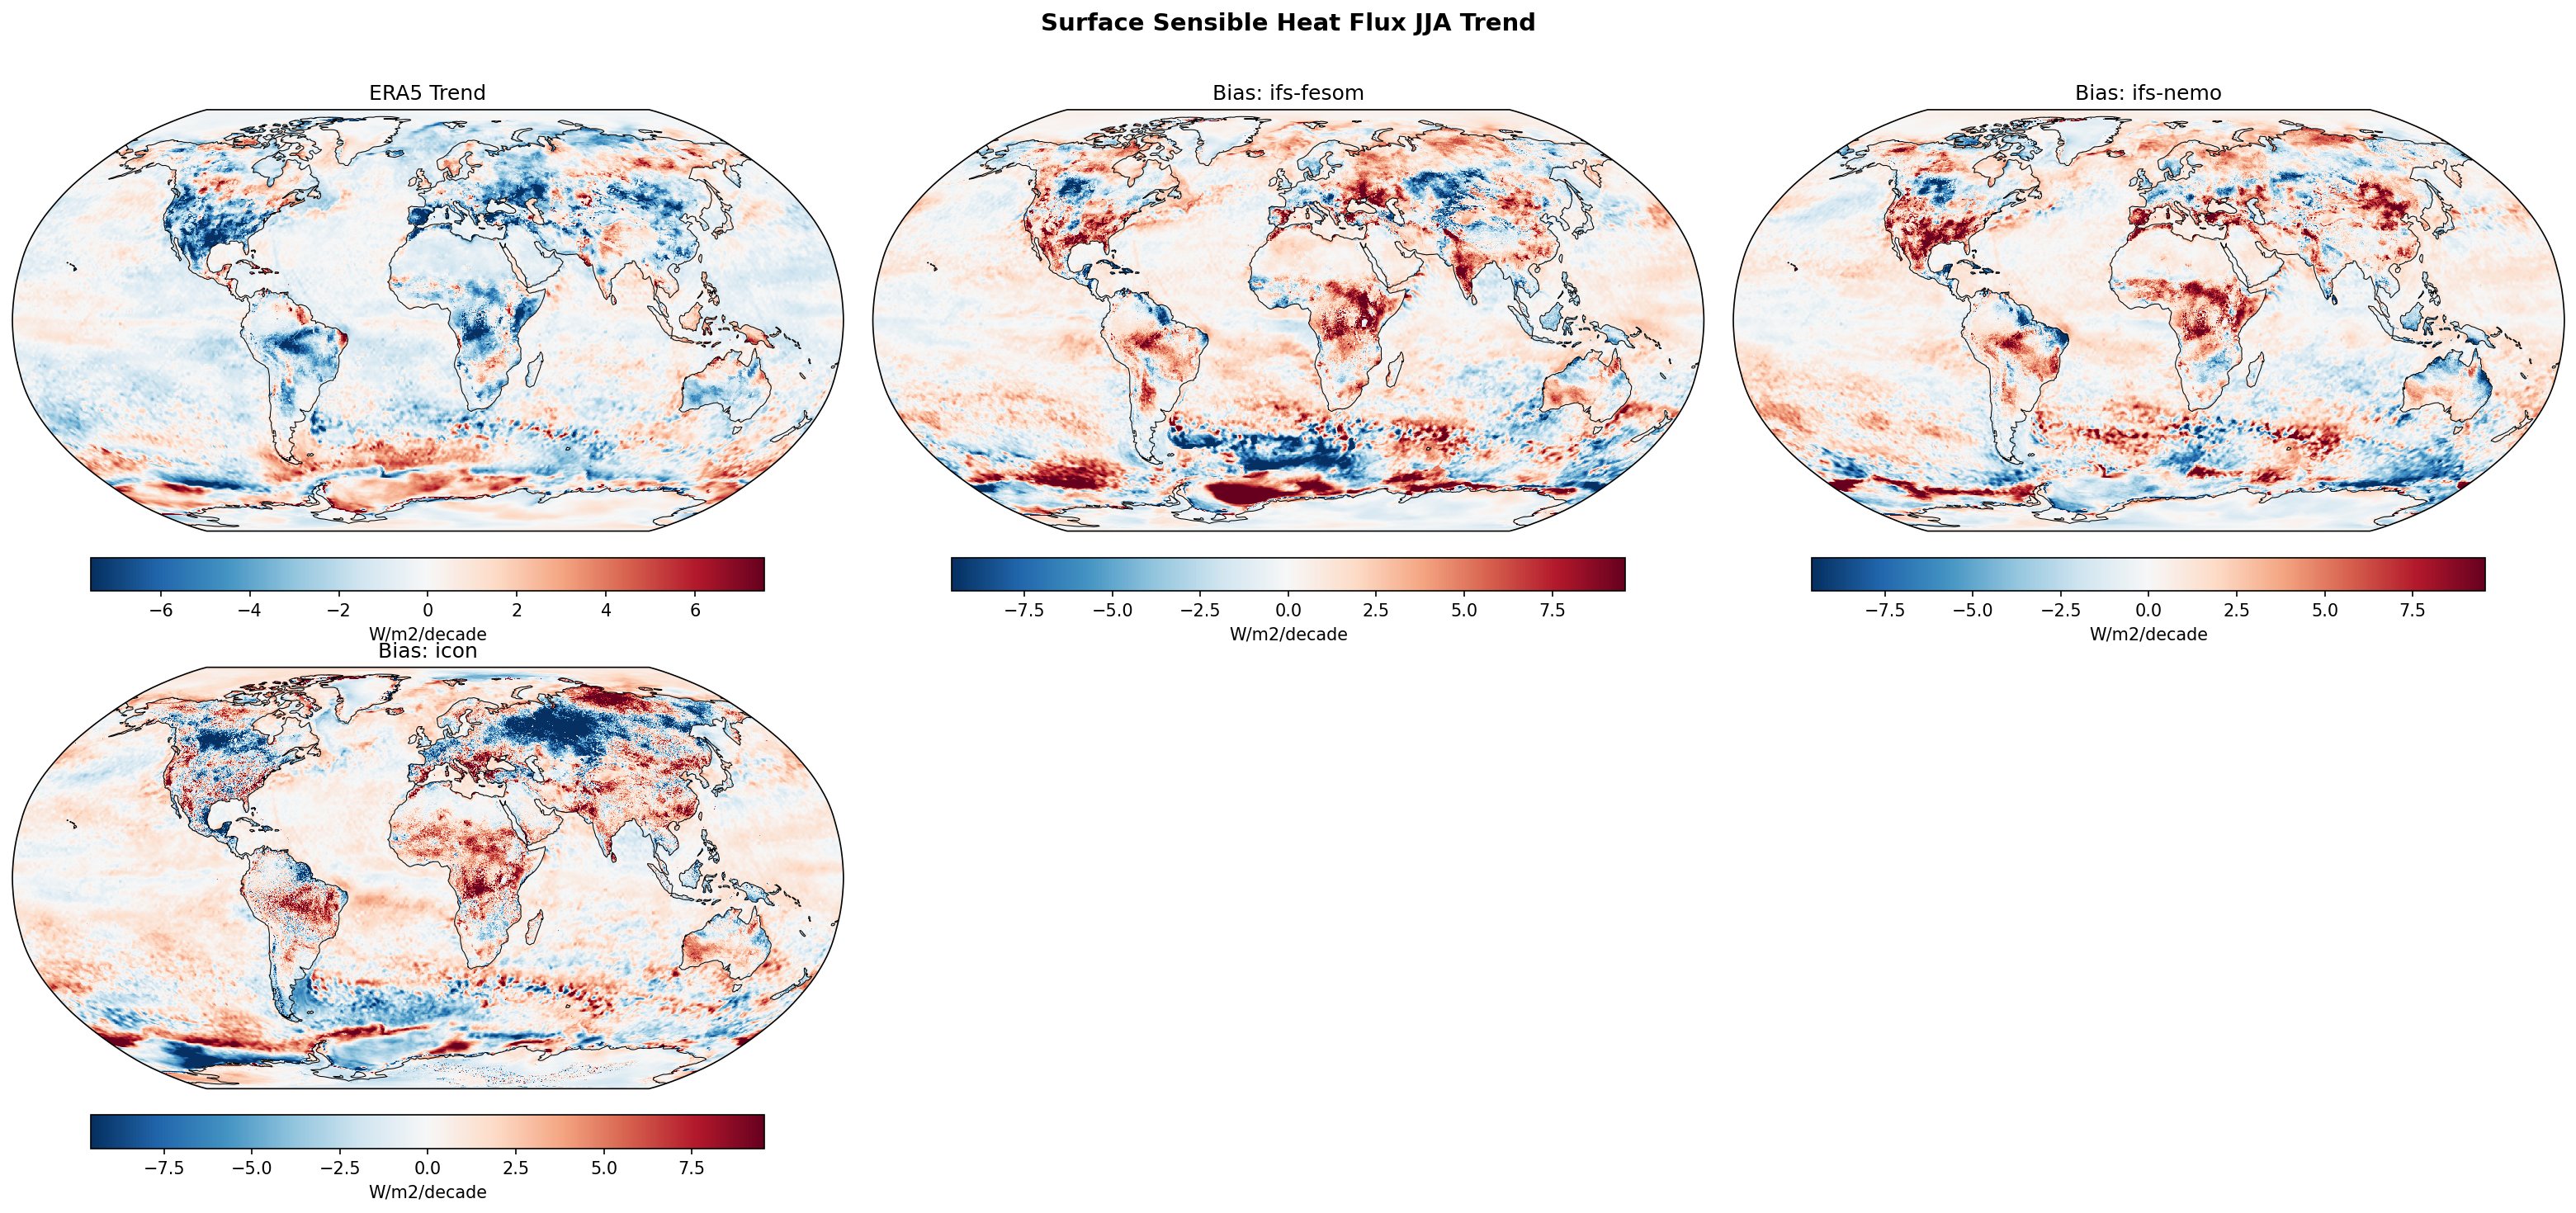
Surface Sensible Heat Flux JJA Linear Trend
| Variables | avg_ishf |
|---|---|
| Models | ifs-fesom, ifs-nemo, icon |
| Reference Dataset | ERA5 |
| Units | W/m2/decade |
| Period | 1990–2014 |
Summary high
This diagnostic evaluates JJA linear trends in Surface Sensible Heat Flux (SHF) from 1990–2014, comparing three high-resolution models against ERA5 reanalysis. The models exhibit widespread positive trend biases over major land masses, indicating they simulate increasing sensible heat flux in regions where ERA5 shows decreasing trends, suggesting discrepancies in land-atmosphere coupling or decadal hydroclimate variability.
Key Findings
- ERA5 displays negative JJA SHF trends (blue) over large portions of the central US, Europe, and Russia, indicating a decrease in sensible heat flux during this period.
- All three models (IFS-FESOM, IFS-NEMO, ICON) show strong positive biases (red) over North America, Europe, and the Amazon, implying they simulate an increase in SHF or fail to capture the observed decrease.
- IFS-FESOM and IFS-NEMO show nearly identical bias patterns over land, confirming that the atmospheric component (IFS) dominates the land surface response regardless of the ocean coupling.
- ICON diverges from the IFS models at high latitudes, showing strong negative biases (dark blue) over Northern Russia and Canada, contrasting with the positive biases seen in the IFS models.
Spatial Patterns
The most prominent pattern is the land-sea contrast in trend biases. Over mid-latitude land (US, Europe) and tropical land (Amazon, Africa), models consistently overestimate the SHF trend (red bias). In the Southern Ocean, complex dipole bias patterns appear, likely linked to sea ice edge dynamics. ICON specifically shows a strong negative trend bias in high northern latitudes (Siberia/Canada) not seen in IFS models.
Model Agreement
There is very high agreement between IFS-FESOM and IFS-NEMO, indicating robust atmospheric control over surface flux trends. ICON agrees with IFS on the sign of the bias in the tropics and mid-latitudes (positive bias) but disagrees significantly in the Arctic/Boreal regions, where it shows opposing negative biases.
Physical Interpretation
Sensible heat flux trends are closely coupled to surface moisture availability and temperature gradients. The negative trends in ERA5 over US/Europe likely reflect specific decadal variability (e.g., wetting or 'warming hole' phenomena) during 1990–2014. The models' positive biases suggest they simulate a canonical 'drying and warming' response (shifting energy partitioning toward sensible heat) that mismatches the specific realization of internal variability in the observations. The high-latitude differences in ICON suggests different snow cover or permafrost feedback parameterizations compared to IFS.
Caveats
- The analysis period (1990–2014) is relatively short (25 years), so trends are heavily influenced by internal decadal variability which free-running coupled models are not expected to phase-match with observations.
- ERA5 reanalysis itself relies on model physics for surface fluxes and is not a direct observation, introducing some uncertainty in the 'truth' reference.
Mean Sea Level Pressure Annual Linear Trend
| Variables | avg_msl |
|---|---|
| Models | ifs-fesom, ifs-nemo, icon, CMIP6 MMM, MPI-ESM1-2-LR/r1i1p1f1, GISS-E2-1-G/r1i1p1f2, IPSL-CM6A-LR/r1i1p1f1, ACCESS-ESM1-5/r1i1p1f1, EC-Earth3/r1i1p1f1, CNRM-CM6-1/r1i1p1f2, AWI-CM-1-1-MR/r1i1p1f1, CNRM-ESM2-1/r1i1p1f2, FGOALS-g3/r1i1p1f1, INM-CM5-0/r1i1p1f1, MRI-ESM2-0/r1i1p1f1 |
| Reference Dataset | ERA5 |
| Units | Pa/decade |
| Period | 1990–2014 |
| ifs-fesom | Global Mean Trend: -1.84 · Global Mean Trend Diff: -5.65 · Trend Rmse: 44.40 |
| ifs-nemo | Global Mean Trend: -1.31 · Global Mean Trend Diff: -5.12 · Trend Rmse: 47.80 |
| icon | Global Mean Trend: -1.64 · Global Mean Trend Diff: -5.45 · Trend Rmse: 41.96 |
| CMIP6 MMM | Global Mean Trend Diff: -4.43 · Trend Rmse: 38.58 |
| MPI-ESM1-2-LR/r1i1p1f1 | Global Mean Trend Diff: -5.05 · Trend Rmse: 44.42 |
| GISS-E2-1-G/r1i1p1f2 | Global Mean Trend Diff: -5.99 · Trend Rmse: 45.43 |
| IPSL-CM6A-LR/r1i1p1f1 | Global Mean Trend Diff: -6.54 · Trend Rmse: 46.48 |
| ACCESS-ESM1-5/r1i1p1f1 | Global Mean Trend Diff: -2.17 · Trend Rmse: 48.78 |
| EC-Earth3/r1i1p1f1 | Global Mean Trend Diff: 0.23 · Trend Rmse: 47.44 |
| CNRM-CM6-1/r1i1p1f2 | Global Mean Trend Diff: -3.62 · Trend Rmse: 48.93 |
| AWI-CM-1-1-MR/r1i1p1f1 | Global Mean Trend Diff: -6.16 · Trend Rmse: 48.40 |
| CNRM-ESM2-1/r1i1p1f2 | Global Mean Trend Diff: -1.23 · Trend Rmse: 43.49 |
| FGOALS-g3/r1i1p1f1 | Global Mean Trend Diff: -6.33 · Trend Rmse: 47.84 |
| INM-CM5-0/r1i1p1f1 | Global Mean Trend Diff: -6.12 · Trend Rmse: 47.20 |
| MRI-ESM2-0/r1i1p1f1 | Global Mean Trend Diff: -5.71 · Trend Rmse: 48.71 |
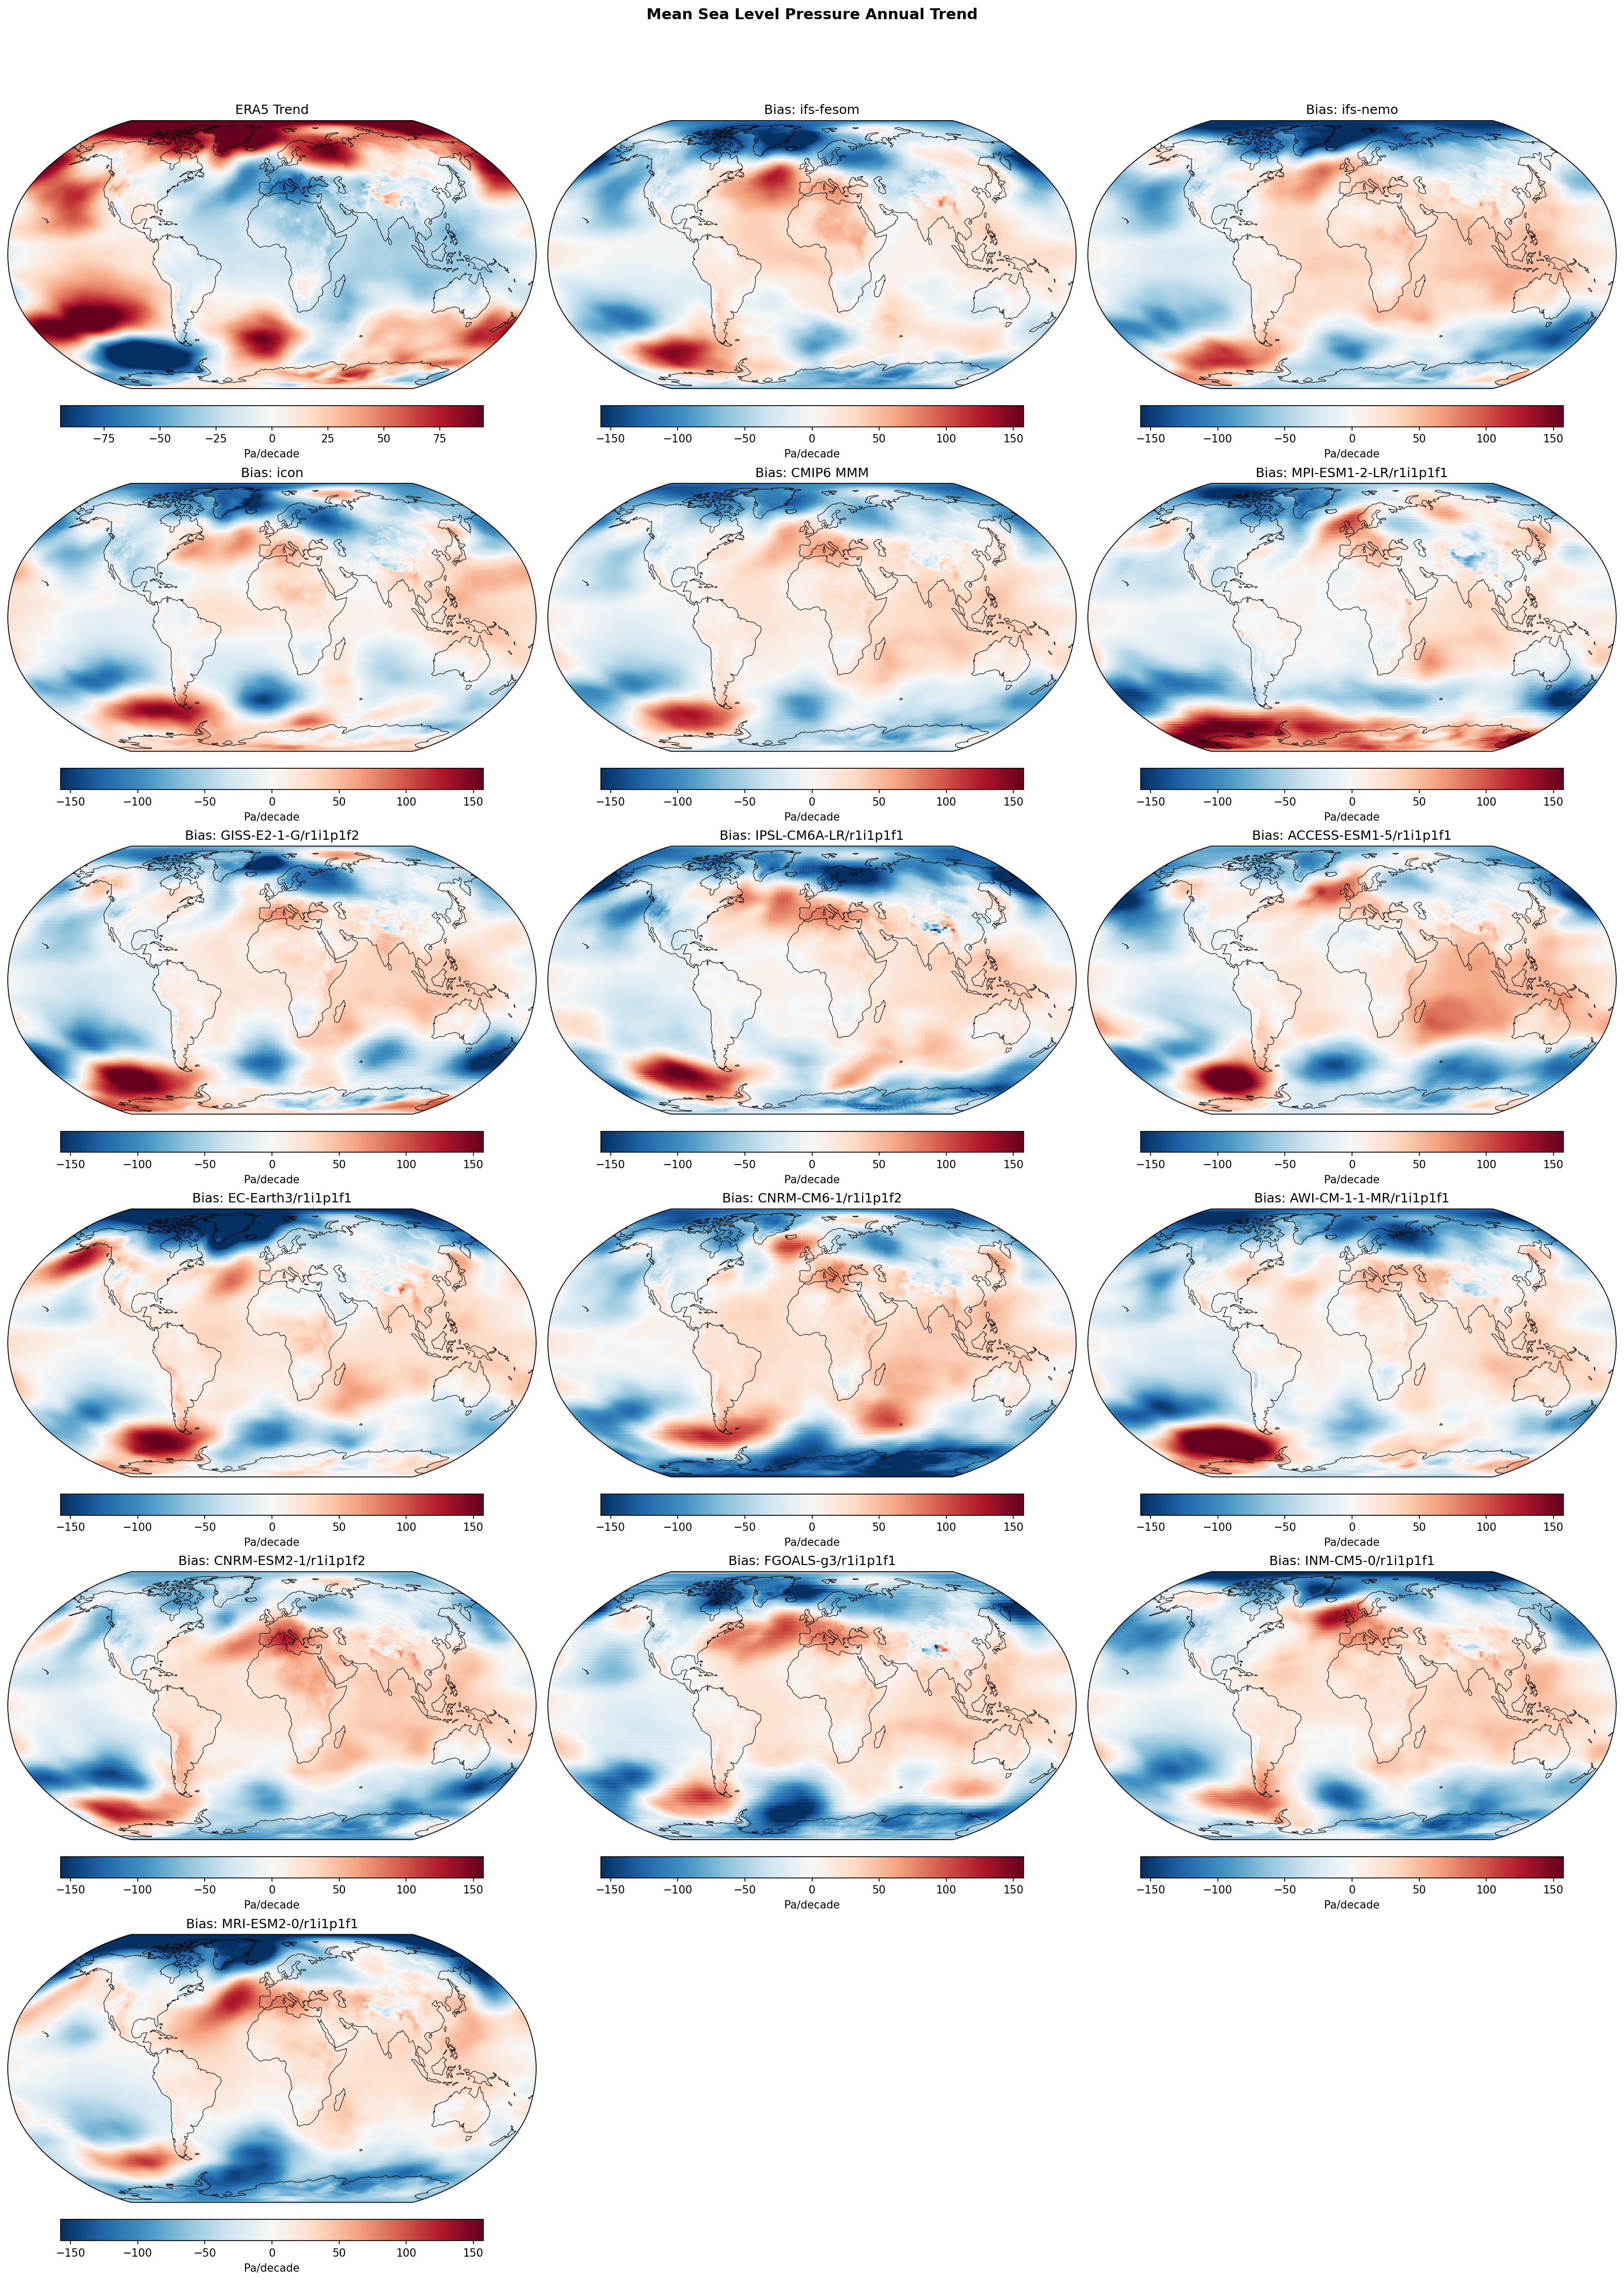
Summary high
This figure evaluates annual linear trends in Mean Sea Level Pressure (MSLP) for the period 1990–2014, comparing three high-resolution DestinE models (IFS-FESOM, IFS-NEMO, ICON) and a suite of CMIP6 models against ERA5 reanalysis. The maps reveal significant spatial discrepancies between modeled and observed trends, primarily driven by the dominance of internal climate variability over such a short (25-year) analysis period.
Key Findings
- **Internal Variability Dominance:** The large magnitude of trend differences (RMSE > 40 Pa/decade for individual models) indicates that 25-year MSLP trends are heavily influenced by internal variability (e.g., phases of SAM, NAO, IPO) rather than a uniform forced signal. Individual free-running models are not expected to phase-match historical internal variability.
- **Southern Hemisphere Discrepancy:** A prominent systematic difference appears in the Southern Ocean, particularly the Amundsen-Bellingshausen Sea sector. ERA5 shows a strong deepening trend (negative, blue) in the Amundsen Sea Low, while most models (both DestinE and CMIP6) exhibit a positive trend bias (red), indicating they fail to capture the magnitude or location of this deepening.
- **Model Performance Ranking:** Among the DestinE prototypes, ICON demonstrates the lowest trend RMSE (42.0 Pa/decade), outperforming IFS-FESOM (44.4) and IFS-NEMO (47.8). ICON's performance is comparable to the better individual CMIP6 models and approaches the CMIP6 Multi-Model Mean (38.6), suggesting a robust representation of circulation statistics.
Spatial Patterns
The observation panel (ERA5) is characterized by a dipole in the Southern Hemisphere trends (deepening Amundsen Sea Low, increasing pressure south of Australia) and variable patterns in the Northern Hemisphere. The bias panels (Model - Obs trend) consistently show a 'red' positive bias over the Amundsen Sea sector and a 'blue' negative bias in the Indian Ocean sector for almost all models. This suggests a systematic mismatch in the trend of the Southern Annular Mode (SAM) or zonal wave-3 patterns.
Model Agreement
Inter-model agreement on specific regional trends is low, which is typical for unconstrained coupled simulations over decadal timescales. However, the models agree on the 'error' pattern in the Southern Hemisphere, suggesting a common difficulty in reproducing the observed deepening of the Amundsen Sea Low. The CMIP6 Multi-Model Mean has the lowest RMSE, confirming that averaging ensembles suppresses internal noise to better isolate the weaker forced signal.
Physical Interpretation
The observed trends are largely driven by specific phases of decadal internal variability (e.g., the Interdecadal Pacific Oscillation's influence on the Amundsen Sea Low) combined with forced responses (e.g., ozone depletion acting on SAM). Since the models are free-running and not nudged to observed meteorology, they generate their own random phases of internal variability. The mismatch is therefore a representation of chaotic divergence rather than purely model physics errors, although the systematic nature of the SH bias across many models could imply a common underestimation of dynamic sensitivity to forcing (e.g., ozone).
Caveats
- The 25-year analysis period (1990–2014) is climatologically short; trends are dominated by multidecadal internal variability, making direct comparison of spatial patterns a test of chance (variability phase) as much as model fidelity.
- Global mean MSLP trends must be near zero due to mass conservation; residual non-zero global means in the statistics likely reflect minor numerical drifts or water vapor mass changes.
Mean Sea Level Pressure DJF Linear Trend
| Variables | avg_msl |
|---|---|
| Models | ifs-fesom, ifs-nemo, icon, CMIP6 MMM, MPI-ESM1-2-LR/r1i1p1f1, GISS-E2-1-G/r1i1p1f2, IPSL-CM6A-LR/r1i1p1f1, ACCESS-ESM1-5/r1i1p1f1, EC-Earth3/r1i1p1f1, CNRM-CM6-1/r1i1p1f2, AWI-CM-1-1-MR/r1i1p1f1, CNRM-ESM2-1/r1i1p1f2, FGOALS-g3/r1i1p1f1, INM-CM5-0/r1i1p1f1, MRI-ESM2-0/r1i1p1f1 |
| Reference Dataset | ERA5 |
| Units | Pa/decade |
| Period | 1990–2014 |
| CMIP6 MMM | Global Mean Trend Diff: -4.89 · Trend Rmse: None |
| MPI-ESM1-2-LR/r1i1p1f1 | Global Mean Trend Diff: -4.24 · Trend Rmse: None |
| GISS-E2-1-G/r1i1p1f2 | Global Mean Trend Diff: -5.52 · Trend Rmse: None |
| IPSL-CM6A-LR/r1i1p1f1 | Global Mean Trend Diff: -6.86 · Trend Rmse: None |
| ACCESS-ESM1-5/r1i1p1f1 | Global Mean Trend Diff: -2.68 · Trend Rmse: None |
| EC-Earth3/r1i1p1f1 | Global Mean Trend Diff: -1.99 · Trend Rmse: None |
| CNRM-CM6-1/r1i1p1f2 | Global Mean Trend Diff: -4.69 · Trend Rmse: None |
| AWI-CM-1-1-MR/r1i1p1f1 | Global Mean Trend Diff: -5.54 · Trend Rmse: None |
| CNRM-ESM2-1/r1i1p1f2 | Global Mean Trend Diff: -2.92 · Trend Rmse: None |
| FGOALS-g3/r1i1p1f1 | Global Mean Trend Diff: -6.37 · Trend Rmse: None |
| INM-CM5-0/r1i1p1f1 | Global Mean Trend Diff: -6.67 · Trend Rmse: None |
| MRI-ESM2-0/r1i1p1f1 | Global Mean Trend Diff: -6.23 · Trend Rmse: None |
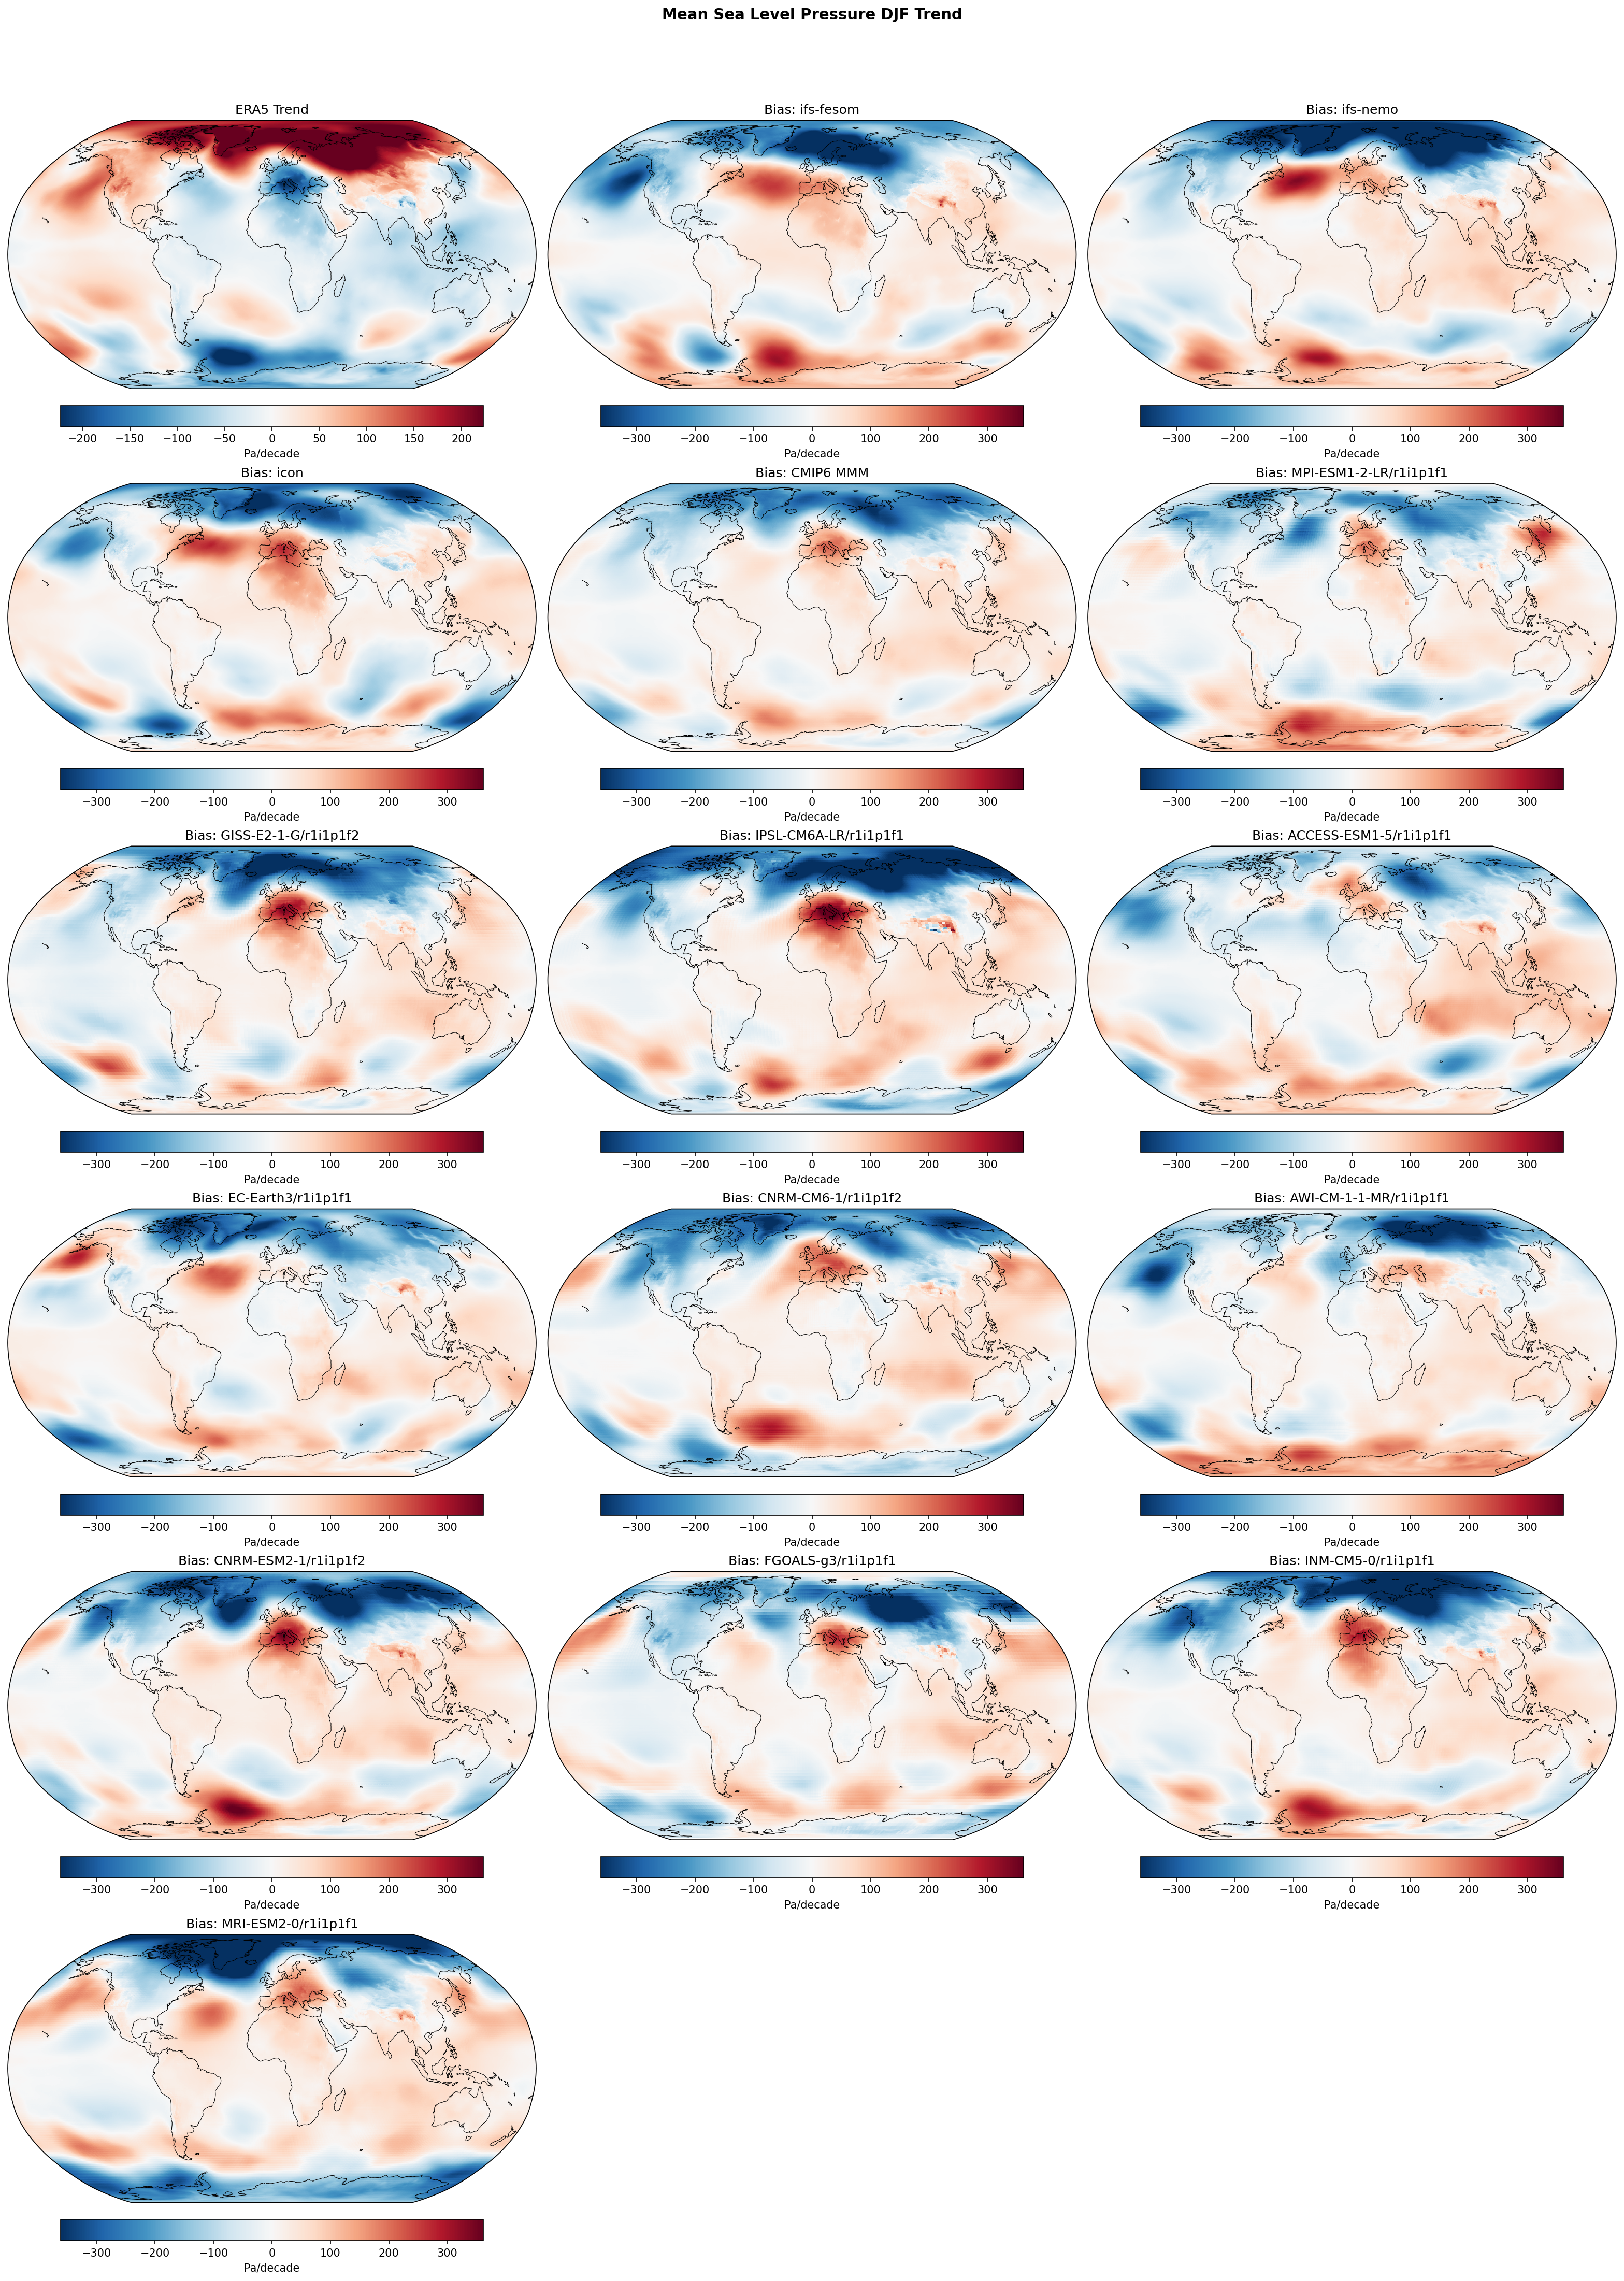
Summary high
This figure compares linear trends in Northern Hemisphere winter (DJF) Mean Sea Level Pressure (MSLP) over the period 1990–2014 between ERA5 observations and three high-resolution DestinE models (plus CMIP6 context). It highlights significant discrepancies in regional trend patterns, particularly in the North Atlantic and North Pacific sectors.
Key Findings
- ERA5 observations show positive MSLP trends over the North Atlantic and North Pacific, with negative trends over the Arctic and Southern Ocean.
- DestinE models diverge significantly in the North Atlantic: 'ifs-fesom' exhibits a negative trend bias (underestimating the observed pressure increase), while 'ifs-nemo' and 'icon' show positive trend biases (overestimating it).
- A systematic negative trend bias exists across most models (DestinE and CMIP6) in the North Pacific, indicating a failure to capture the magnitude of the observed positive pressure trend (weakening of the Aleutian Low) during this period.
Spatial Patterns
The observation panel (top-left) is characterized by a wave-number 2 pattern with pressure increases in the mid-latitude ocean basins and decreases in the polar regions. Model bias maps generally show a 'blue-high-latitude / red-low-latitude' zonal structure, implying models simulate a stronger deepening of polar lows or weaker subtropical highs than observed. However, 'icon' and 'ifs-nemo' break this pattern with strong positive biases (red) centered over Europe and the North Atlantic.
Model Agreement
Inter-model agreement is low regarding regional trends. 'ifs-fesom' aligns more closely with the CMIP6 Multi-Model Mean pattern (negative bias in N. Atlantic), whereas 'icon' is an outlier with intense positive trend biases over Eurasia. The spread among high-resolution models is comparable to the spread seen within the CMIP6 ensemble.
Physical Interpretation
The large trend biases and inter-model spread are likely driven by unforced internal climate variability (e.g., NAO, PDO phases). Over a short 25-year period (1990–2014), free-running coupled models are not expected to phase-lock with the specific realization of internal variability seen in observations. Thus, the 'biases' largely represent mismatches in decadal variability phases rather than systematic errors in model physics or resolution.
Caveats
- The 25-year analysis period is relatively short, making linear trends highly sensitive to internal variability noise versus forced signal.
- Trend differences in free-running simulations should not be interpreted strictly as model errors without ensemble averaging to suppress internal variability.
Mean Sea Level Pressure JJA Linear Trend
| Variables | avg_msl |
|---|---|
| Models | ifs-fesom, ifs-nemo, icon, CMIP6 MMM, MPI-ESM1-2-LR/r1i1p1f1, GISS-E2-1-G/r1i1p1f2, IPSL-CM6A-LR/r1i1p1f1, ACCESS-ESM1-5/r1i1p1f1, EC-Earth3/r1i1p1f1, CNRM-CM6-1/r1i1p1f2, AWI-CM-1-1-MR/r1i1p1f1, CNRM-ESM2-1/r1i1p1f2, FGOALS-g3/r1i1p1f1, INM-CM5-0/r1i1p1f1, MRI-ESM2-0/r1i1p1f1 |
| Reference Dataset | ERA5 |
| Units | Pa/decade |
| Period | 1990–2014 |
| CMIP6 MMM | Global Mean Trend Diff: -4.56 · Trend Rmse: None |
| MPI-ESM1-2-LR/r1i1p1f1 | Global Mean Trend Diff: -6.07 · Trend Rmse: None |
| GISS-E2-1-G/r1i1p1f2 | Global Mean Trend Diff: -6.68 · Trend Rmse: None |
| IPSL-CM6A-LR/r1i1p1f1 | Global Mean Trend Diff: -7.27 · Trend Rmse: None |
| ACCESS-ESM1-5/r1i1p1f1 | Global Mean Trend Diff: -1.13 · Trend Rmse: None |
| EC-Earth3/r1i1p1f1 | Global Mean Trend Diff: 0.87 · Trend Rmse: None |
| CNRM-CM6-1/r1i1p1f2 | Global Mean Trend Diff: -3.03 · Trend Rmse: None |
| AWI-CM-1-1-MR/r1i1p1f1 | Global Mean Trend Diff: -6.60 · Trend Rmse: None |
| CNRM-ESM2-1/r1i1p1f2 | Global Mean Trend Diff: -0.88 · Trend Rmse: None |
| FGOALS-g3/r1i1p1f1 | Global Mean Trend Diff: -6.27 · Trend Rmse: None |
| INM-CM5-0/r1i1p1f1 | Global Mean Trend Diff: -6.20 · Trend Rmse: None |
| MRI-ESM2-0/r1i1p1f1 | Global Mean Trend Diff: -6.80 · Trend Rmse: None |
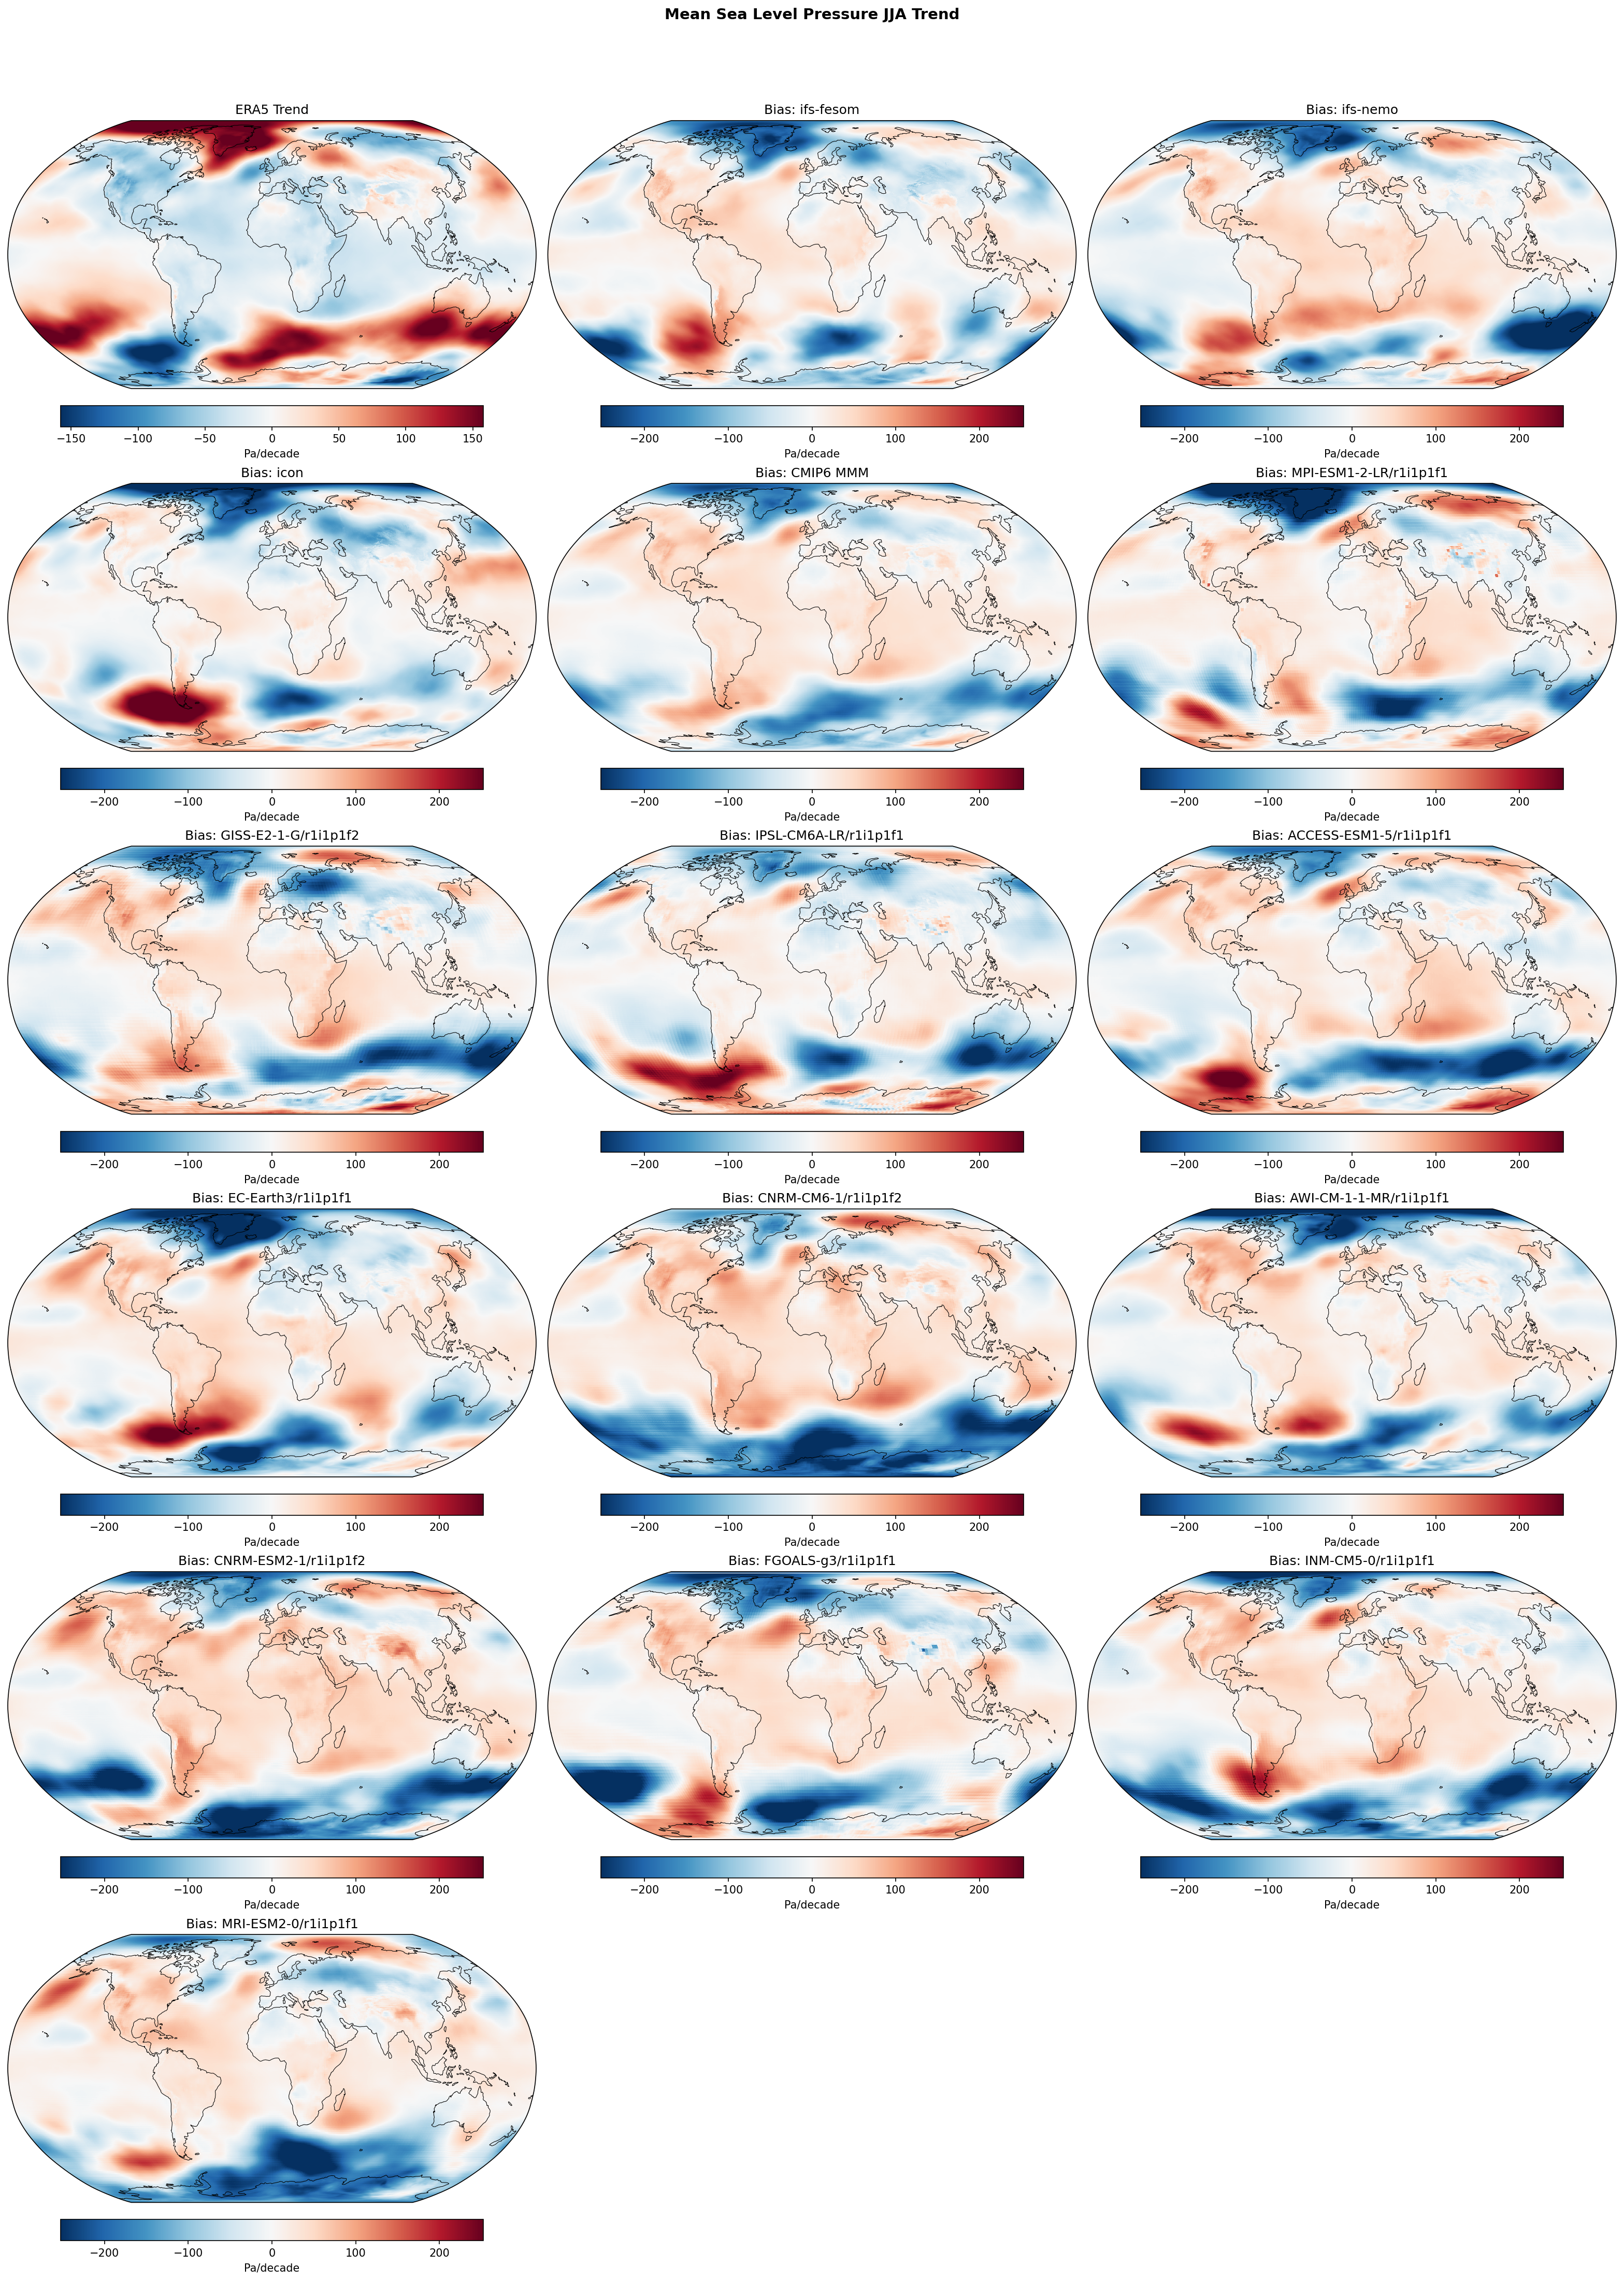
Summary high
This figure evaluates the linear trend in June-August (JJA) Mean Sea Level Pressure (MSLP) over the period 1990–2014, comparing ERA5 observations against DestinE prototypes (IFS-FESOM, IFS-NEMO, ICON) and a suite of CMIP6 models.
Key Findings
- ERA5 displays a strong dipole trend in the Southern Hemisphere (SH) extratropics, with increasing pressure south of New Zealand and decreasing pressure in the Amundsen-Bellingshausen Sea sector.
- Both DestinE and CMIP6 models exhibit large spatial trend biases (differences >200 Pa/decade) in the SH, often mirroring the observational pattern with opposite sign (e.g., negative bias where observations show positive trends).
- IFS-FESOM and IFS-NEMO show nearly identical bias patterns, indicating that the atmospheric component (IFS) determines the circulation trend response regardless of the ocean coupling (FESOM vs NEMO).
Spatial Patterns
The dominant feature is the high-amplitude wave-like trend pattern in the observed Southern Hemisphere high latitudes (Southern Annular Mode/Pacific-South American pattern variability). The bias maps for almost all models are dominated by the inverse of this pattern, suggesting the models have weak or spatially incoherent trends in these regions compared to the strong observed signal.
Model Agreement
There is strong intra-family agreement between IFS-FESOM and IFS-NEMO. ICON shows distinct regional differences, particularly in the southern Indian Ocean sector. In the Northern Hemisphere, biases are generally smaller in magnitude but still spatially incoherent across models. The CMIP6 Multi-Model Mean (MMM) shows much smoother biases, as random internal variability cancels out, whereas individual DestinE simulations behave like individual CMIP6 ensemble members with high internal variability.
Physical Interpretation
The large 'biases' in MSLP trends are primarily a signature of unforced internal climate variability rather than systematic model error. The 25-year period (1990–2014) is too short to separate the forced climate response from multi-decadal variability modes (like the Interdecadal Pacific Oscillation or Southern Annular Mode). The models, being free-running coupled simulations, generate their own independent phases of internal variability which do not synchronize with the specific realization of history captured by ERA5.
Caveats
- The 1990–2014 analysis period is dominated by internal variability for circulation metrics; trend differences should not be interpreted as model structural deficiencies.
- Bias magnitudes are comparable to the trend signals themselves, confirming low signal-to-noise ratio in circulation trends over this timeframe.
Surface Downwelling Longwave Annual Linear Trend
| Variables | avg_sdlwrf |
|---|---|
| Models | ifs-fesom, ifs-nemo, icon, CMIP6 MMM, MPI-ESM1-2-LR/r1i1p1f1, GISS-E2-1-G/r1i1p1f2, IPSL-CM6A-LR/r1i1p1f1, ACCESS-ESM1-5/r1i1p1f1, EC-Earth3/r1i1p1f1, CNRM-CM6-1/r1i1p1f2, AWI-CM-1-1-MR/r1i1p1f1, CNRM-ESM2-1/r1i1p1f2, FGOALS-g3/r1i1p1f1, INM-CM5-0/r1i1p1f1, MRI-ESM2-0/r1i1p1f1 |
| Reference Dataset | ERA5 |
| Units | W/m2/decade |
| Period | 1990–2014 |
| ifs-fesom | Global Mean Trend: 1.36 · Global Mean Trend Diff: 0.41 · Trend Rmse: 1.64 |
| ifs-nemo | Global Mean Trend: 1.35 · Global Mean Trend Diff: 0.40 · Trend Rmse: 1.68 |
| icon | Global Mean Trend: 1.34 · Global Mean Trend Diff: 0.39 · Trend Rmse: 1.64 |
| CMIP6 MMM | Global Mean Trend Diff: 0.96 · Trend Rmse: 1.63 |
| MPI-ESM1-2-LR/r1i1p1f1 | Global Mean Trend Diff: 0.37 · Trend Rmse: 1.54 |
| GISS-E2-1-G/r1i1p1f2 | Global Mean Trend Diff: 0.75 · Trend Rmse: 1.87 |
| IPSL-CM6A-LR/r1i1p1f1 | Global Mean Trend Diff: 1.06 · Trend Rmse: 2.11 |
| ACCESS-ESM1-5/r1i1p1f1 | Global Mean Trend Diff: 1.56 · Trend Rmse: 2.45 |
| EC-Earth3/r1i1p1f1 | Global Mean Trend Diff: 2.16 · Trend Rmse: 2.85 |
| CNRM-CM6-1/r1i1p1f2 | Global Mean Trend Diff: 0.28 · Trend Rmse: 1.85 |
| AWI-CM-1-1-MR/r1i1p1f1 | Global Mean Trend Diff: 1.11 · Trend Rmse: 1.90 |
| CNRM-ESM2-1/r1i1p1f2 | Global Mean Trend Diff: 0.86 · Trend Rmse: 1.68 |
| FGOALS-g3/r1i1p1f1 | Global Mean Trend Diff: 1.10 · Trend Rmse: 2.06 |
| INM-CM5-0/r1i1p1f1 | Global Mean Trend Diff: 0.50 · Trend Rmse: 1.69 |
| MRI-ESM2-0/r1i1p1f1 | Global Mean Trend Diff: 0.82 · Trend Rmse: 1.76 |
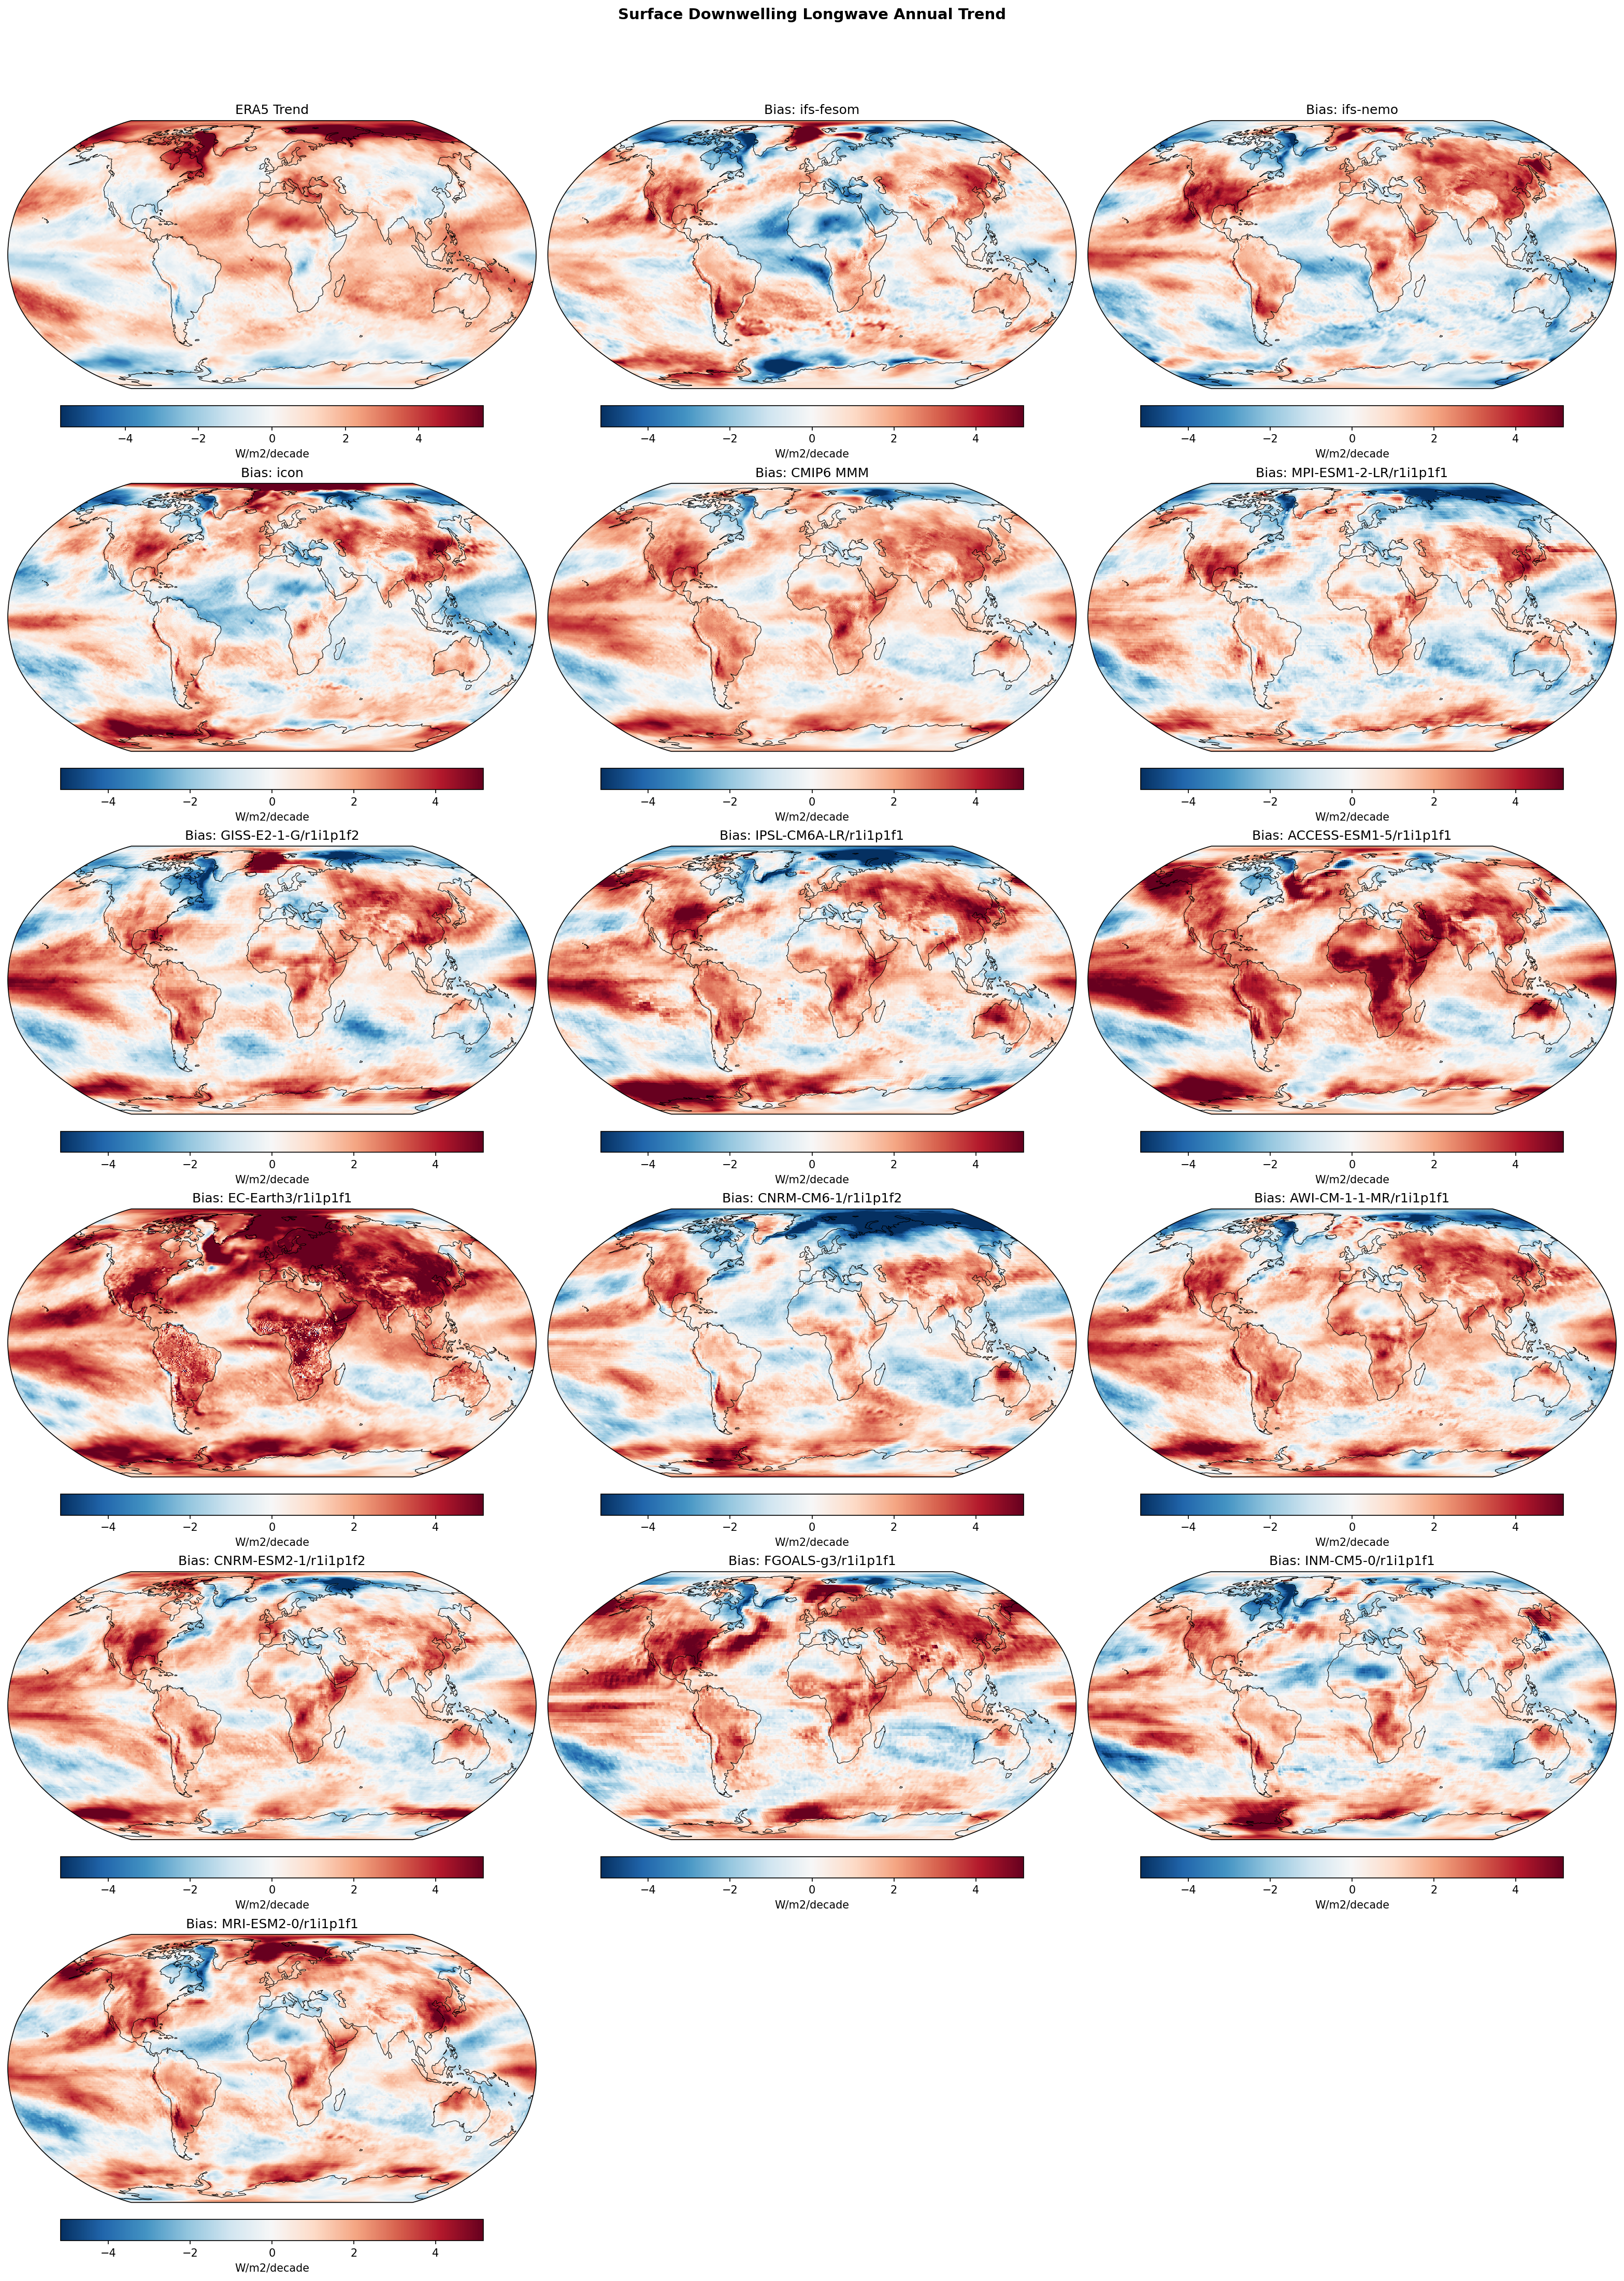
Summary high
This diagnostic evaluates annual linear trends in surface downwelling longwave radiation (SDLW) from 1990–2014, comparing DestinE models (IFS-FESOM, IFS-NEMO, ICON) against ERA5 reanalysis and the CMIP6 ensemble. DestinE models overestimate the global positive trend in SDLW by approximately 0.4 W/m²/decade, which is significantly better than the CMIP6 Multi-Model Mean (MMM) overestimation of ~0.96 W/m²/decade.
Key Findings
- DestinE models consistently outperform the CMIP6 MMM in capturing the magnitude of global SDLW trends, with global mean trend biases of ~0.4 W/m²/decade compared to 0.96 W/m²/decade for CMIP6 MMM.
- A strong positive trend bias exists in the Arctic for all DestinE and most CMIP6 models, indicating that models simulate a much more rapid increase in downwelling radiation (linked to warming and sea ice loss) than ERA5 in this region.
- The three DestinE models (IFS-FESOM, IFS-NEMO, ICON) exhibit highly similar spatial bias patterns and trend RMSEs (1.64–1.68 W/m²/decade), suggesting that atmospheric physics, rather than ocean coupling or grid choice, drive these radiative trend errors.
Spatial Patterns
ERA5 shows positive SDLW trends globally, peaking in the Arctic (Arctic Amplification), with some cooling trends in the Eastern Pacific and Southern Ocean consistent with internal variability (PDO/SAM) during 1990–2014. The DestinE model bias maps are dominated by red (positive bias) in the Northern Hemisphere land masses and the Arctic, implying models warm too fast there. Conversely, blue patches in the Eastern Pacific in model bias maps suggest the models may simulate stronger cooling trends or weaker warming than ERA5 in that specific region, potentially due to phase mismatches in decadal variability.
Model Agreement
There is high agreement among the DestinE models, which all cluster around a global trend bias of ~0.4 W/m²/decade. In contrast, CMIP6 models show large divergence, ranging from ~0.28 (CNRM-CM6-1) to >2.1 (EC-Earth3). DestinE models fall into the better-performing half of the CMIP6 distribution.
Physical Interpretation
The widespread positive bias in SDLW trends indicates that models generally simulate a strengthening of the greenhouse effect (via atmospheric warming, moistening, or cloud changes) that is more rapid than observed during this period. The 1990–2014 window encompasses the so-called 'global warming hiatus' (approx. 1998–2012), a period where surface warming slowed due to internal variability (ocean heat uptake). Free-running coupled models do not synchronize with historical internal variability phases, leading them to generally overestimate surface warming trends (and thus SDLW trends) compared to reanalysis which captures the hiatus.
Caveats
- The analysis period (1990–2014) is relatively short and heavily influenced by internal decadal variability (e.g., IPO/PDO), which coupled models are not expected to reproduce in phase with observations.
- Trend estimates in the Arctic from ERA5 are subject to reanalysis uncertainties due to sparse observations, potentially affecting the magnitude of the calculated bias in that region.
Surface Downwelling Longwave DJF Linear Trend
| Variables | avg_sdlwrf |
|---|---|
| Models | ifs-fesom, ifs-nemo, icon, CMIP6 MMM, MPI-ESM1-2-LR/r1i1p1f1, GISS-E2-1-G/r1i1p1f2, IPSL-CM6A-LR/r1i1p1f1, ACCESS-ESM1-5/r1i1p1f1, EC-Earth3/r1i1p1f1, CNRM-CM6-1/r1i1p1f2, AWI-CM-1-1-MR/r1i1p1f1, CNRM-ESM2-1/r1i1p1f2, FGOALS-g3/r1i1p1f1, INM-CM5-0/r1i1p1f1, MRI-ESM2-0/r1i1p1f1 |
| Reference Dataset | ERA5 |
| Units | W/m2/decade |
| Period | 1990–2014 |
| CMIP6 MMM | Global Mean Trend Diff: 0.96 · Trend Rmse: None |
| MPI-ESM1-2-LR/r1i1p1f1 | Global Mean Trend Diff: 0.25 · Trend Rmse: None |
| GISS-E2-1-G/r1i1p1f2 | Global Mean Trend Diff: 0.70 · Trend Rmse: None |
| IPSL-CM6A-LR/r1i1p1f1 | Global Mean Trend Diff: 1.00 · Trend Rmse: None |
| ACCESS-ESM1-5/r1i1p1f1 | Global Mean Trend Diff: 1.75 · Trend Rmse: None |
| EC-Earth3/r1i1p1f1 | Global Mean Trend Diff: 2.16 · Trend Rmse: None |
| CNRM-CM6-1/r1i1p1f2 | Global Mean Trend Diff: 0.26 · Trend Rmse: None |
| AWI-CM-1-1-MR/r1i1p1f1 | Global Mean Trend Diff: 1.02 · Trend Rmse: None |
| CNRM-ESM2-1/r1i1p1f2 | Global Mean Trend Diff: 0.86 · Trend Rmse: None |
| FGOALS-g3/r1i1p1f1 | Global Mean Trend Diff: 1.03 · Trend Rmse: None |
| INM-CM5-0/r1i1p1f1 | Global Mean Trend Diff: 0.57 · Trend Rmse: None |
| MRI-ESM2-0/r1i1p1f1 | Global Mean Trend Diff: 1.00 · Trend Rmse: None |
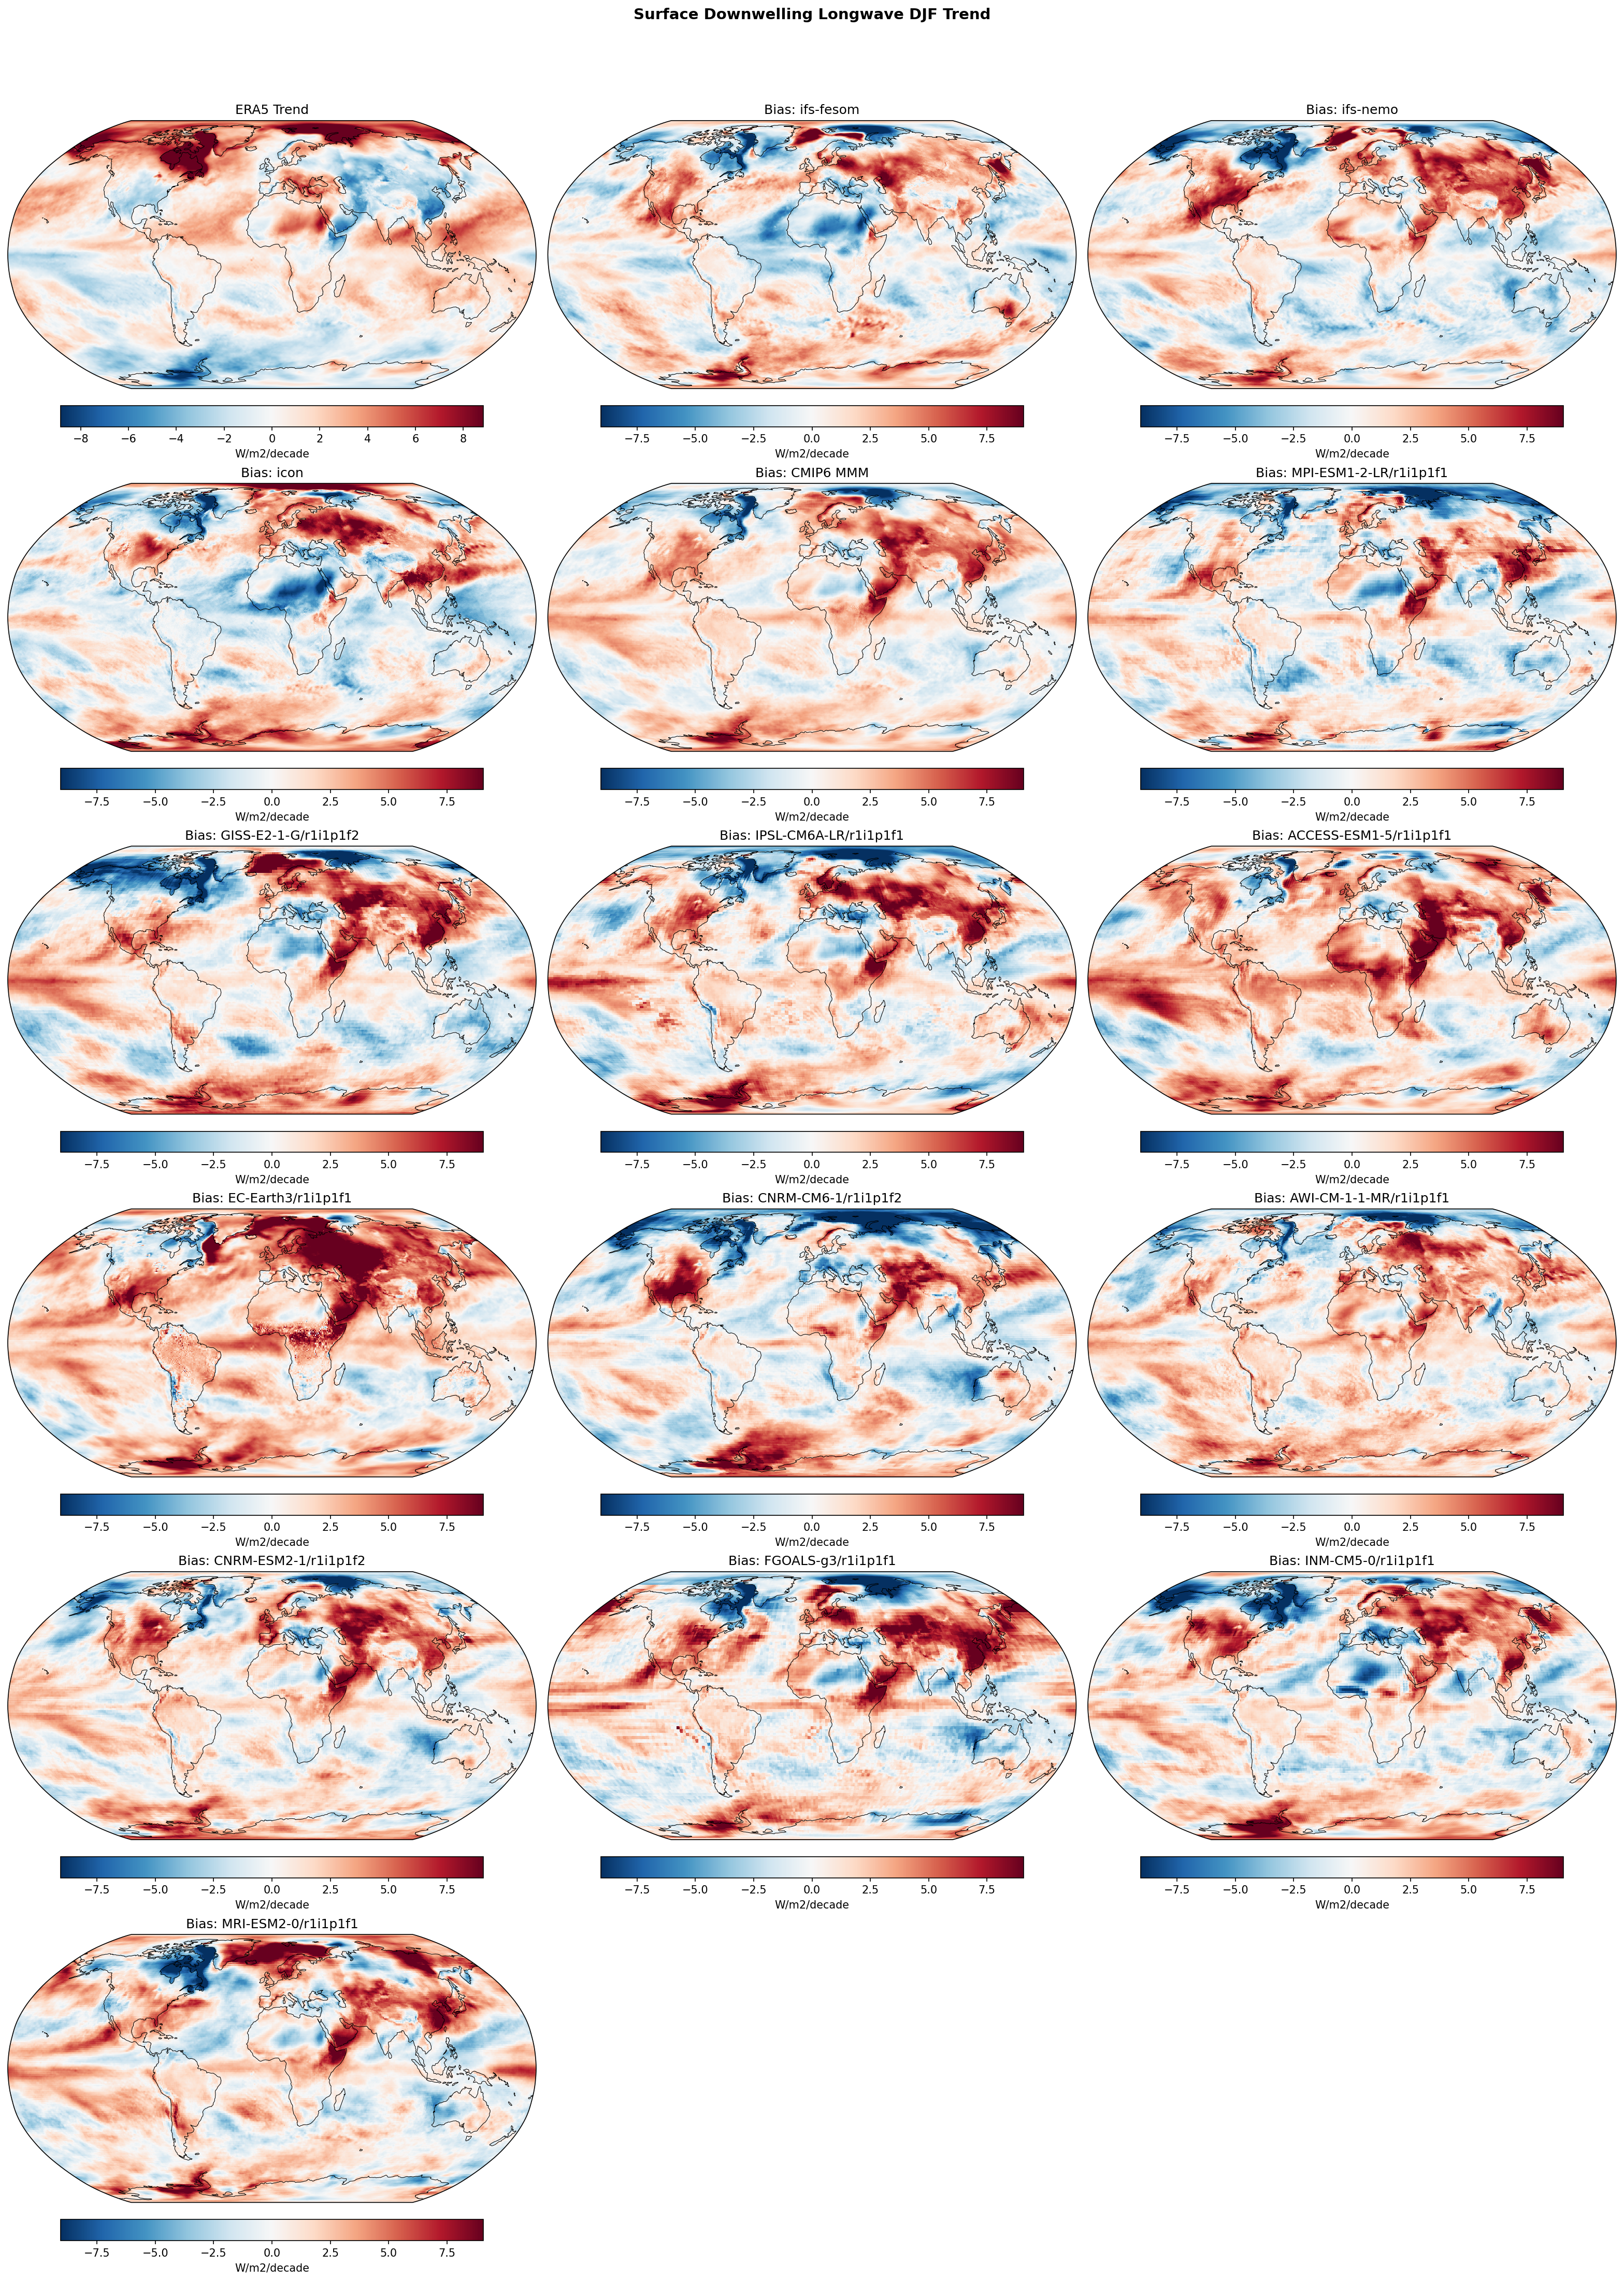
Summary high
This diagnostic compares linear trends (1990–2014) in winter (DJF) Surface Downwelling Longwave Radiation between ERA5 reanalysis, DestinE high-resolution models, and the CMIP6 ensemble. While ERA5 shows increasing downwelling radiation in the Arctic and Northern Hemisphere landmasses, climate models generally overestimate this trend, exhibiting widespread positive biases in high latitudes.
Key Findings
- Most models, including DestinE (IFS-FESOM, IFS-NEMO, ICON) and the CMIP6 Multi-Model Mean, exhibit a 'red' positive trend bias in the Arctic and Siberia, indicating they simulate a faster increase in downwelling longwave radiation than observed in ERA5.
- There is significant inter-model spread in the magnitude of this trend bias: EC-Earth3 and ACCESS-ESM1-5 show strong widespread positive biases (global mean trend difference > 1.7 W/m²/decade), whereas MPI-ESM1-2-LR and CNRM-CM6-1 are much closer to observations (difference ~0.25 W/m²/decade).
- Internal variability strongly influences regional trends over this short 25-year period, evident in the mismatched trend patterns over the Pacific Ocean where free-running models fail to synchronize with the observed ENSO/PDO phases in ERA5.
- GISS-E2-1-G is a notable outlier, showing negative trend biases (blue) in high latitudes, suggesting it underestimates the rate of Arctic radiative change relative to ERA5.
Spatial Patterns
ERA5 (top left) shows positive trends (warming signal) concentrated in the Arctic (Barents/Kara Seas) and Northern Hemisphere continents during winter. The model bias maps are dominated by positive values (red) in these same regions, reinforcing that models are amplifying this signal. Regional biases in the tropical Pacific and Southern Ocean are heterogeneous, reflecting stochastic internal variability rather than systematic forcing response errors.
Model Agreement
There is broad qualitative agreement across the DestinE and CMIP6 models regarding the sign of the bias (positive over NH high latitudes), but poor quantitative agreement on magnitude. The high-resolution DestinE models do not clearly outperform the standard-resolution CMIP6 MMM in this metric, showing similar large-scale bias patterns.
Physical Interpretation
The positive trend bias in Surface Downwelling Longwave Radiation likely reflects stronger Arctic Amplification in the models compared to ERA5. Mechanisms include more rapid sea ice loss (exposing warm ocean to cold atmosphere), stronger water vapor feedback, or increased cloud cover in the models during winter, all of which enhance downwelling longwave radiation. The biases over NH land suggest models may be overestimating the cloud radiative effect or boundary layer warming trends.
Caveats
- The 25-year analysis period (1990–2014) is relatively short, making trend calculations sensitive to start/end dates and internal climate variability (e.g., ENSO phases).
- ERA5 is a reanalysis product; while robust, it relies on its own underlying model physics in data-sparse regions like the Arctic, contributing to uncertainty in the 'truth' baseline.
Surface Downwelling Longwave JJA Linear Trend
| Variables | avg_sdlwrf |
|---|---|
| Models | ifs-fesom, ifs-nemo, icon, CMIP6 MMM, MPI-ESM1-2-LR/r1i1p1f1, GISS-E2-1-G/r1i1p1f2, IPSL-CM6A-LR/r1i1p1f1, ACCESS-ESM1-5/r1i1p1f1, EC-Earth3/r1i1p1f1, CNRM-CM6-1/r1i1p1f2, AWI-CM-1-1-MR/r1i1p1f1, CNRM-ESM2-1/r1i1p1f2, FGOALS-g3/r1i1p1f1, INM-CM5-0/r1i1p1f1, MRI-ESM2-0/r1i1p1f1 |
| Reference Dataset | ERA5 |
| Units | W/m2/decade |
| Period | 1990–2014 |
| CMIP6 MMM | Global Mean Trend Diff: 0.95 · Trend Rmse: None |
| MPI-ESM1-2-LR/r1i1p1f1 | Global Mean Trend Diff: 0.41 · Trend Rmse: None |
| GISS-E2-1-G/r1i1p1f2 | Global Mean Trend Diff: 0.65 · Trend Rmse: None |
| IPSL-CM6A-LR/r1i1p1f1 | Global Mean Trend Diff: 1.08 · Trend Rmse: None |
| ACCESS-ESM1-5/r1i1p1f1 | Global Mean Trend Diff: 1.49 · Trend Rmse: None |
| EC-Earth3/r1i1p1f1 | Global Mean Trend Diff: 2.13 · Trend Rmse: None |
| CNRM-CM6-1/r1i1p1f2 | Global Mean Trend Diff: 0.35 · Trend Rmse: None |
| AWI-CM-1-1-MR/r1i1p1f1 | Global Mean Trend Diff: 1.12 · Trend Rmse: None |
| CNRM-ESM2-1/r1i1p1f2 | Global Mean Trend Diff: 0.86 · Trend Rmse: None |
| FGOALS-g3/r1i1p1f1 | Global Mean Trend Diff: 1.03 · Trend Rmse: None |
| INM-CM5-0/r1i1p1f1 | Global Mean Trend Diff: 0.45 · Trend Rmse: None |
| MRI-ESM2-0/r1i1p1f1 | Global Mean Trend Diff: 0.91 · Trend Rmse: None |
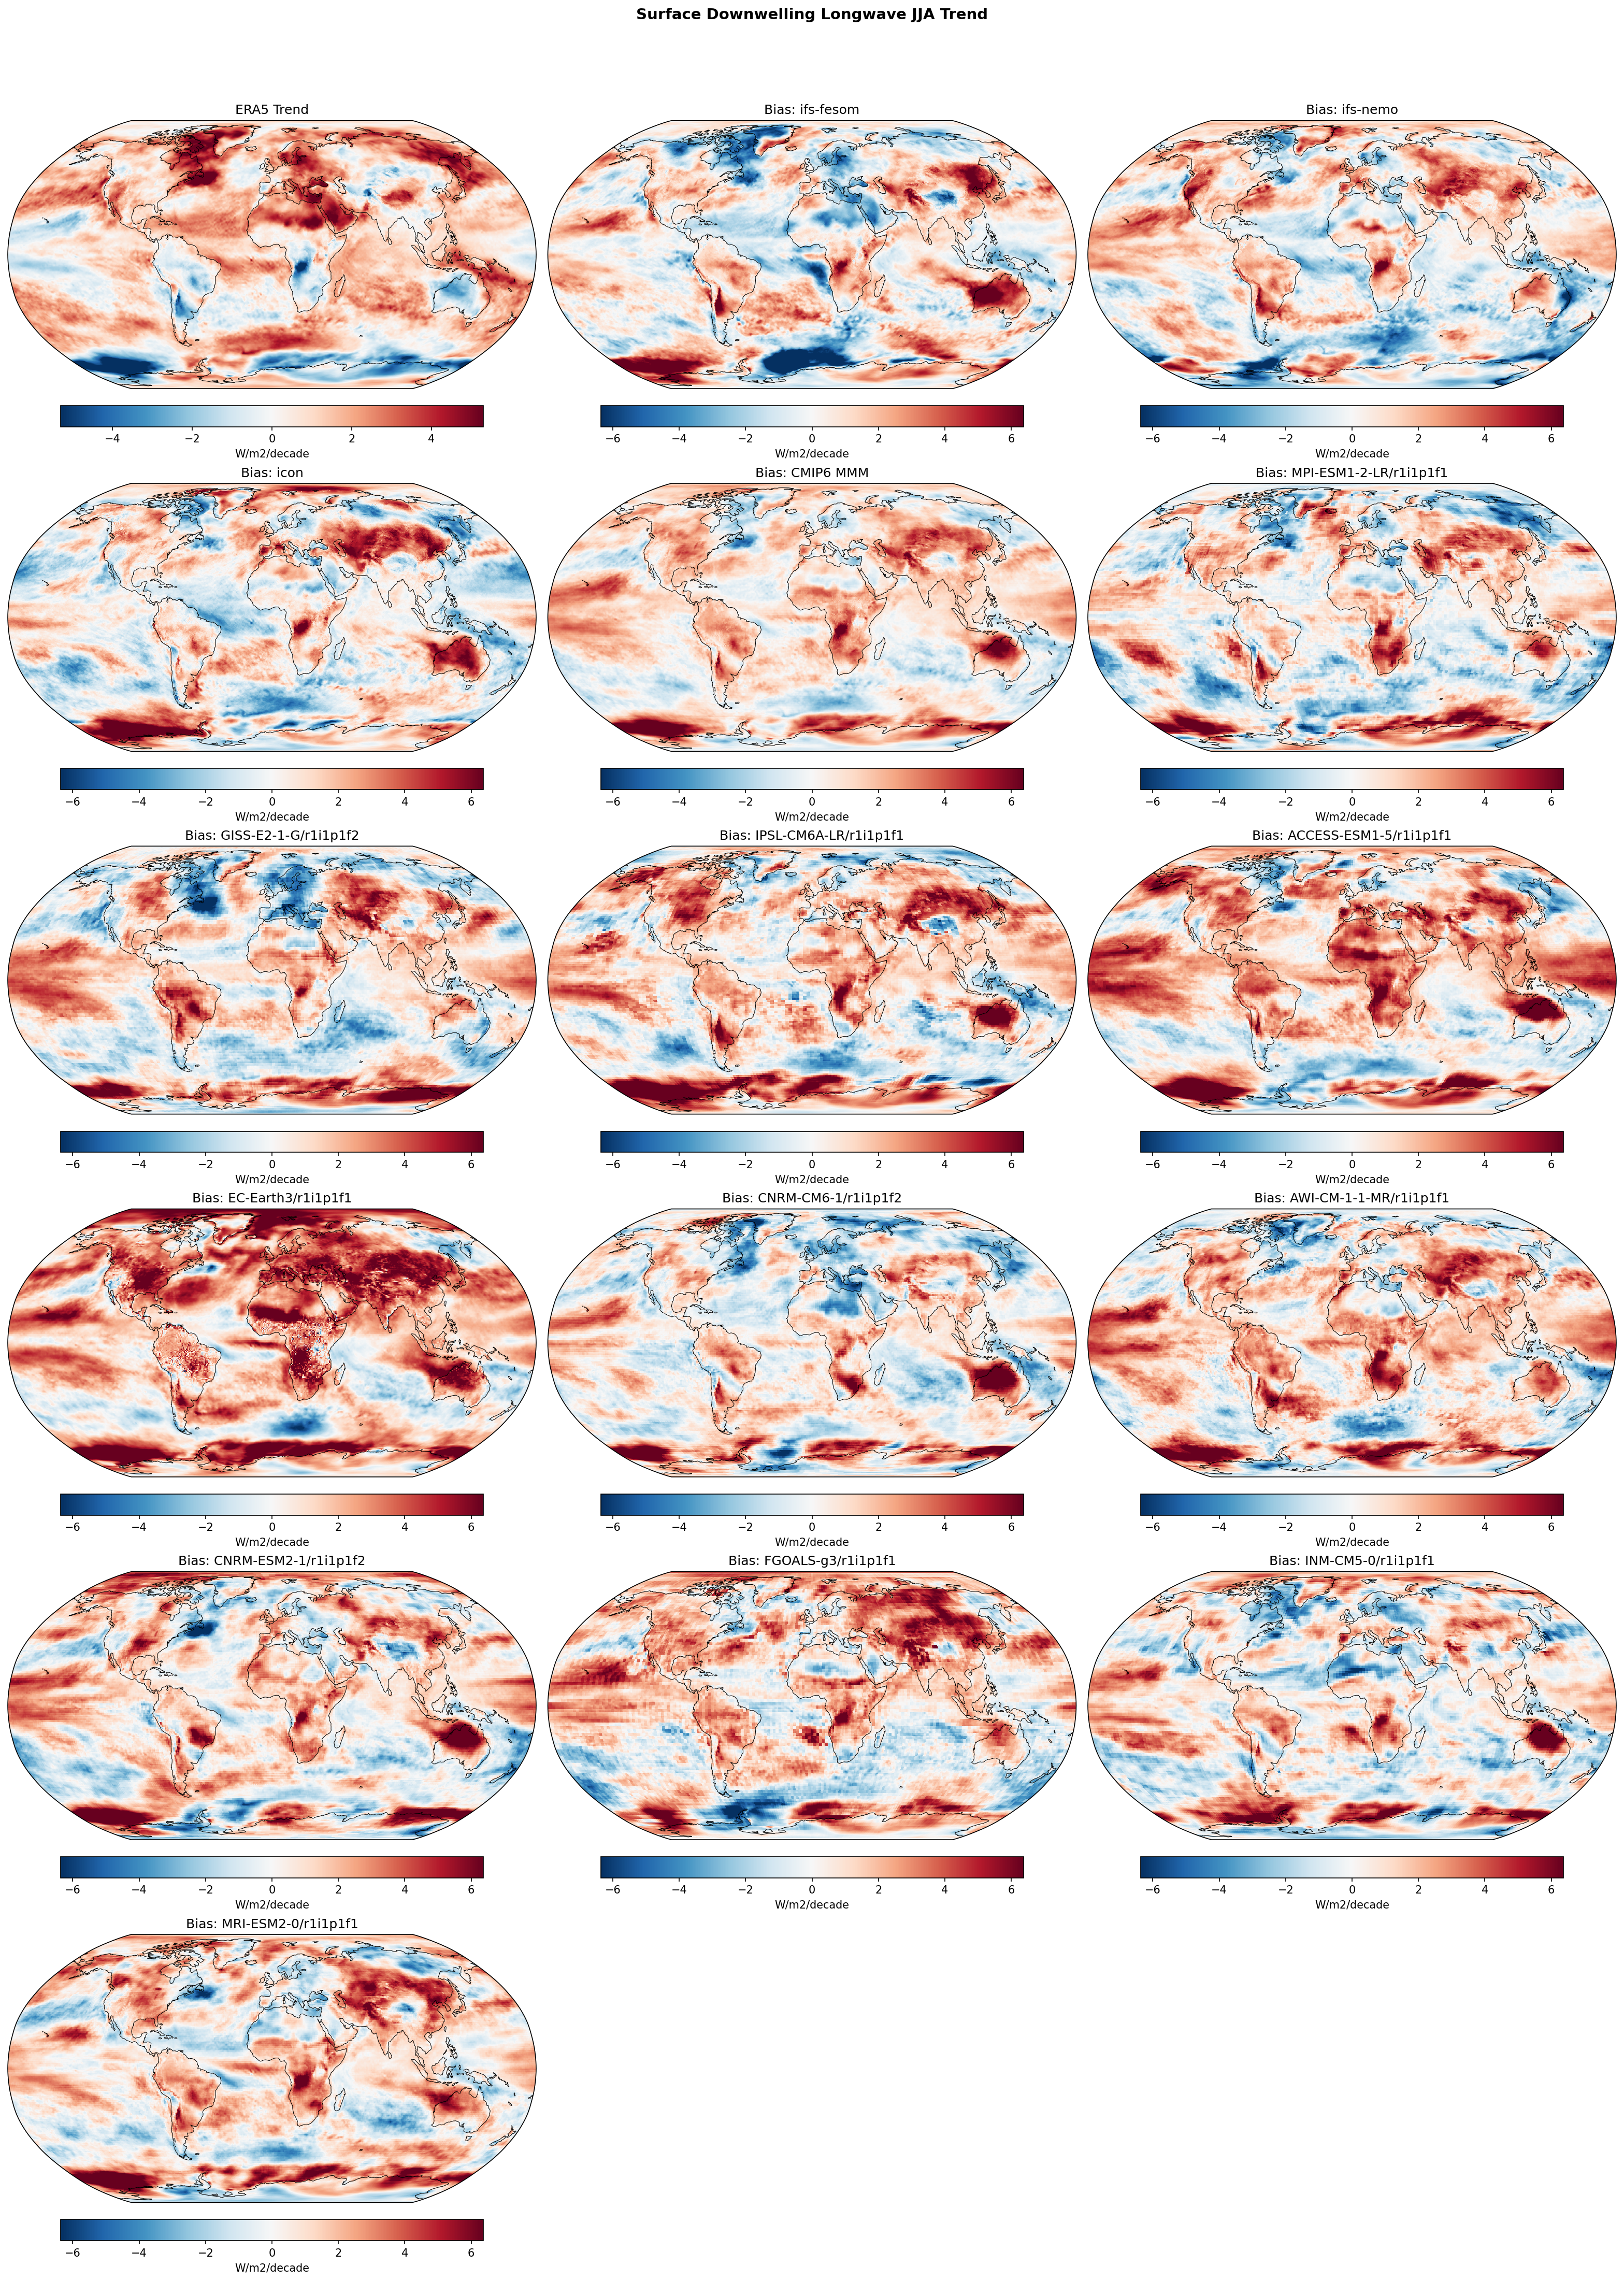
Summary high
This diagnostic evaluates linear trends in JJA Surface Downwelling Longwave Radiation (SDLR) from 1990–2014, comparing ERA5 reanalysis against DestinE prototypes (IFS-FESOM, IFS-NEMO, ICON) and CMIP6 models. The results highlight a systematic tendency for models to simulate stronger positive trends (faster warming) than ERA5, particularly over Northern Hemisphere land masses and the Arctic.
Key Findings
- Most models exhibit a 'positive trend bias' (red colors), indicating that SDLR has increased faster in the simulations than in ERA5 over the 1990–2014 period.
- The ICON model shows the most pronounced positive trend divergence among the DestinE models, with excess trends exceeding +4–6 W/m²/decade over Eurasia and North America.
- IFS-FESOM and IFS-NEMO show very similar spatial patterns, characterized by excess warming trends in the Arctic and North Atlantic, but cooling trend biases (blue) in the Southern Ocean relative to ERA5.
- CMIP6 models show significant spread: EC-Earth3 and ACCESS-ESM1-5 resemble the 'hotter' trend of ICON, while CNRM-CM6-1 and MPI-ESM1-2-LR show moderate trends closer to ERA5.
Spatial Patterns
ERA5 (top left) shows moderate SDLR increases over NH land and the Arctic. The model difference maps reveal that this increase is amplified in the simulations. The strongest discrepancies are in the Arctic (positive bias) and the Southern Ocean (dipole or negative bias). Over NH mid-latitude land, ICON and several CMIP6 models show a widespread, uniform positive trend difference.
Model Agreement
There is high agreement between IFS-FESOM and IFS-NEMO, suggesting the atmospheric component (IFS) drives the primary radiation response, with minor ocean-grid dependencies. ICON diverges significantly from the IFS twins, showing much higher sensitivity over land. The DestinE models fall within the envelope of CMIP6 behavior, with ICON aligning with high-sensitivity models like EC-Earth3.
Physical Interpretation
SDLR trends are primarily driven by lower tropospheric temperature (Planck feedback) and water vapor content. The widespread positive trend bias suggests that models are warming the surface/atmosphere faster than ERA5 or moistening the atmosphere more rapidly during NH summer. The strong positive signals over land in ICON may indicate stronger land-atmosphere coupling or cloud feedbacks amplifying the greenhouse trend compared to the IFS formulation.
Caveats
- The analysis period (1990–2014) is relatively short (25 years), meaning decadal internal variability (e.g., IPO, AMO) significantly influences linear trends.
- The figure labels subsequent panels as 'Bias', but they represent 'Trend Difference' (Model Trend minus Obs Trend).
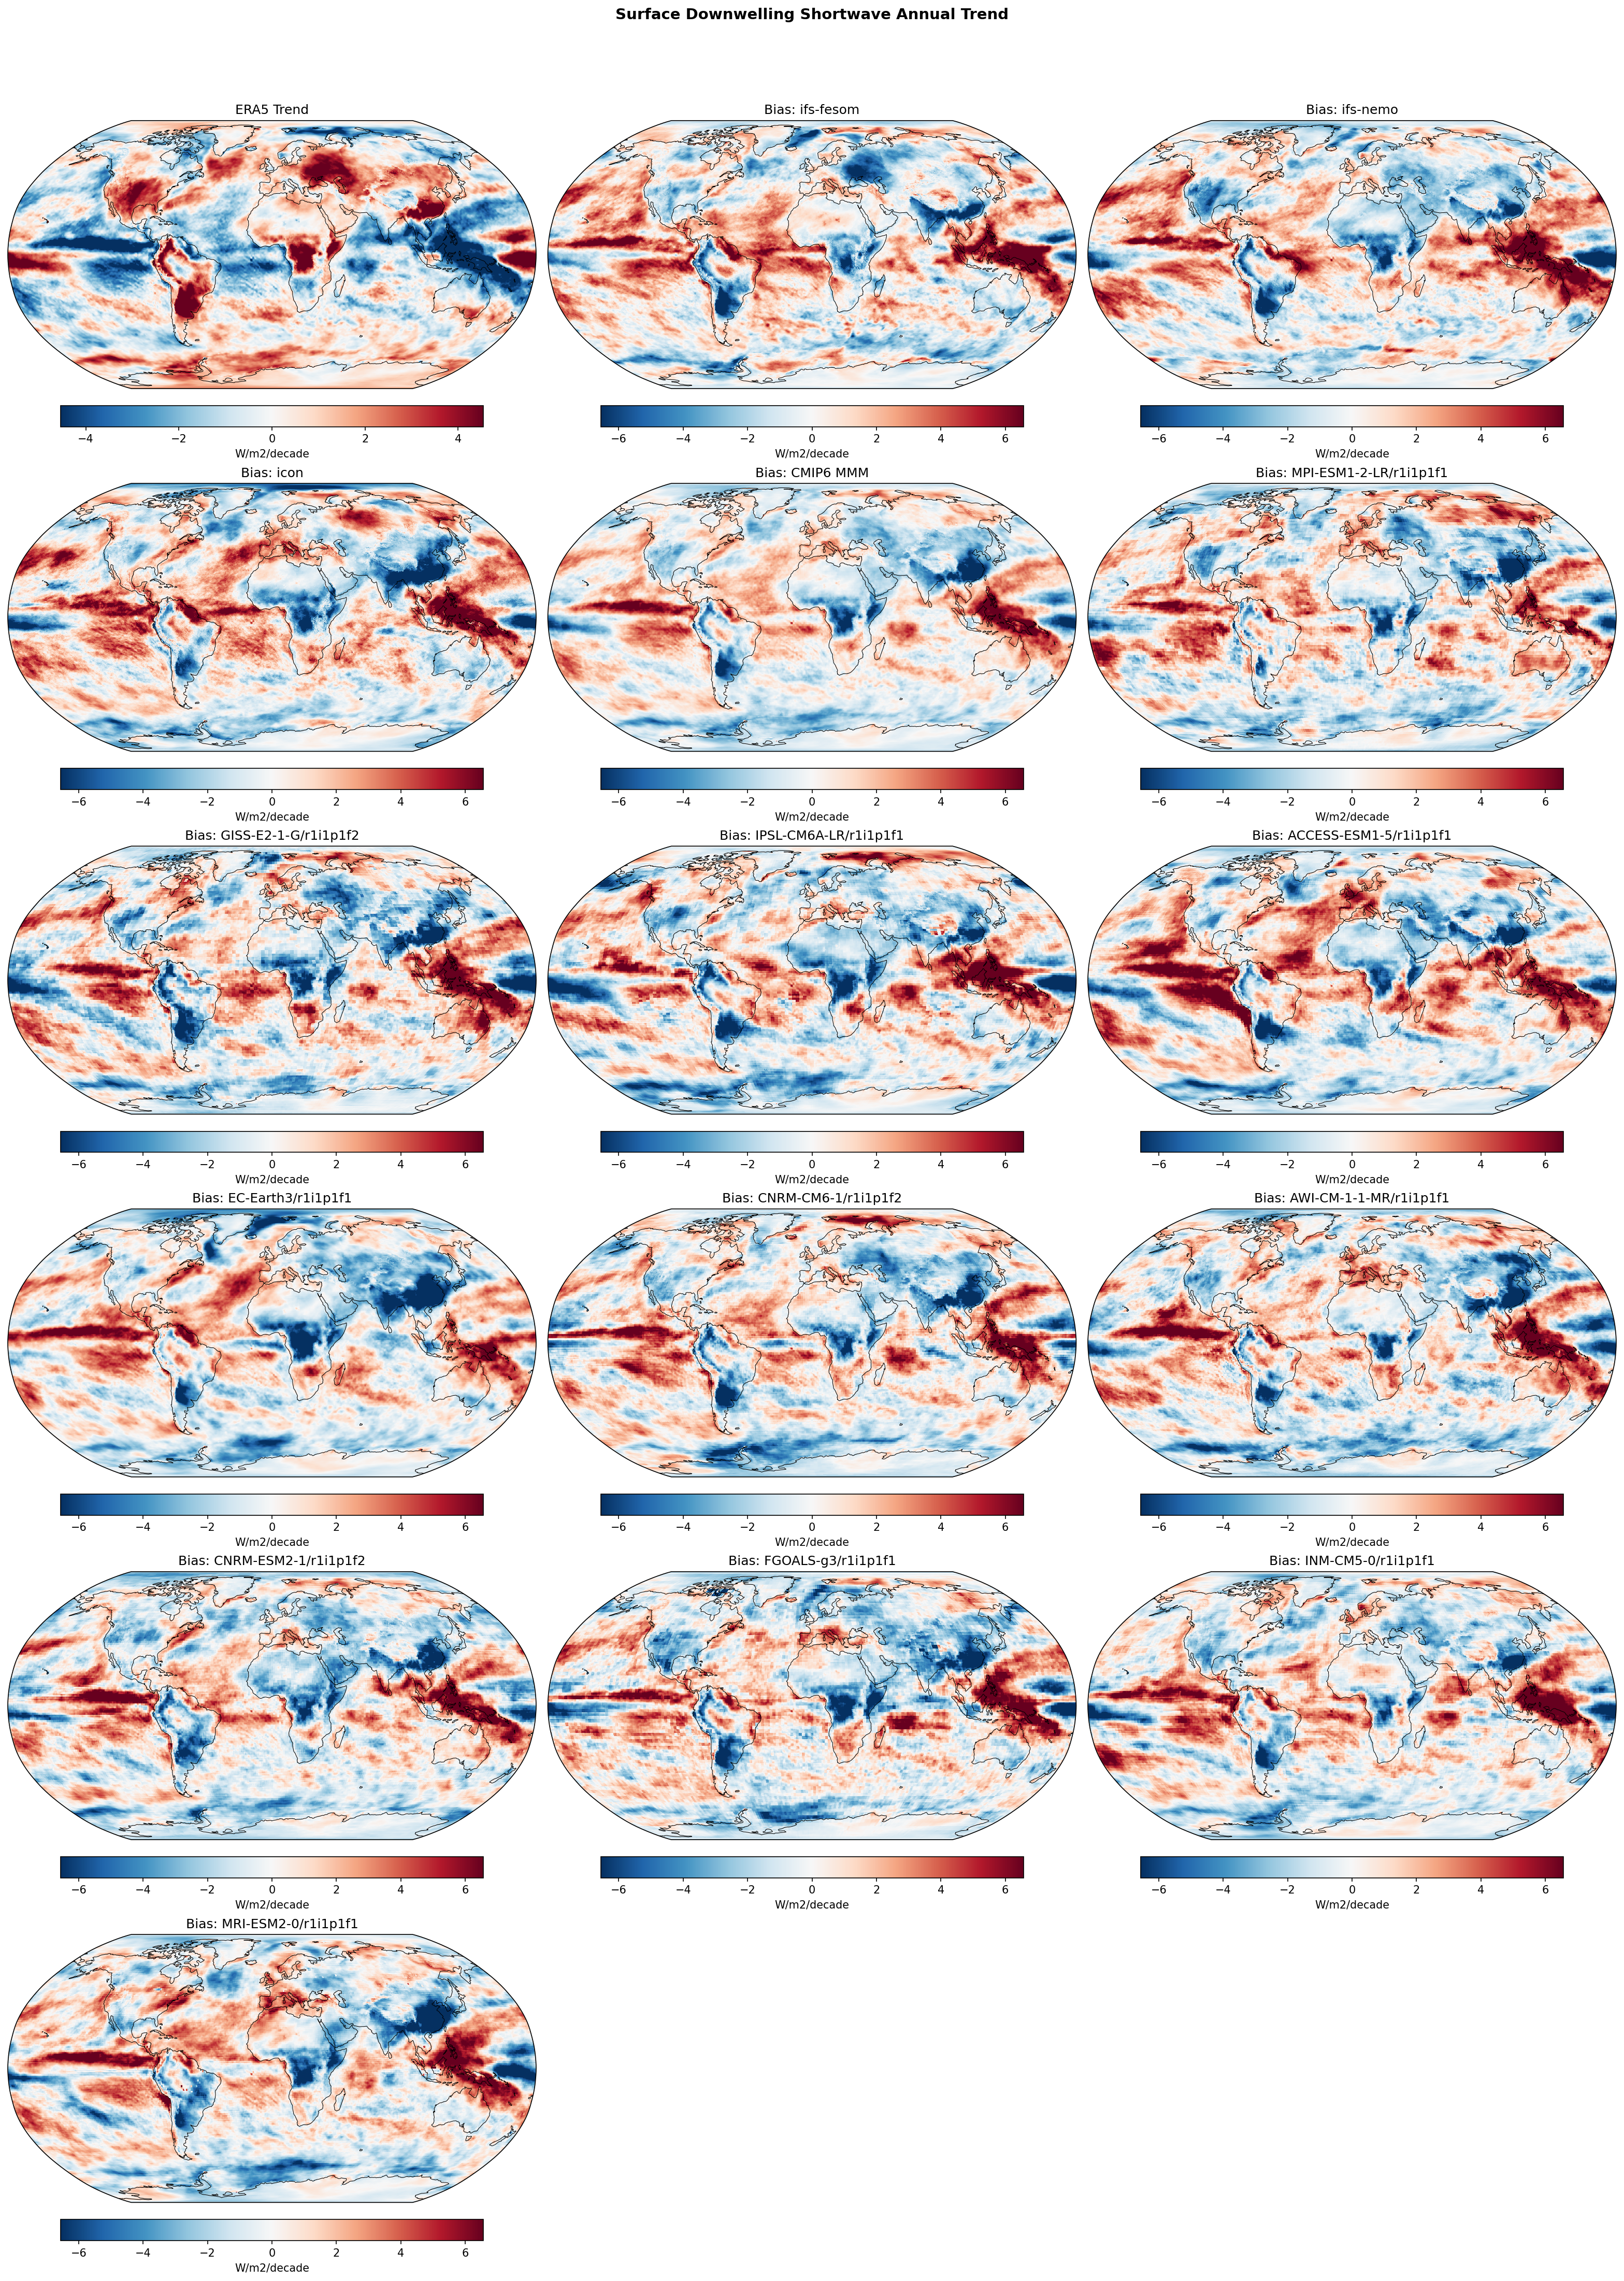
Surface Downwelling Shortwave Annual Linear Trend
| Variables | avg_sdswrf |
|---|---|
| Models | ifs-fesom, ifs-nemo, icon, CMIP6 MMM, MPI-ESM1-2-LR/r1i1p1f1, GISS-E2-1-G/r1i1p1f2, IPSL-CM6A-LR/r1i1p1f1, ACCESS-ESM1-5/r1i1p1f1, EC-Earth3/r1i1p1f1, CNRM-CM6-1/r1i1p1f2, AWI-CM-1-1-MR/r1i1p1f1, CNRM-ESM2-1/r1i1p1f2, FGOALS-g3/r1i1p1f1, INM-CM5-0/r1i1p1f1, MRI-ESM2-0/r1i1p1f1 |
| Reference Dataset | ERA5 |
| Units | W/m2/decade |
| Period | 1990–2014 |
| ifs-fesom | Global Mean Trend: 0.34 · Global Mean Trend Diff: 0.47 · Trend Rmse: 2.69 |
| ifs-nemo | Global Mean Trend: 0.25 · Global Mean Trend Diff: 0.38 · Trend Rmse: 2.71 |
| icon | Global Mean Trend: 0.30 · Global Mean Trend Diff: 0.43 · Trend Rmse: 2.85 |
| CMIP6 MMM | Global Mean Trend Diff: 0.10 · Trend Rmse: 2.30 |
| MPI-ESM1-2-LR/r1i1p1f1 | Global Mean Trend Diff: 0.14 · Trend Rmse: 2.43 |
| GISS-E2-1-G/r1i1p1f2 | Global Mean Trend Diff: 0.06 · Trend Rmse: 2.90 |
| IPSL-CM6A-LR/r1i1p1f1 | Global Mean Trend Diff: 0.00 · Trend Rmse: 2.88 |
| ACCESS-ESM1-5/r1i1p1f1 | Global Mean Trend Diff: 0.43 · Trend Rmse: 2.90 |
| EC-Earth3/r1i1p1f1 | Global Mean Trend Diff: 0.01 · Trend Rmse: 2.68 |
| CNRM-CM6-1/r1i1p1f2 | Global Mean Trend Diff: 0.12 · Trend Rmse: 2.59 |
| AWI-CM-1-1-MR/r1i1p1f1 | Global Mean Trend Diff: 0.08 · Trend Rmse: 2.67 |
| CNRM-ESM2-1/r1i1p1f2 | Global Mean Trend Diff: -0.03 · Trend Rmse: 2.58 |
| FGOALS-g3/r1i1p1f1 | Global Mean Trend Diff: -0.02 · Trend Rmse: 2.74 |
| INM-CM5-0/r1i1p1f1 | Global Mean Trend Diff: 0.23 · Trend Rmse: 2.54 |
| MRI-ESM2-0/r1i1p1f1 | Global Mean Trend Diff: 0.11 · Trend Rmse: 2.78 |
Summary high
This figure evaluates 1990–2014 linear trends in surface downwelling shortwave radiation (W/m²/decade), comparing ERA5 reanalysis against three high-resolution DestinE prototypes and the CMIP6 ensemble. While ERA5 exhibits distinct regional signals like European brightening and Western Pacific dimming, the DestinE models systematically overestimate the global increase in surface solar radiation, sharing strong positive trend biases in the tropical oceans with specific CMIP6 members like ACCESS-ESM1-5.
Key Findings
- Systematic Positive Trend Bias: All three DestinE models (IFS-FESOM, IFS-NEMO, ICON) overestimate the global positive trend in surface shortwave radiation by ~0.38 to 0.47 W/m²/decade relative to ERA5, significantly higher than the CMIP6 Multi-Model Mean bias (+0.10).
- Tropical Pacific Divergence: A major discrepancy appears in the Western Tropical Pacific and Maritime Continent where ERA5 shows dimming (blue), but models exhibit a strong positive trend difference (red), indicating they simulate incorrect clearing or fail to capture increasing optical depth.
- Amazonian Anomaly: DestinE models and several CMIP6 members display a negative trend difference (blue) over the Amazon, implying a simulated reduction in solar radiation (likely due to increasing cloud cover or aerosols) that contrasts with the neutral trend in ERA5.
Spatial Patterns
ERA5 depicts characteristic 'global brightening' in Europe/North Atlantic and dimming in the Indo-Pacific warm pool. The model bias maps reveal large-scale zonal structures: widespread positive biases (red) over tropical oceans and negative biases (blue) over tropical land masses (Amazon, Central Africa). This indicates a land-sea contrast in how models simulate trends in radiative forcing (clouds/aerosols) compared to reanalysis.
Model Agreement
The three DestinE models show high inter-model agreement with almost identical spatial bias patterns, suggesting common structural sensitivities in their physics or forcing. They align closely with CMIP6 models like ACCESS-ESM1-5 and CNRM-CM6-1, but generally perform worse than the best-in-class CMIP6 members (e.g., EC-Earth3, +0.01 bias) for this specific metric.
Physical Interpretation
The positive trend bias in SW (excessive brightening) suggests models may be clearing marine clouds too rapidly or reducing aerosols too aggressively compared to ERA5. The regional biases in the Pacific likely relate to discrepancies in the Walker circulation response or cloud feedbacks, while the Amazonian bias suggests potential issues with trends in biomass burning aerosols or the hydrological cycle (convective cloudiness).
Caveats
- Reanalysis Reliability: ERA5 trends can be influenced by changes in the satellite observing system (e.g., instrument transitions) and may not perfectly represent true physical trends.
- Period Length: The 1990–2014 window is relatively short and subject to internal variability (ENSO, PDO), complicating the separation of forced trends from natural fluctuations.
Surface Downwelling Shortwave DJF Linear Trend
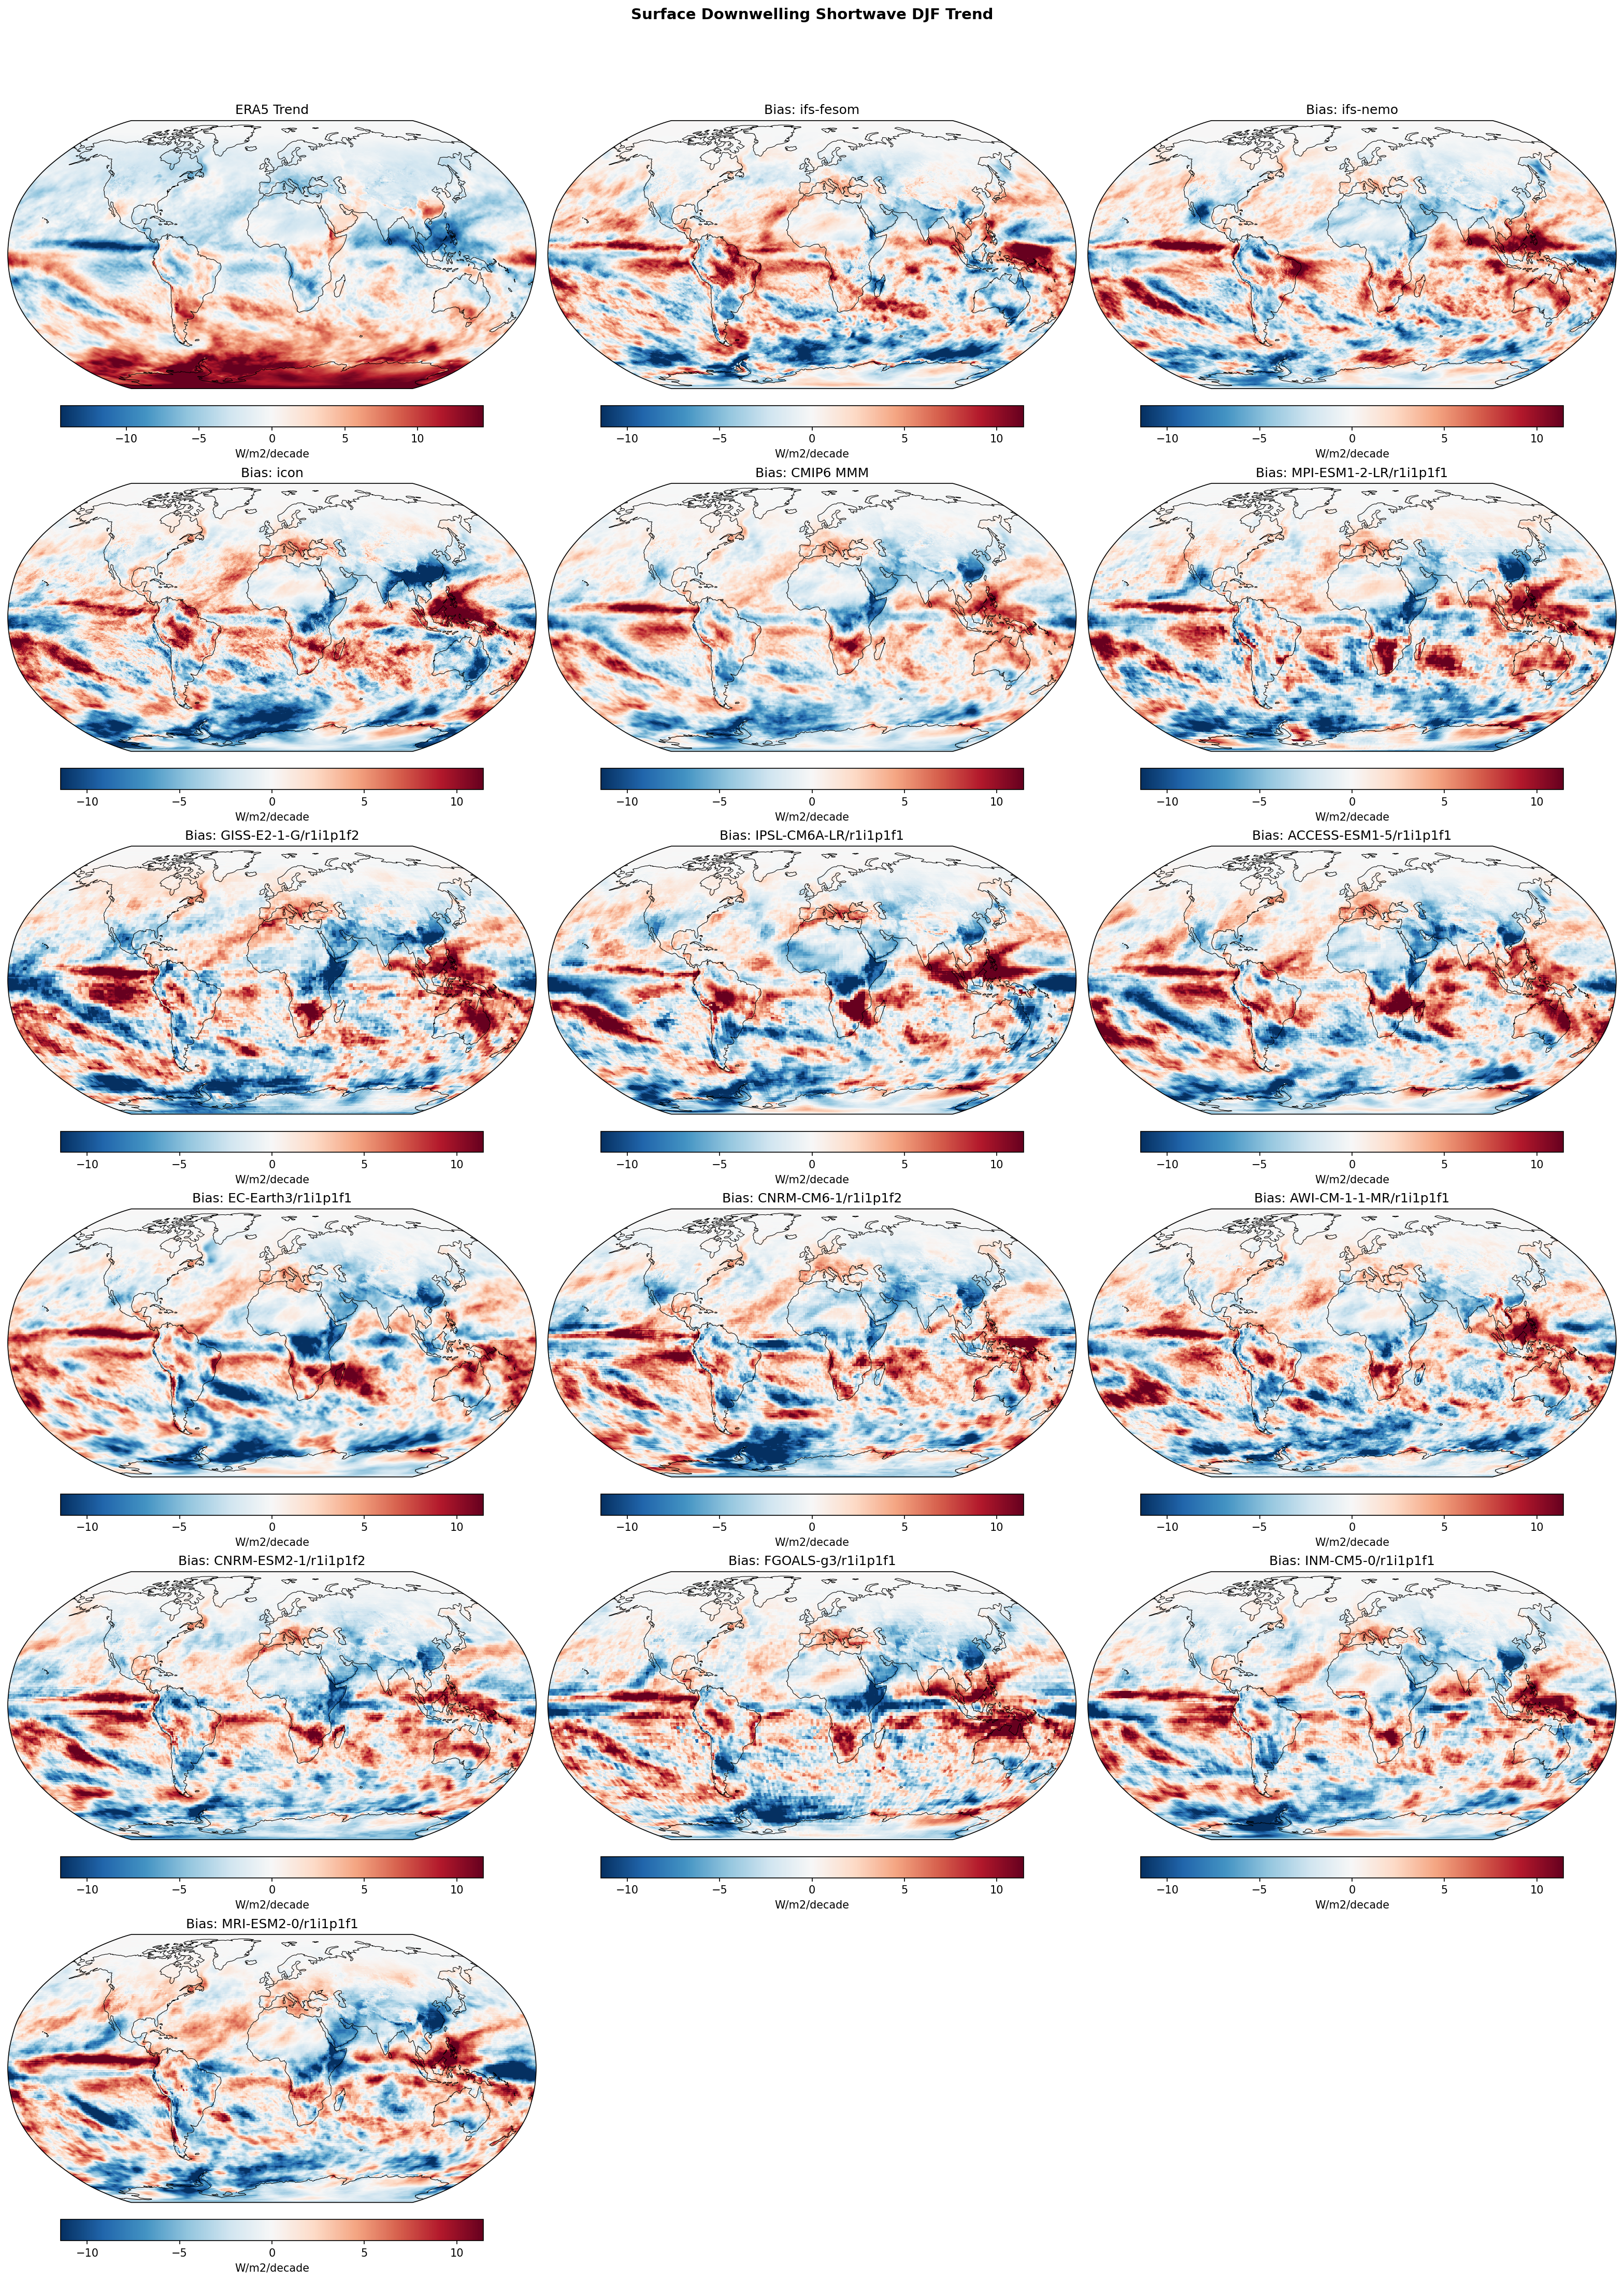
| Variables | avg_sdswrf |
|---|---|
| Models | ifs-fesom, ifs-nemo, icon, CMIP6 MMM, MPI-ESM1-2-LR/r1i1p1f1, GISS-E2-1-G/r1i1p1f2, IPSL-CM6A-LR/r1i1p1f1, ACCESS-ESM1-5/r1i1p1f1, EC-Earth3/r1i1p1f1, CNRM-CM6-1/r1i1p1f2, AWI-CM-1-1-MR/r1i1p1f1, CNRM-ESM2-1/r1i1p1f2, FGOALS-g3/r1i1p1f1, INM-CM5-0/r1i1p1f1, MRI-ESM2-0/r1i1p1f1 |
| Reference Dataset | ERA5 |
| Units | W/m2/decade |
| Period | 1990–2014 |
| CMIP6 MMM | Global Mean Trend Diff: 0.01 · Trend Rmse: None |
| MPI-ESM1-2-LR/r1i1p1f1 | Global Mean Trend Diff: 0.04 · Trend Rmse: None |
| GISS-E2-1-G/r1i1p1f2 | Global Mean Trend Diff: 0.02 · Trend Rmse: None |
| IPSL-CM6A-LR/r1i1p1f1 | Global Mean Trend Diff: -0.17 · Trend Rmse: None |
| ACCESS-ESM1-5/r1i1p1f1 | Global Mean Trend Diff: 0.23 · Trend Rmse: None |
| EC-Earth3/r1i1p1f1 | Global Mean Trend Diff: 0.00 · Trend Rmse: None |
| CNRM-CM6-1/r1i1p1f2 | Global Mean Trend Diff: 0.04 · Trend Rmse: None |
| AWI-CM-1-1-MR/r1i1p1f1 | Global Mean Trend Diff: 0.01 · Trend Rmse: None |
| CNRM-ESM2-1/r1i1p1f2 | Global Mean Trend Diff: -0.03 · Trend Rmse: None |
| FGOALS-g3/r1i1p1f1 | Global Mean Trend Diff: 0.18 · Trend Rmse: None |
| INM-CM5-0/r1i1p1f1 | Global Mean Trend Diff: 0.00 · Trend Rmse: None |
| MRI-ESM2-0/r1i1p1f1 | Global Mean Trend Diff: -0.16 · Trend Rmse: None |
Summary medium
This figure evaluates linear trends in DJF Surface Downwelling Shortwave Radiation (1990–2014) by comparing ERA5 reanalysis against DestinE models (IFS-FESOM, IFS-NEMO, ICON) and the CMIP6 ensemble. The panels visualize spatial trend biases, highlighting discrepancies in decadal cloud cover evolution between free-running simulations and observations.
Key Findings
- DestinE models (IFS-FESOM, IFS-NEMO, ICON) generally exhibit positive trend biases (red) in the tropical oceans, indicating a tendency to simulate more surface brightening (reduced cloud cover) than ERA5 over this period.
- IFS-NEMO shows the most pronounced positive biases in the Tropical Pacific and Indian Oceans (>5-10 W/m²/decade), whereas ICON shows a distinct strong positive bias in the Tropical North Atlantic.
- ERA5 displays a strong positive trend (brightening) in the Southern Ocean and Antarctica for DJF, which the models struggle to replicate spatially, resulting in noisy, high-magnitude regional biases.
Spatial Patterns
The dominant spatial feature in the bias maps is a zonal band of positive values (excess brightening) in the equatorial Pacific and Atlantic in the DestinE models. In contrast, the ERA5 baseline (top-left) shows strong brightening in the Southern Ocean (red) and mixed trends in the tropics. The models' inability to match the specific regional sign of the observed trend results in dipole bias patterns, particularly in the Indo-Pacific warm pool.
Model Agreement
Agreement between the high-resolution DestinE models and ERA5 is relatively low for this metric, likely due to internal variability mismatches. Among DestinE models, IFS-FESOM appears slightly closer to zero-bias than IFS-NEMO in the tropics. The DestinE models fall within the broad scatter of individual CMIP6 models but show sharper, more localized bias structures than the smoothed CMIP6 Multi-Model Mean.
Physical Interpretation
Trends in surface downwelling shortwave radiation are primarily driven by changes in cloud cover and aerosol optical depth. The widespread positive trend biases in the tropics suggest the models are simulating a decadal reduction in cloud fraction (or optical thickness) that exceeds that in the reanalysis. Since these are free-running coupled simulations, large trend differences over a short 25-year period are heavily influenced by the phase of internal decadal variability (e.g., ENSO/IPO, PDO) differing from the historical realization, rather than solely indicating microphysical errors.
Caveats
- The analysis period (1990-2014) is relatively short (25 years), making trends highly sensitive to internal climate variability; model-observation mismatch may reflect phase differences (e.g., random ENSO timing) rather than structural physics biases.
- ERA5 trends in radiative fluxes can contain artifacts from changes in the satellite observing system over time.
Surface Downwelling Shortwave JJA Linear Trend
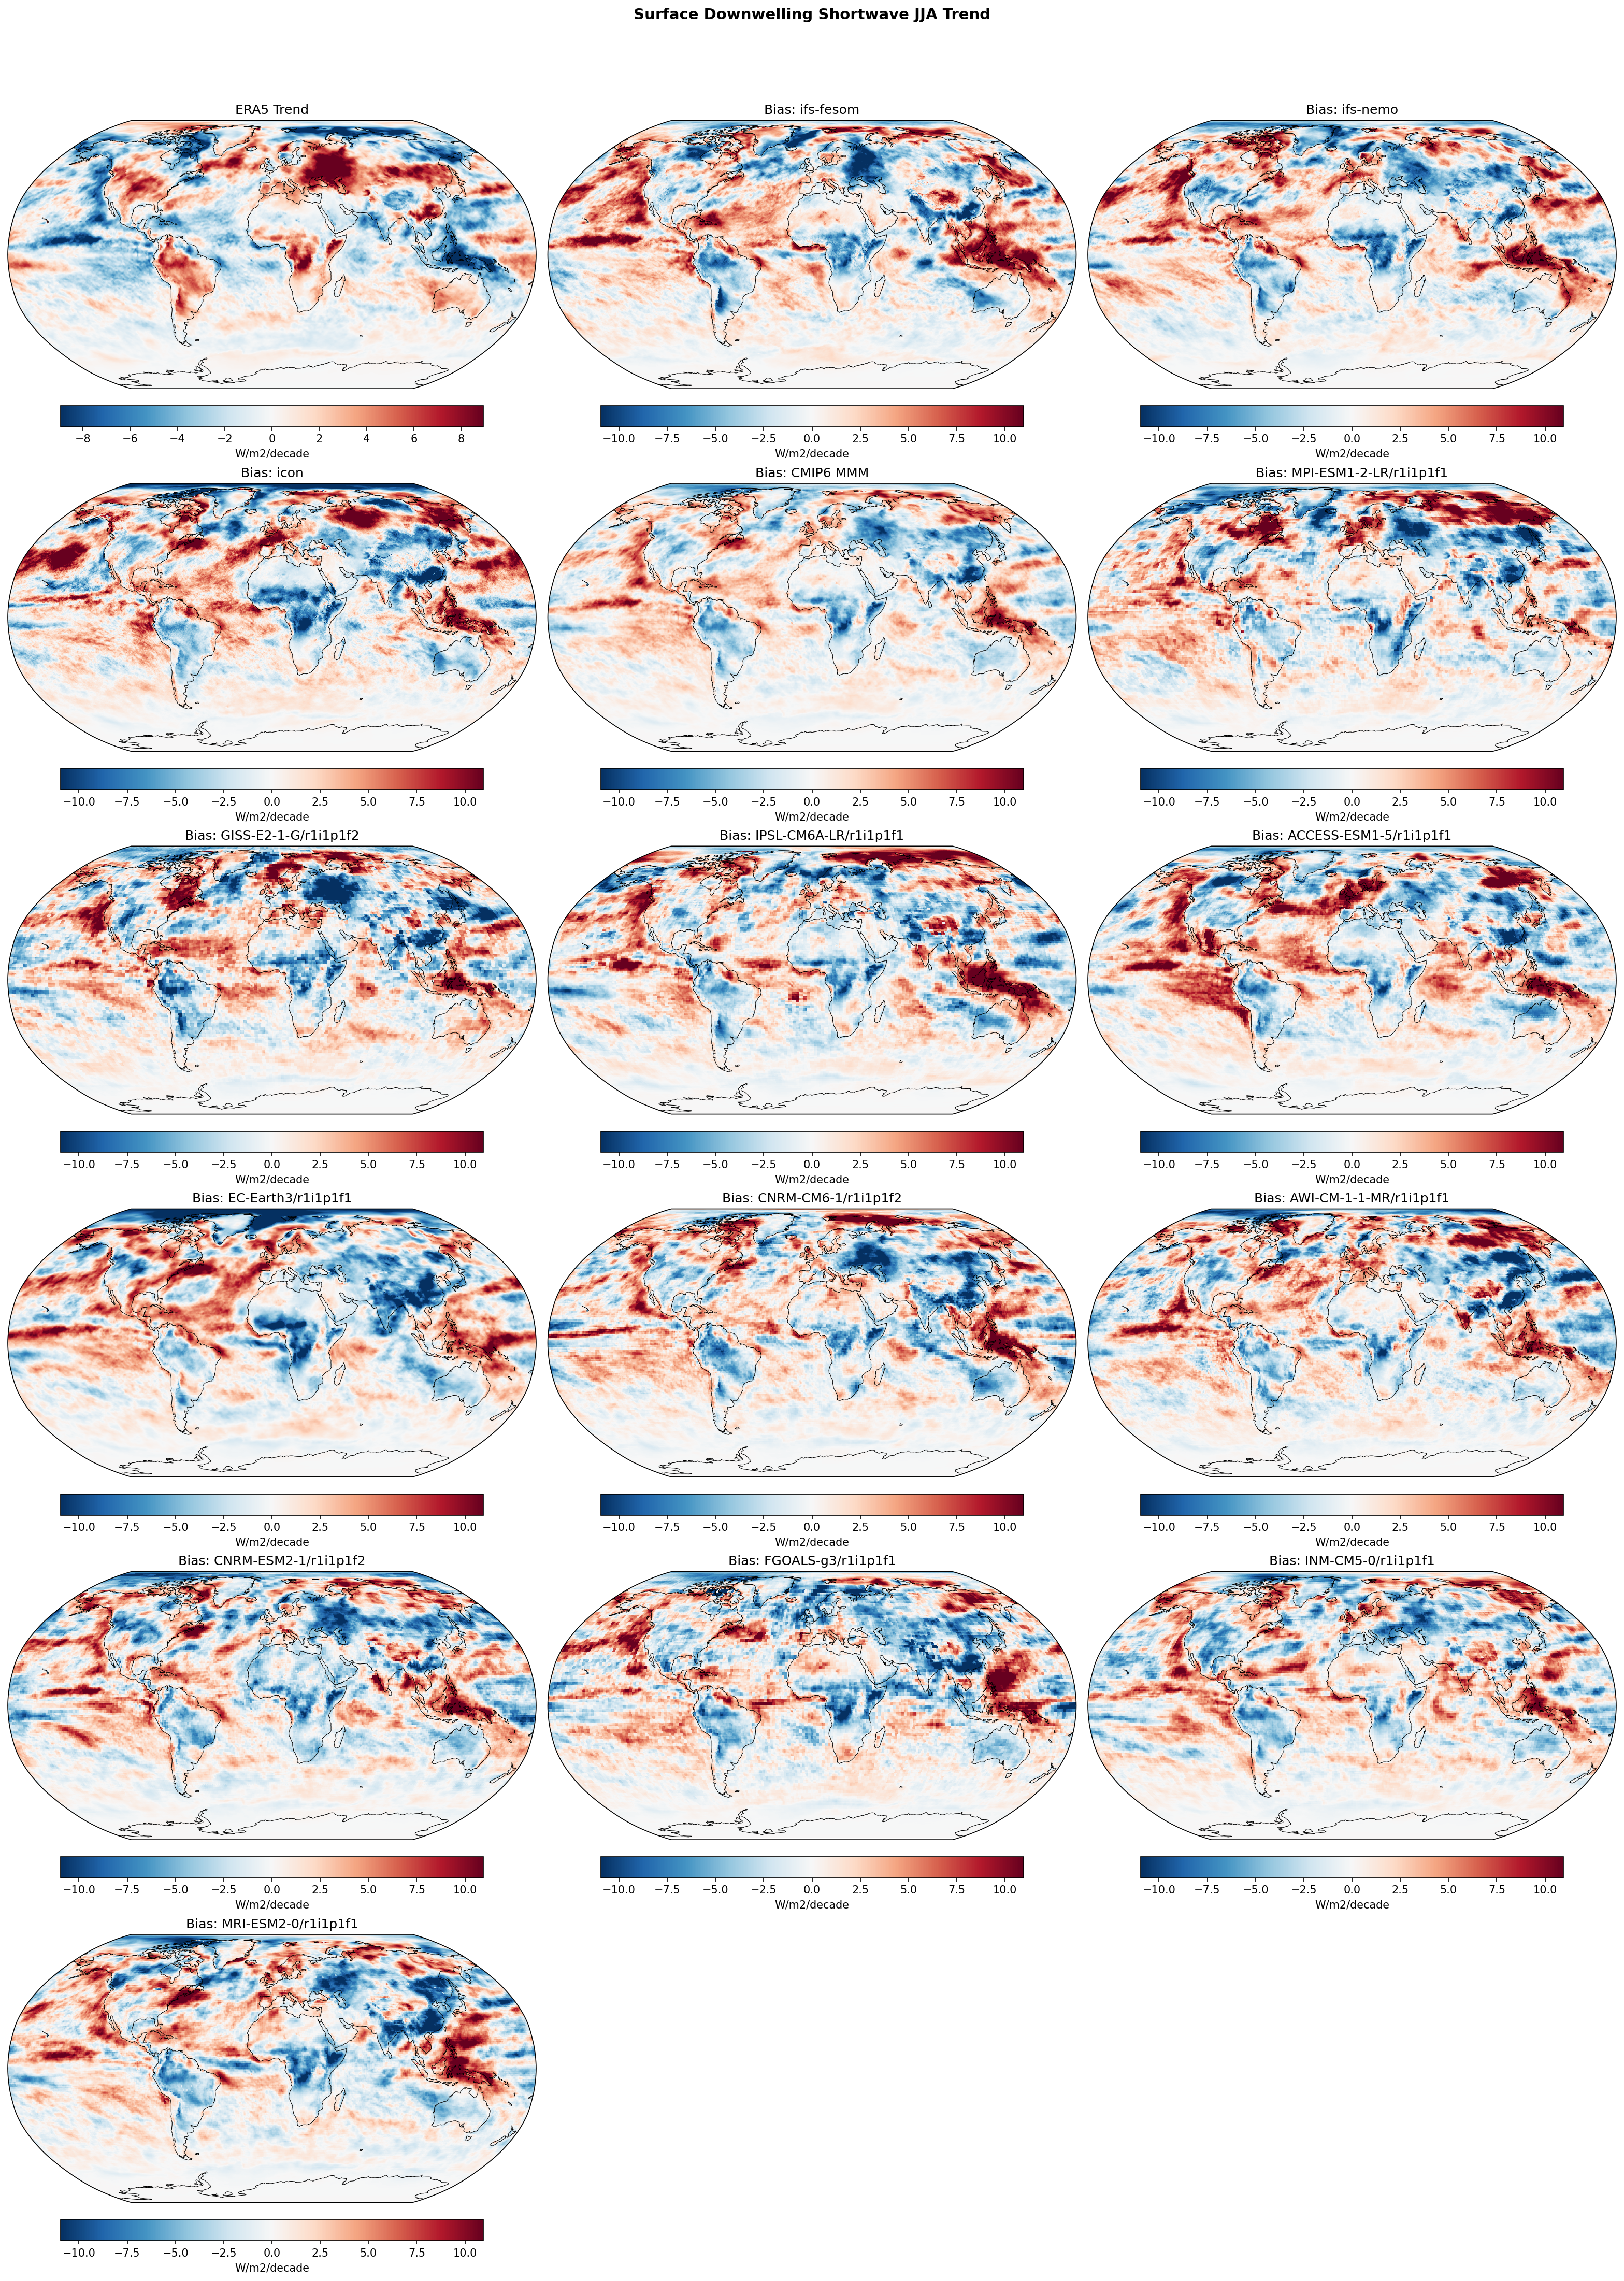
| Variables | avg_sdswrf |
|---|---|
| Models | ifs-fesom, ifs-nemo, icon, CMIP6 MMM, MPI-ESM1-2-LR/r1i1p1f1, GISS-E2-1-G/r1i1p1f2, IPSL-CM6A-LR/r1i1p1f1, ACCESS-ESM1-5/r1i1p1f1, EC-Earth3/r1i1p1f1, CNRM-CM6-1/r1i1p1f2, AWI-CM-1-1-MR/r1i1p1f1, CNRM-ESM2-1/r1i1p1f2, FGOALS-g3/r1i1p1f1, INM-CM5-0/r1i1p1f1, MRI-ESM2-0/r1i1p1f1 |
| Reference Dataset | ERA5 |
| Units | W/m2/decade |
| Period | 1990–2014 |
| CMIP6 MMM | Global Mean Trend Diff: 0.19 · Trend Rmse: None |
| MPI-ESM1-2-LR/r1i1p1f1 | Global Mean Trend Diff: 0.20 · Trend Rmse: None |
| GISS-E2-1-G/r1i1p1f2 | Global Mean Trend Diff: 0.16 · Trend Rmse: None |
| IPSL-CM6A-LR/r1i1p1f1 | Global Mean Trend Diff: 0.32 · Trend Rmse: None |
| ACCESS-ESM1-5/r1i1p1f1 | Global Mean Trend Diff: 0.57 · Trend Rmse: None |
| EC-Earth3/r1i1p1f1 | Global Mean Trend Diff: 0.13 · Trend Rmse: None |
| CNRM-CM6-1/r1i1p1f2 | Global Mean Trend Diff: 0.21 · Trend Rmse: None |
| AWI-CM-1-1-MR/r1i1p1f1 | Global Mean Trend Diff: 0.20 · Trend Rmse: None |
| CNRM-ESM2-1/r1i1p1f2 | Global Mean Trend Diff: -0.00 · Trend Rmse: None |
| FGOALS-g3/r1i1p1f1 | Global Mean Trend Diff: -0.02 · Trend Rmse: None |
| INM-CM5-0/r1i1p1f1 | Global Mean Trend Diff: 0.25 · Trend Rmse: None |
| MRI-ESM2-0/r1i1p1f1 | Global Mean Trend Diff: 0.03 · Trend Rmse: None |
Summary high
This figure evaluates linear trends in JJA Surface Downwelling Shortwave Radiation (1990–2014) comparing ERA5 observations, DestinE models (IFS-FESOM, IFS-NEMO, ICON), and CMIP6 models. The analysis highlights significant regional trend discrepancies, particularly in the Northern Hemisphere.
Key Findings
- ERA5 displays a 'brightening' trend (positive SW) in the North Atlantic, Europe, and Maritime Continent, and a 'dimming' trend (negative SW) in the Eastern Pacific.
- All three DestinE models (IFS-FESOM, IFS-NEMO, ICON) exhibit strong positive trend biases (red) in the North Atlantic and Maritime Continent, indicating they simulate excessive brightening compared to observations.
- ICON shows the most widespread and intense positive trend biases across the Northern Hemisphere mid-latitudes, particularly in the North Pacific where ERA5 shows little trend.
- IFS-FESOM and IFS-NEMO show nearly identical bias patterns, confirming that atmospheric physics (IFS) rather than ocean coupling dictates the shortwave radiation trends.
Spatial Patterns
The most prominent spatial features are the amplified dipoles in the DestinE models. In the North Atlantic, the models amplify the observed positive trend (Red bias). In the Eastern Pacific, models tend to have a negative bias (Blue), suggesting stronger dimming than observed. ICON specifically introduces a strong unobserved brightening trend in the North Pacific. The CMIP6 Multi-Model Mean (MMM) shows much weaker biases spatially, likely due to ensemble averaging canceling out internal variability components.
Model Agreement
There is high agreement between the two IFS-based models (FESOM vs NEMO), suggesting robust but biased atmospheric behavior in the IFS formulation. ICON is distinct with significantly larger positive biases in the NH mid-latitudes. Individual CMIP6 members (e.g., ACCESS-ESM1-5) show high-magnitude spatial biases similar to DestinE models, whereas the CMIP6 MMM is much smoother.
Physical Interpretation
The positive SW trend bias in the North Atlantic and Europe during JJA suggests that the models may be overestimating the reduction of cloud cover or the direct radiative effect of aerosol reduction (brightening) during this period. The 'amplification' pattern (positive bias where obs are positive, negative bias where obs are negative) in the IFS models suggests a hyper-active response to external forcing or internal variability modes (like the Atlantic Multidecadal Oscillation) that are stronger than observed. In contrast, the mismatch in the Pacific often relates to the phase of the Interdecadal Pacific Oscillation (IPO) in free-running simulations not matching the observed historical timeline.
Caveats
- The analysis period (1990-2014) is 25 years, a timescale where internal climate variability (PDO, AMO) strongly influences trends. Disagreement between a single free-running model realization and observations is expected and does not solely imply physics errors.
- Comparing single high-resolution realizations (DestinE) against a Multi-Model Mean (CMIP6 MMM) inherently makes the former look 'noisier' or more biased due to lack of ensemble averaging.
Surface Latent Heat Flux Annual Linear Trend
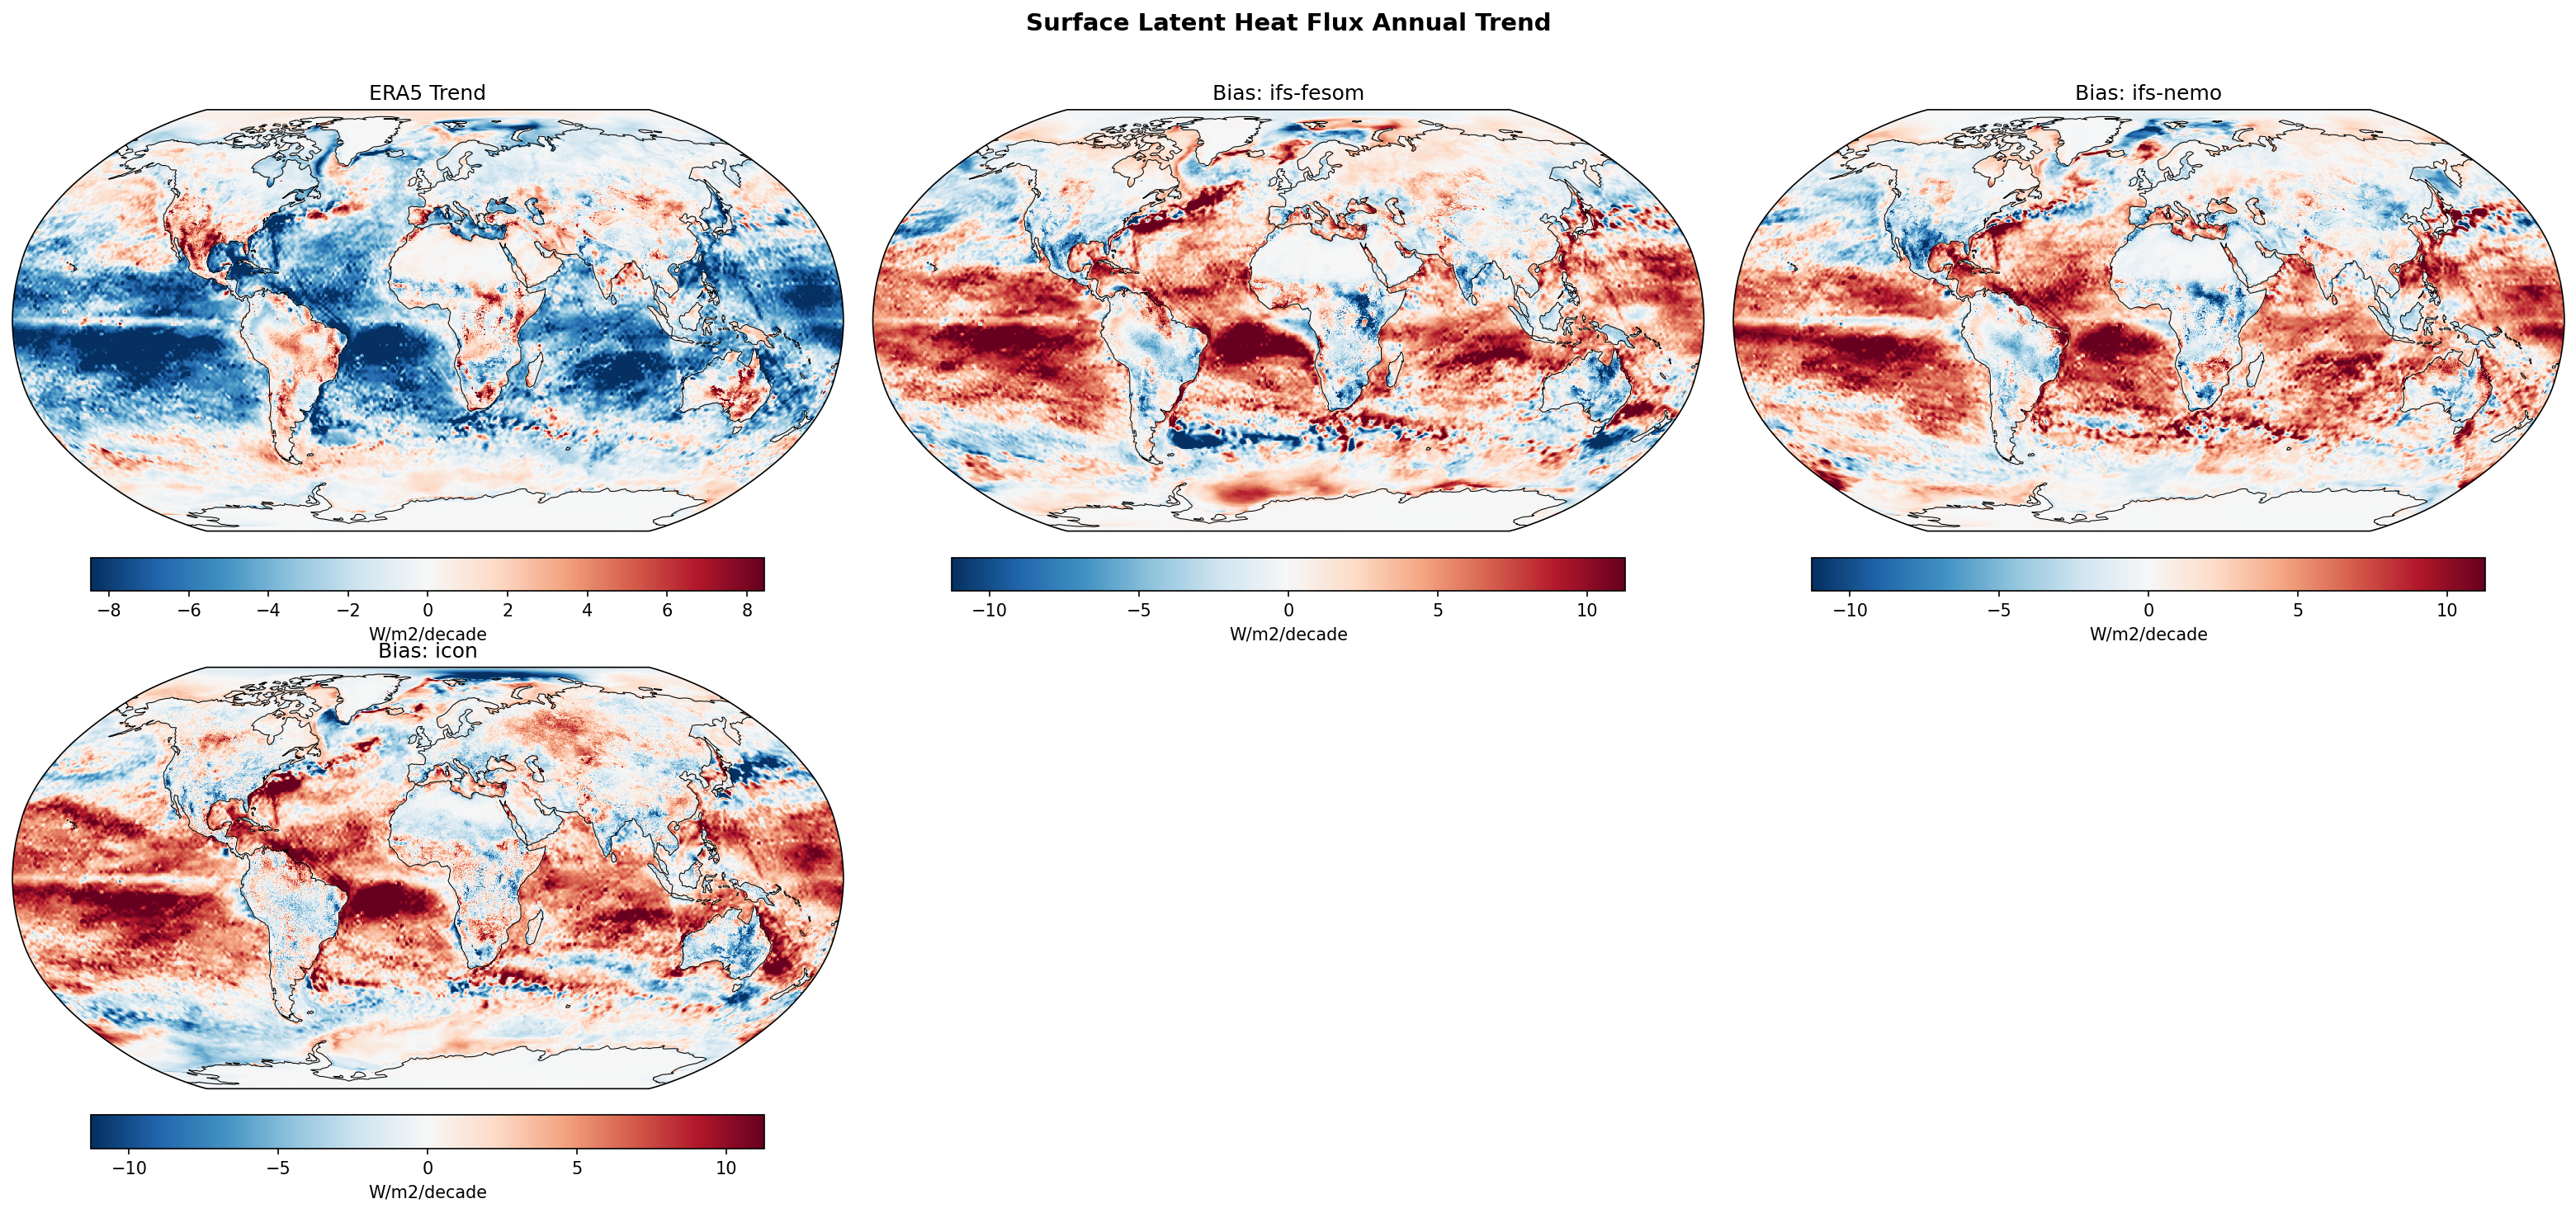
| Variables | avg_slhtf |
|---|---|
| Models | ifs-fesom, ifs-nemo, icon |
| Reference Dataset | ERA5 |
| Units | W/m2/decade |
| Period | 1990–2014 |
| ifs-fesom | Global Mean Trend: -0.24 · Global Mean Trend Diff: 1.96 · Trend Rmse: 4.90 |
| ifs-nemo | Global Mean Trend: -0.14 · Global Mean Trend Diff: 2.06 · Trend Rmse: 4.58 |
| icon | Global Mean Trend: -0.09 · Global Mean Trend Diff: 2.11 · Trend Rmse: 4.81 |
Summary high
This diagnostic compares the annual linear trend of Surface Latent Heat Flux (SLHF) from 1990–2014 between ERA5 observations and three DestinE models (IFS-FESOM, IFS-NEMO, ICON). The analysis reveals a stark contrast: ERA5 exhibits a strong global decreasing trend in latent heat flux, particularly in the tropics, which the free-running models do not reproduce, resulting in widespread positive trend biases.
Key Findings
- ERA5 shows a prominent negative trend (decreasing SLHF) across the tropical Pacific, Indian Ocean, and South Atlantic, with magnitudes reaching -6 to -8 W/m²/decade.
- All three models exhibit large positive trend biases (red regions > 5 W/m²/decade) in the tropics, indicating they fail to capture the strong decreasing trends seen in observations.
- The models produce very weak global mean trends (-0.09 to -0.24 W/m²/decade) compared to the implied strong negative global trend in ERA5 (~-2.2 W/m²/decade), suggesting a systematic divergence in this period's evolution.
- Inter-model agreement is very high; IFS-FESOM, IFS-NEMO, and ICON show nearly identical spatial bias patterns and magnitudes (RMSE ~4.6–4.9 W/m²/decade).
Spatial Patterns
The dominant spatial feature is the discrepancy in the Tropical Pacific and Indian Oceans. ERA5 displays a 'La Niña-like' trend pattern with negative SLHF trends (blue) in the central/eastern Pacific. The model bias maps are the inverse (red), showing positive differences of 5–10 W/m²/decade in these same regions, confirming that the models essentially predict a neutral or weak trend where observations show a strong decrease.
Model Agreement
There is exceptionally high agreement between the three models (IFS-FESOM, IFS-NEMO, and ICON), suggesting that the discrepancy with observations is not due to specific dynamical core or ocean model choices (FESOM vs NEMO), but rather a shared characteristic of the experimental setup (likely free-running coupled simulations).
Physical Interpretation
The 1990–2014 period overlaps significantly with the so-called 'global warming hiatus' and a negative phase of the Interdecadal Pacific Oscillation (IPO), characterized by strengthening trade winds and cooling sea surface temperatures in the eastern Pacific. This observed state would suppress evaporation (latent heat flux), explaining the negative trends in ERA5. As these are likely uninitialized, free-running coupled simulations, the models are not expected to reproduce the specific phase of internal multi-decadal variability (IPO/PDO) present in the historical record. Thus, the 'bias' largely reflects a mismatch in variability phase rather than a fundamental physics error.
Caveats
- The 25-year analysis period (1990–2014) is dominated by internal climate variability (e.g., IPO/PDO phases); trend differences likely reflect phase mismatches rather than forced response errors.
- Trends are calculated linearly; endpoint sensitivity may affect magnitudes given the short duration.
Surface Latent Heat Flux DJF Linear Trend
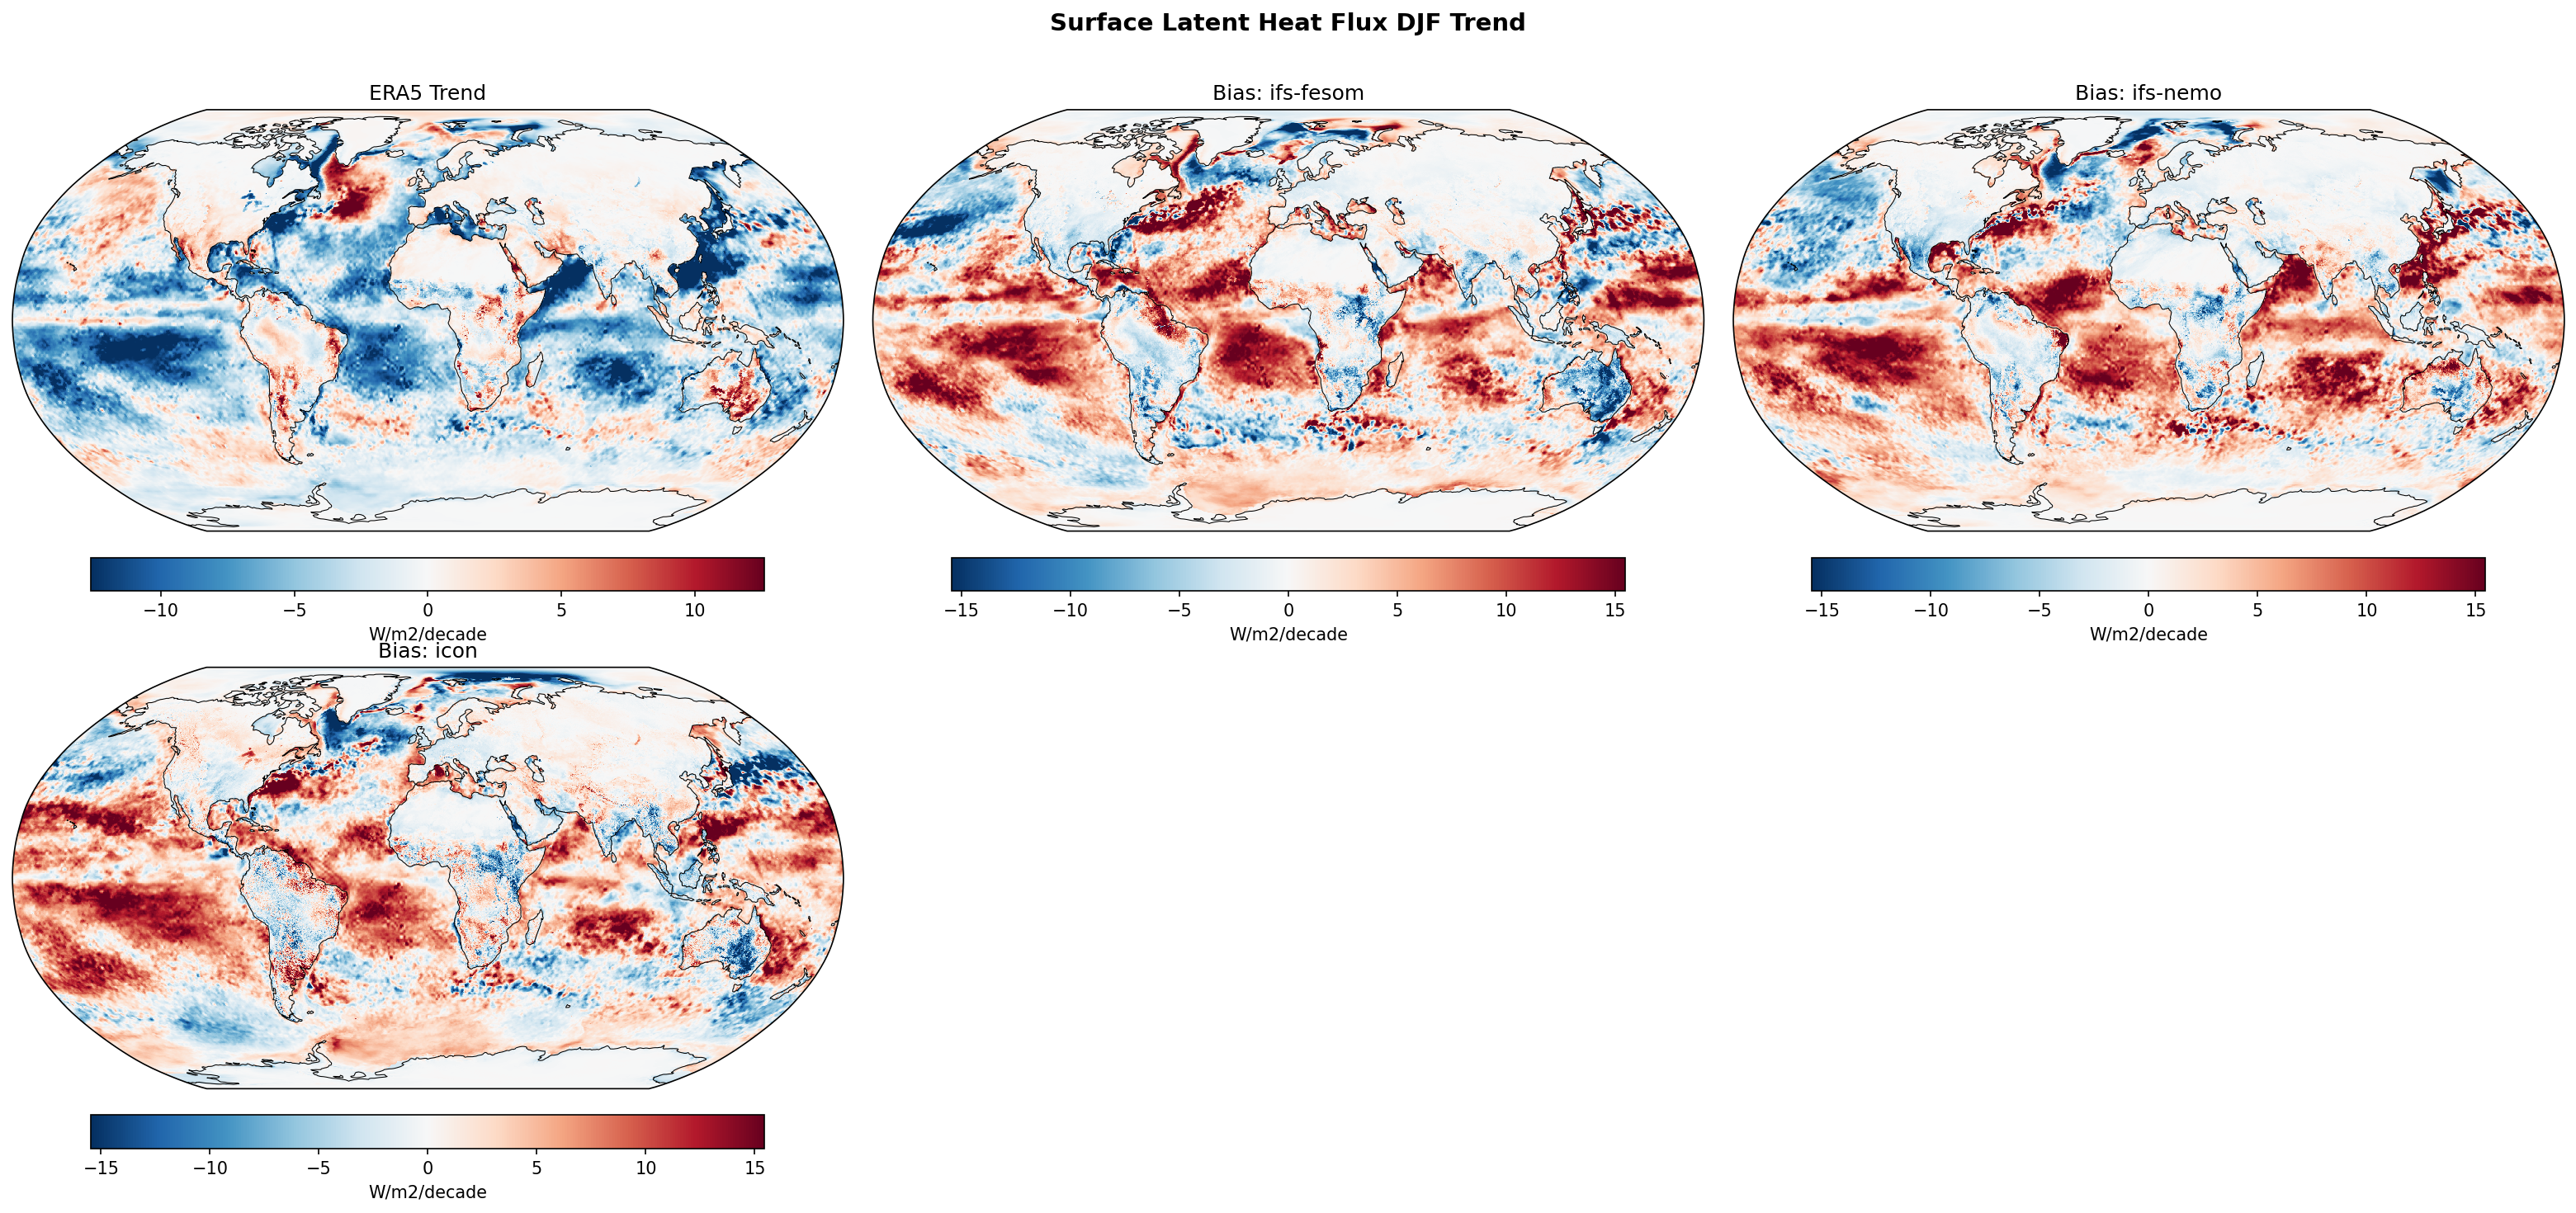
| Variables | avg_slhtf |
|---|---|
| Models | ifs-fesom, ifs-nemo, icon |
| Reference Dataset | ERA5 |
| Units | W/m2/decade |
| Period | 1990–2014 |
Summary high
This figure evaluates linear trends in Surface Latent Heat Flux (SLHF) for the DJF season over the period 1990–2014, comparing ERA5 reanalysis with three high-resolution coupled models (IFS-FESOM, IFS-NEMO, ICON).
Key Findings
- ERA5 displays a strong negative trend (blue) in SLHF over the central and eastern Tropical Pacific and a strong positive trend (red) over the Gulf Stream and Kuroshio Extension.
- All three models exhibit a widespread positive bias (red) in SLHF trends across the tropical and subtropical oceans, particularly in the Pacific and Indian Oceans, with biases exceeding +10 W/m²/decade.
- In the North Atlantic, models show dipole bias patterns (blue/red), indicating spatial mismatches in the trend of the Gulf Stream's latent heat release compared to ERA5.
- The magnitude of the biases is comparable to or larger than the observed trends, highlighting significant discrepancies in decadal variability representation.
Spatial Patterns
ERA5 shows distinct regional signals: reduced latent heat flux in the Tropical Pacific (consistent with the 'global warming hiatus' cooling pattern) and increased flux in Western Boundary Currents. In contrast, the bias maps for all models are dominated by large-scale positive values (red) throughout the tropics. This implies the models either simulate an increasing SLHF trend or a near-zero trend where observations show a decrease. In the North Atlantic, the bias maps show negative biases (blue) along the US coast and positive biases (red) in the open basin for IFS-FESOM and ICON, suggesting the modeled increase in evaporation is displaced or weaker than the sharp Gulf Stream trend seen in ERA5.
Model Agreement
Inter-model agreement is high regarding the large-scale bias structure. IFS-FESOM, IFS-NEMO, and ICON all share the prominent positive trend bias in the tropics. Differences are subtler, primarily in the morphological details of the North Atlantic dipole and the intensity of biases in the Southern Ocean, where IFS-NEMO shows slightly sharper features.
Physical Interpretation
The period 1990–2014 is characterized by a negative phase of the Interdecadal Pacific Oscillation (IPO), associated with strengthening trade winds and cooling SSTs in the eastern Tropical Pacific. This cooling suppresses evaporation (negative SLHF trend in ERA5). The widespread positive bias suggests that the models do not reproduce this specific phase of internal variability, likely simulating a more uniform warming or El Niño-like trend (warmer SSTs driving higher evaporation). The Atlantic biases point to difficulties in capturing the precise location and intensification of heat loss associated with Western Boundary Current shifts.
Caveats
- The analysis period (1990–2014) is relatively short and heavily influenced by internal multi-decadal variability (e.g., IPO), making it difficult to disentangle forced trends from internal noise.
- Positive/negative sign convention is inferred as positive = upward flux (evaporation) based on the context of Gulf Stream warming trends.
Surface Latent Heat Flux JJA Linear Trend
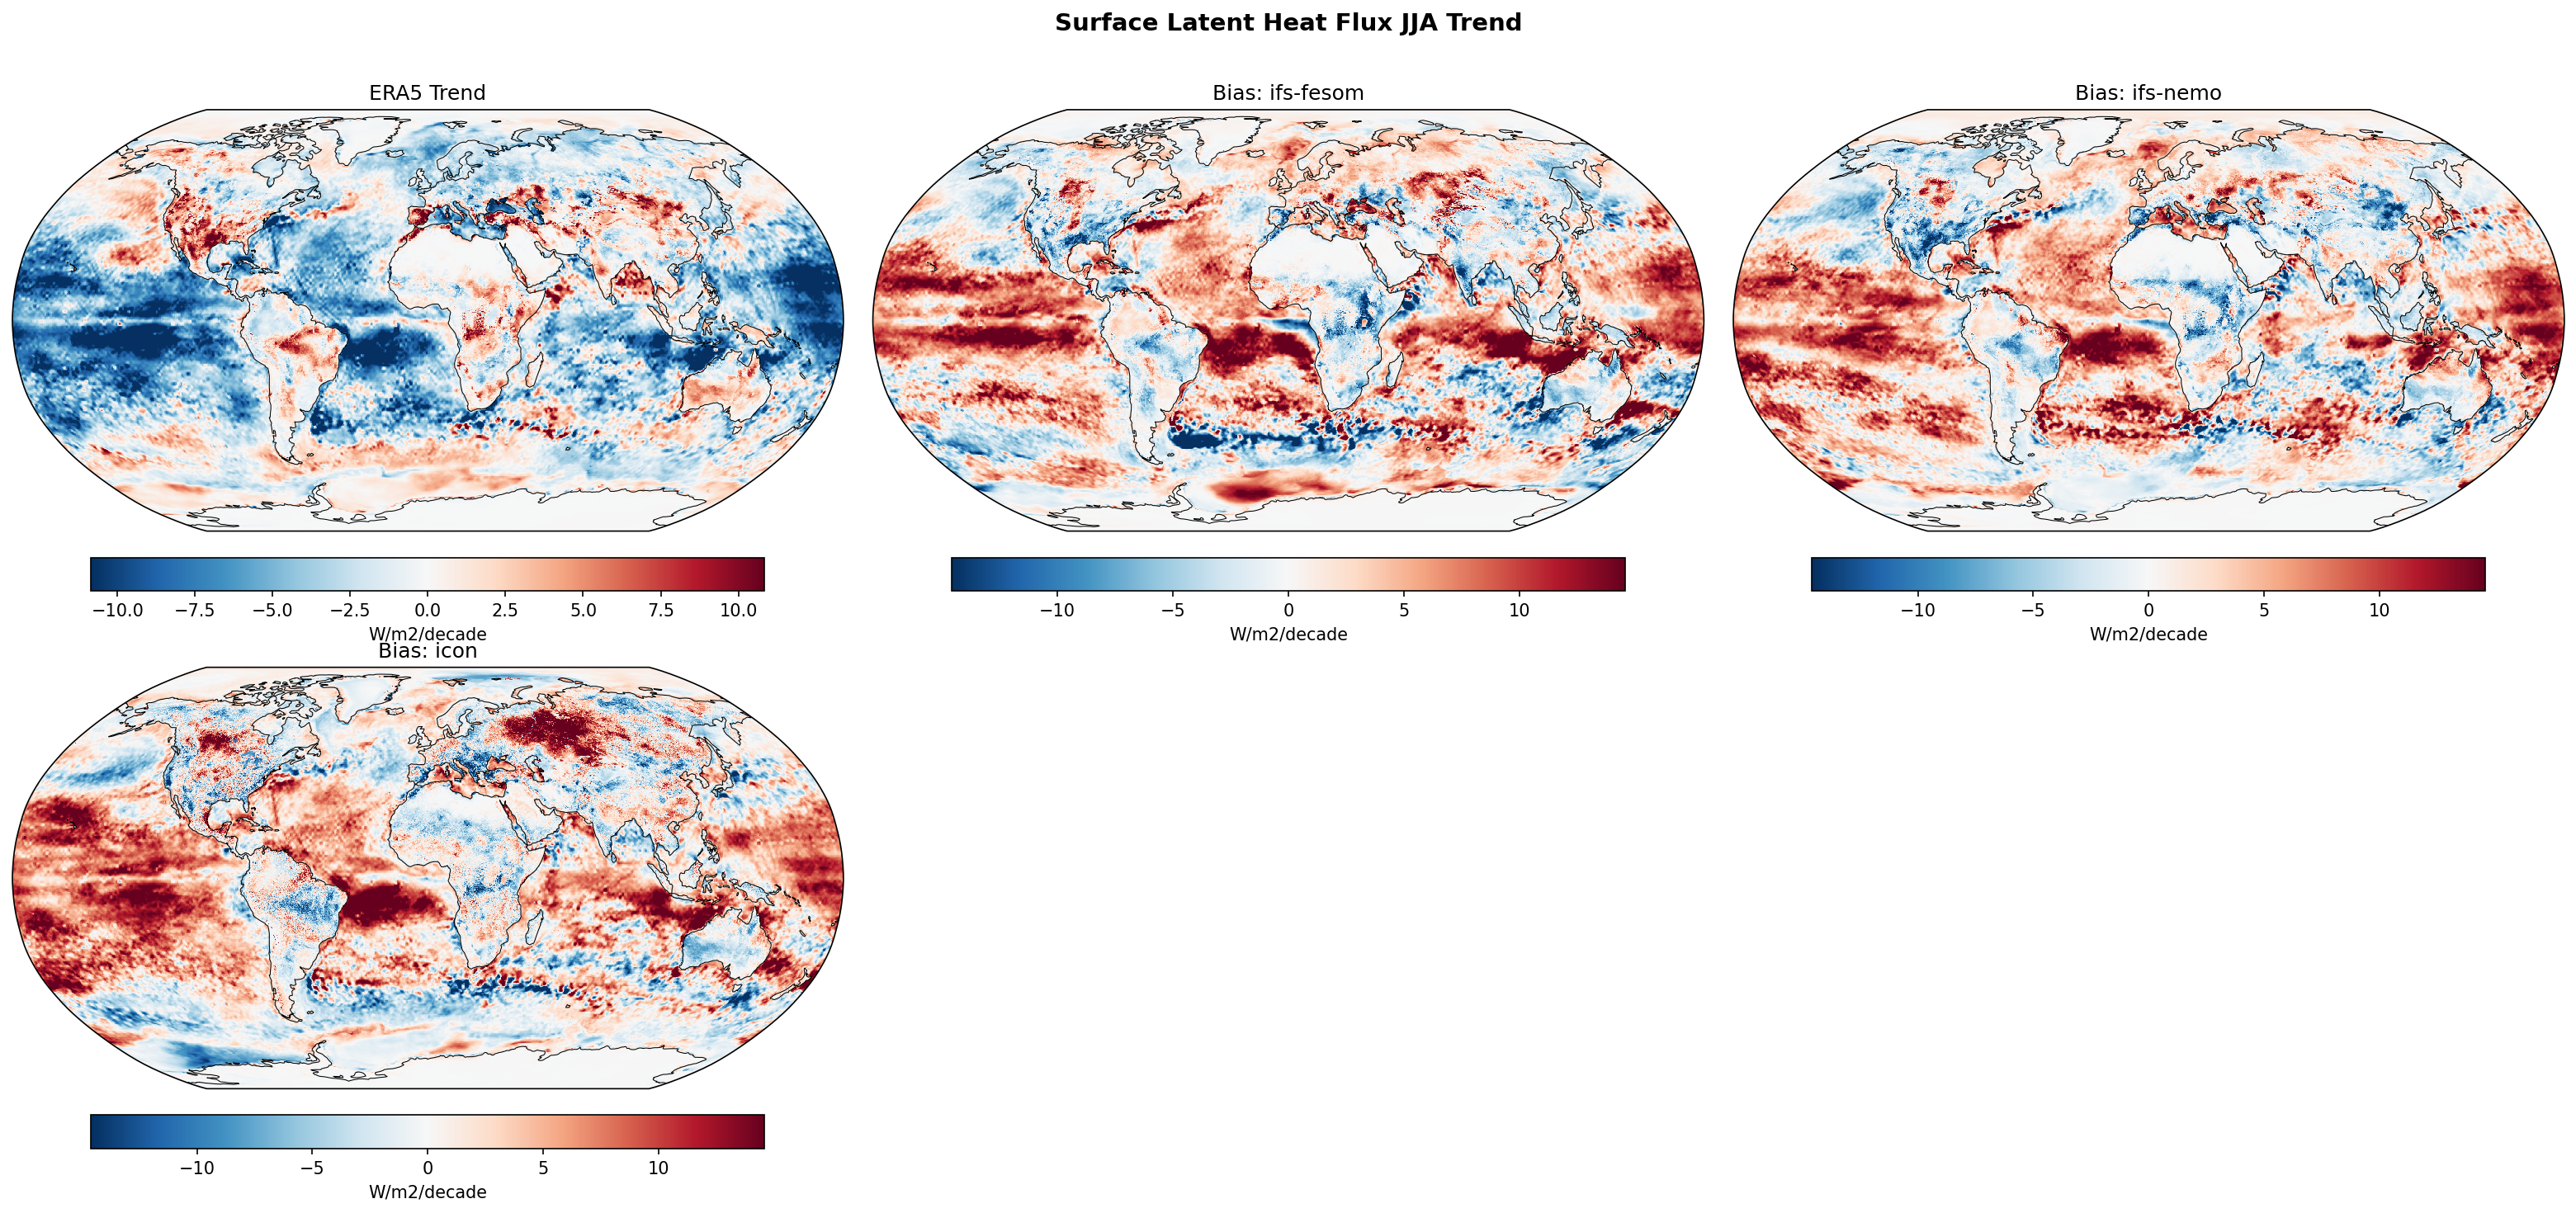
| Variables | avg_slhtf |
|---|---|
| Models | ifs-fesom, ifs-nemo, icon |
| Reference Dataset | ERA5 |
| Units | W/m2/decade |
| Period | 1990–2014 |
Summary high
This diagnostic evaluates linear trends in JJA Surface Latent Heat Flux (SLHF) over the 1990–2014 period, comparing ERA5 reanalysis with three high-resolution coupled models (IFS-FESOM, IFS-NEMO, ICON). The analysis highlights a significant divergence where models generally simulate increasing SLHF trends while observations show widespread decreases.
Key Findings
- ERA5 displays widespread negative SLHF trends (blue, decreasing flux) over large portions of the global ocean, particularly in the North Pacific and North Atlantic, likely associated with internal variability phases.
- All three models exhibit a dominant positive trend bias (red) globally, indicating they simulate stronger increases (or weaker decreases) in latent heat flux than observed.
- ICON shows the strongest magnitude of positive bias, particularly in the tropics and Southern Hemisphere, exceeding 10 W/m²/decade in bias in many regions.
- IFS-NEMO and IFS-FESOM show very similar large-scale bias patterns, though IFS-NEMO locally differs in the North Atlantic Gulf Stream region.
Spatial Patterns
The observational baseline (ERA5) is characterized by negative trends (blue) in the subtropical gyres of the North Pacific and North Atlantic, and parts of the Southern Ocean. In contrast, the bias maps for all models are overwhelmingly red (positive bias). Specifically, in the Tropical Pacific where ERA5 shows cooling/flux reduction trends consistent with the negative phase of the Interdecadal Pacific Oscillation (IPO) during this period, the models (which do not phase-lock to historical internal variability) likely simulate a forced warming trend, resulting in a strong positive bias.
Model Agreement
There is high inter-model agreement on the sign of the bias (positive relative to ERA5) across the vast majority of the global ocean. The IFS-FESOM and IFS-NEMO biases are structurally similar, though IFS-NEMO shows a localized negative bias patch off the US East Coast (Gulf Stream extension) where IFS-FESOM is positive. ICON is an outlier in terms of amplitude, showing a more intense widespread positive bias than the IFS variants.
Physical Interpretation
The primary driver of the observed discrepancies is likely the mismatch in multi-decadal internal variability. The 1990–2014 analysis period encompasses the 'global warming hiatus,' characterized by strengthened trade winds and suppressed surface warming (and thus lower evaporation trends) in the Pacific. Free-running coupled models generate their own internal variability phases which do not synchronize with historical observations; thus, they likely reflect the background forced warming signal (increasing latent heat flux), leading to the systematic positive trend bias against the variability-dominated observational record.
Caveats
- The 25-year period is relatively short and heavily influenced by internal climate variability (e.g., IPO/PDO), making it difficult to disentangle model physics errors from simple phase mismatches in uninitialized simulations.
- Trends in reanalysis surface fluxes can sometimes be influenced by changes in the observing system over time.
Surface Net Longwave Radiation Annual Linear Trend
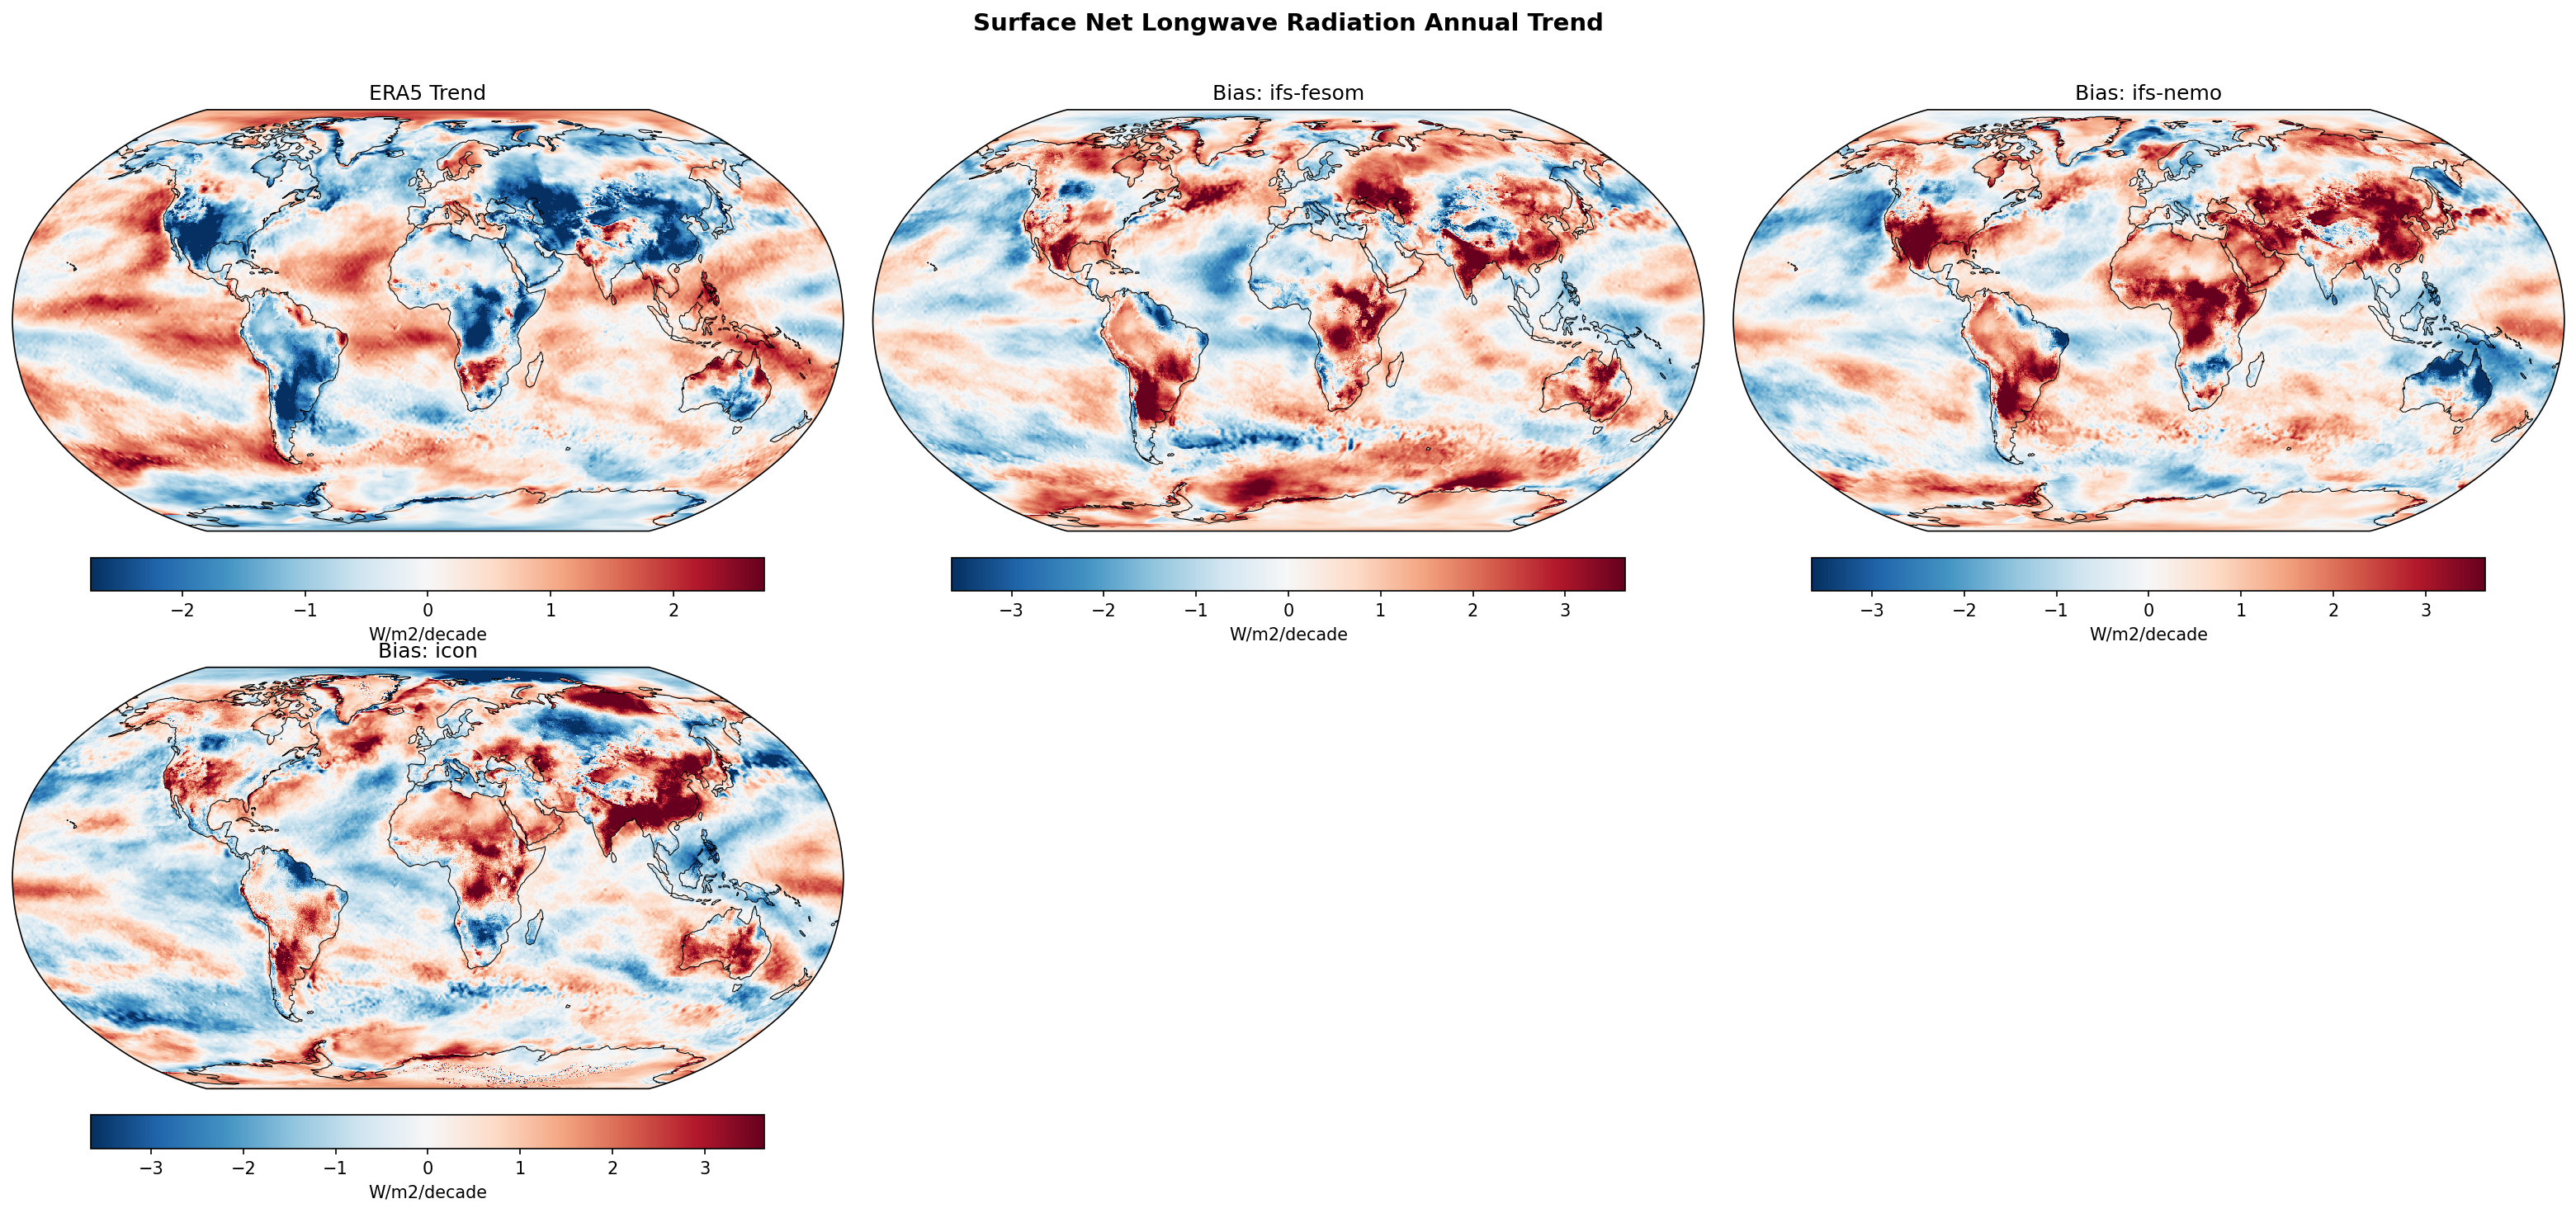
| Variables | avg_snlwrf |
|---|---|
| Models | ifs-fesom, ifs-nemo, icon |
| Reference Dataset | ERA5 |
| Units | W/m2/decade |
| Period | 1990–2014 |
| ifs-fesom | Global Mean Trend: 0.32 · Global Mean Trend Diff: 0.29 · Trend Rmse: 1.32 |
| ifs-nemo | Global Mean Trend: 0.34 · Global Mean Trend Diff: 0.31 · Trend Rmse: 1.34 |
| icon | Global Mean Trend: 0.12 · Global Mean Trend Diff: 0.10 · Trend Rmse: 1.37 |
Summary high
This figure evaluates annual linear trends in Surface Net Longwave Radiation (1990–2014) for three DestinE models against ERA5 reanalysis. While ERA5 exhibits widespread negative trends over global land masses (indicative of surface warming increasing upwelling radiation), all models consistently show positive trend biases over these regions, underestimating the reduction in net longwave energy at the surface.
Key Findings
- ERA5 shows dominant negative trends in surface net longwave radiation over major land masses (North America, Eurasia, Southern Africa) and positive trends over parts of the tropical oceans.
- All three models (IFS-FESOM, IFS-NEMO, ICON) exhibit systematic positive trend biases over land, particularly in the Amazon, Central Africa, and high-latitude Eurasia, meaning they fail to capture the magnitude of the negative trend observed in ERA5.
- IFS-FESOM and IFS-NEMO show nearly identical bias patterns over land, reflecting their shared atmospheric component, while ICON shows a similar spatial distribution of errors but with a significantly lower global mean trend difference (0.095 vs ~0.3 W/m²/decade).
- Biases over the oceans are smaller and more spatially heterogeneous, with mixed positive and negative patches, particularly in the Southern Ocean and tropical Pacific.
Spatial Patterns
The most prominent feature is the land-sea contrast in the observational trends (negative over land, mixed/positive over ocean) and the inverse pattern in the model biases. The models exhibit strong positive trend differences (red) over the Amazon, Congo Basin, Southeast Asia, and boreal land regions. In the Southern Ocean, IFS-FESOM and IFS-NEMO show slight negative biases, while ICON shows mixed signals.
Model Agreement
Inter-model agreement is high regarding the sign and location of errors over land. The IFS-FESOM and IFS-NEMO biases are nearly indistinguishable over continents, confirming that the atmospheric physics (IFS) dominates the surface radiation budget response. ICON shares these regional deficiencies but achieves a better global aggregate agreement with ERA5 trends.
Physical Interpretation
Surface Net Longwave Radiation is the balance between downwelling (atmosphere to surface) and upwelling (surface emission) flux. The negative trends in ERA5 over land likely reflect surface warming (increasing T^4 emission/upwelling flux) outpacing increases in atmospheric back-radiation. The models' positive biases (Model trend > Obs trend) imply that they either underestimate the rate of land surface warming or overestimate the increasing trend in downwelling longwave radiation (e.g., due to excessive water vapor feedback or increasing cloud cover). The concentrated positive biases over tropical rainforests suggest specific issues with hydrological cycle feedbacks or cloud radiative effects in deep convection zones.
Caveats
- Trends are calculated over a relatively short 25-year period (1990-2014), which may be influenced by internal variability (e.g., ENSO phases).
- ERA5 is a reanalysis product and relies on its own underlying model physics, so 'biases' are technically differences relative to the reanalysis rather than direct instrument observations.
Surface Net Longwave Radiation DJF Linear Trend
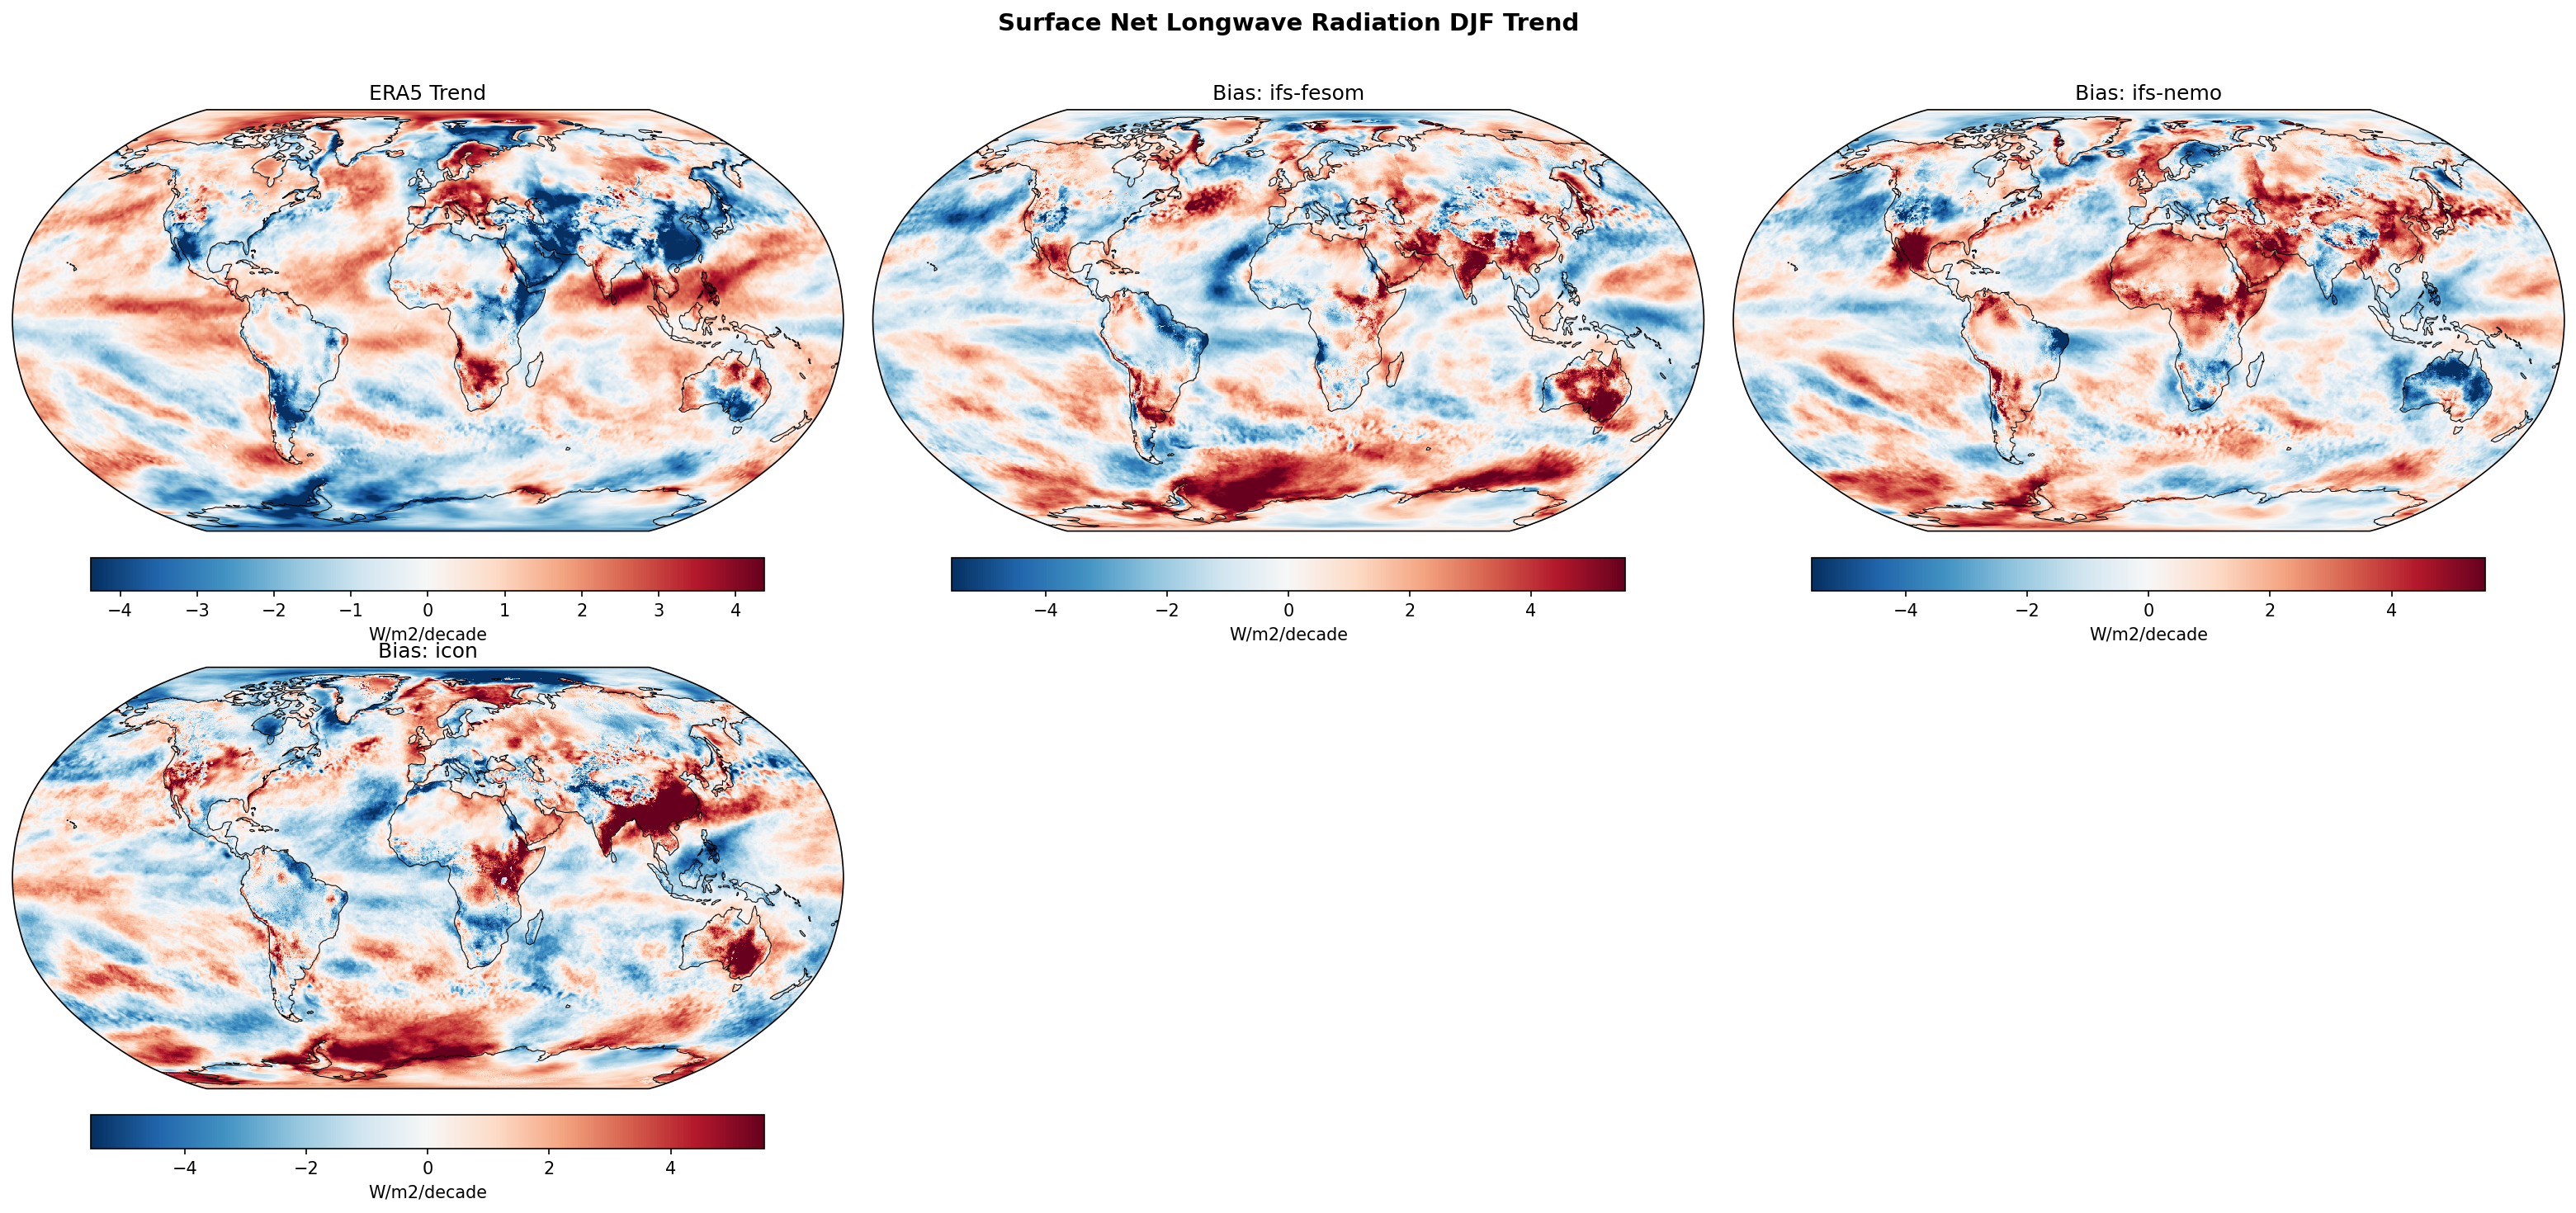
| Variables | avg_snlwrf |
|---|---|
| Models | ifs-fesom, ifs-nemo, icon |
| Reference Dataset | ERA5 |
| Units | W/m2/decade |
| Period | 1990–2014 |
Summary high
This figure evaluates the linear trend (1990–2014) of Surface Net Longwave Radiation during boreal winter (DJF) for three DestinE models against ERA5 reanalysis. The models generally exhibit positive trend biases (red), indicating they simulate a greater increase (or smaller decrease) in net energy fluxes into the surface than observed, particularly over Southern Hemisphere land masses and the Southern Ocean.
Key Findings
- IFS-FESOM and IFS-NEMO show nearly identical bias patterns, suggesting the atmospheric component (IFS) dominates the surface longwave radiative trend errors rather than the ocean formulation.
- Strong positive trend biases (Model > Obs) are observed in the Southern Ocean for the IFS models, implying they underestimate the negative trends seen in ERA5 (likely associated with surface warming/ice loss increasing upward emission) or overestimate downwelling radiation trends.
- ICON displays a distinct, intense positive trend bias over the Indian subcontinent and Himalayas, differing significantly from the IFS models in this region.
- All models show positive biases over Australia and Southern Africa, suggesting a systematic discrepancy in how surface radiative balances are evolving in these semi-arid regions during austral summer.
Spatial Patterns
ERA5 shows a complex pattern of positive and negative trends, with notable negative trends (surface losing more energy) over the North Atlantic and parts of the Southern Ocean. The models, conversely, are dominated by positive bias patches. The Southern Ocean bias is zonally elongated in the IFS models. ICON's bias is notably concentrated over South Asia and Australia. Biases are generally smaller over the tropical oceans compared to land and high latitudes.
Model Agreement
There is exceptionally high agreement between IFS-FESOM and IFS-NEMO, confirming that the coupled ocean model has little influence on the 25-year trend of surface LW radiation. ICON shares broad hemispheric features (e.g., positive biases in SH land) but diverges strongly in magnitude and specific regional patterns (e.g., Asia), highlighting differences in atmospheric physics parametrizations.
Physical Interpretation
Surface net longwave radiation trends are driven by the balance between increasing surface temperature (increasing upward emission, $L\uparrow$, leading to negative net trend) and changes in atmospheric greenhouse gases, water vapor, and clouds (increasing downward emission, $L\downarrow$, leading to positive net trend). The widespread positive biases (red) suggest the models generally predict a trend towards more energy entering the surface than ERA5. In the Southern Ocean, ERA5's negative trend likely reflects surface warming (ice loss) dominating; the models' positive bias implies they either underestimate this surface warming trend or simulate an excessive trend in downwelling radiation (possibly due to cloud cover feedbacks). The strong signal in ICON over India could relate to specific biases in aerosol-radiation interactions or cloud cover trends in that region.
Caveats
- Trends over a 25-year period (1990-2014) can be heavily influenced by decadal internal variability (e.g., ENSO, IPO) and may not purely reflect forced climate change signals.
- ERA5 surface radiative fluxes are model-derived products (reanalysis) rather than direct observations, meaning biases represent differences between the DestinE models and the IFS-based ERA5 physics.
- The sign convention assumes positive trends mean net energy gain by the surface; interpretation depends on whether $L\downarrow$ or $L\uparrow$ dominates the change.
Surface Net Longwave Radiation JJA Linear Trend
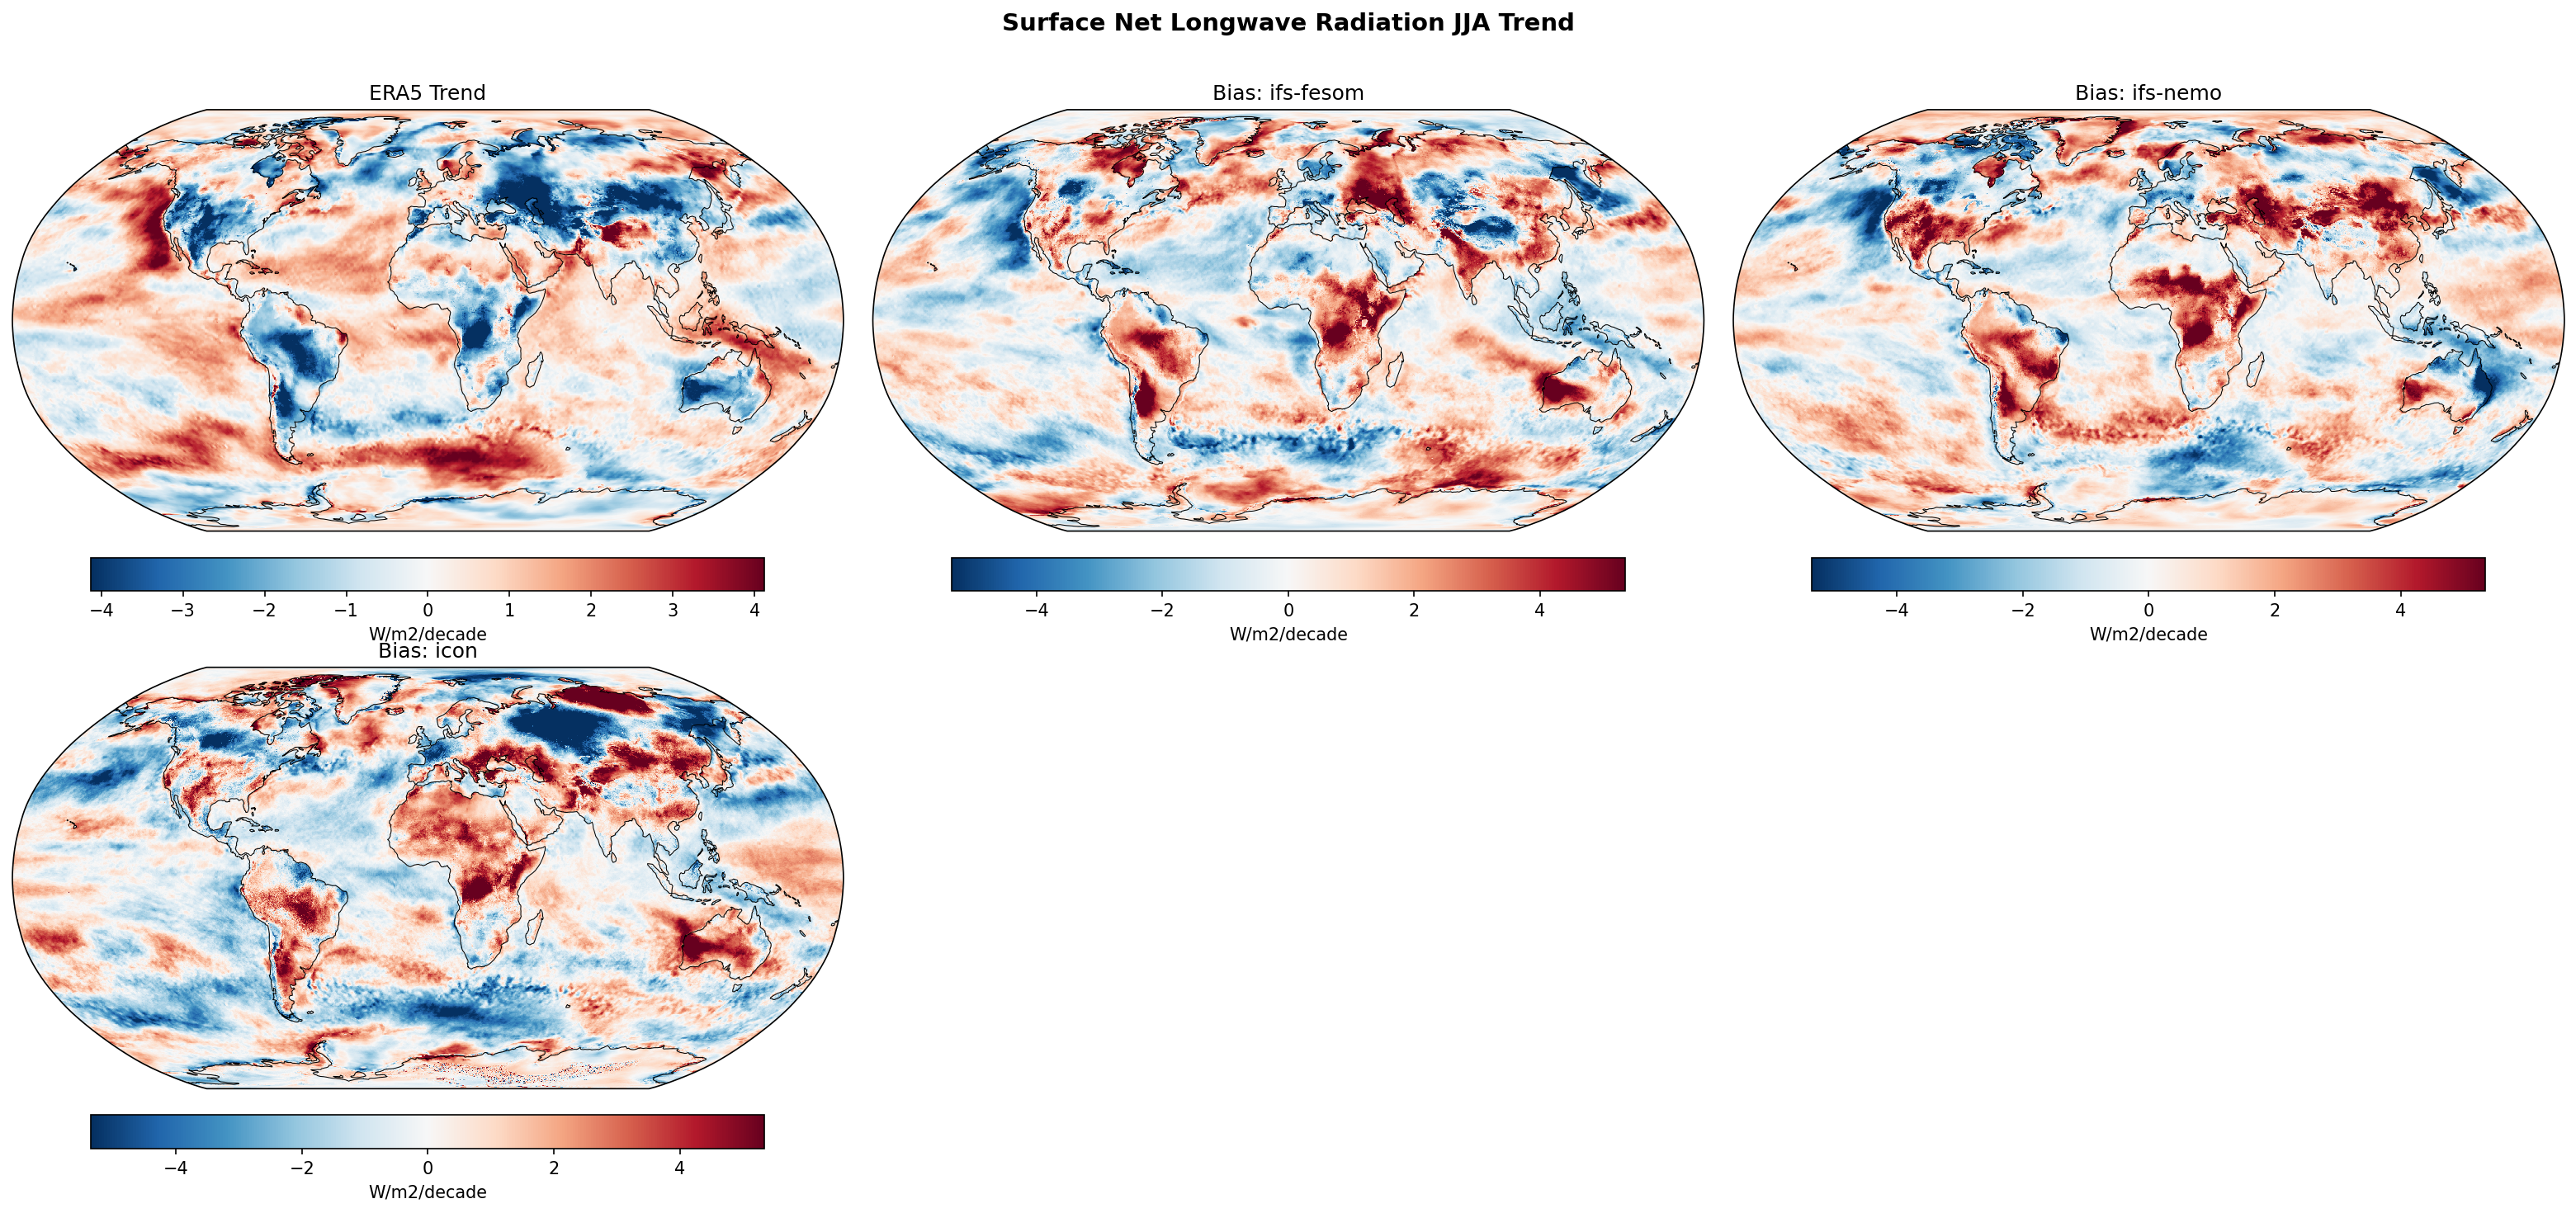
| Variables | avg_snlwrf |
|---|---|
| Models | ifs-fesom, ifs-nemo, icon |
| Reference Dataset | ERA5 |
| Units | W/m2/decade |
| Period | 1990–2014 |
Summary high
This figure displays the 1990–2014 linear trends for JJA Surface Net Longwave Radiation, comparing ERA5 reanalysis with three high-resolution models (IFS-FESOM, IFS-NEMO, ICON). The analysis reveals a systematic discrepancy where models fail to capture the strong negative trends observed over major land masses in the reanalysis.
Key Findings
- ERA5 shows widespread negative trends (blue, -2 to -4 W/m²/decade) over Eurasia, South America, and Southern Africa, likely driven by surface warming increasing outgoing longwave radiation.
- All three models exhibit strong positive biases (red) over these same continental regions, indicating they significantly underestimate the magnitude of the negative trend seen in ERA5.
- IFS-FESOM and IFS-NEMO display nearly identical bias patterns, suggesting the atmospheric component (IFS) is the dominant driver of these surface radiation errors, with little sensitivity to the ocean model choice.
- ICON shares the broad continental positive biases but shows distinct negative biases (blue) over the North Atlantic and differences in the Southern Ocean compared to the IFS models.
Spatial Patterns
The spatial structure of the model biases over land is strikingly similar to the inverse of the ERA5 trend map; regions with the strongest negative trends in observations (e.g., Russia, Brazil) correspond to the strongest positive biases in the models.
Model Agreement
There is extremely high agreement between the two IFS variants. ICON agrees with the IFS models on the sign of the land bias (positive) but diverges in oceanic regions, particularly showing a stronger negative bias in the North Atlantic.
Physical Interpretation
Surface Net Longwave is typically defined as Downwelling minus Upwelling. The negative trend in ERA5 suggests Upwelling (dependent on surface temperature) is increasing faster than Downwelling (dependent on atmospheric temperature/humidity/clouds). The positive bias in models implies they either underestimate the rate of land surface warming (limiting the increase in outgoing radiation) or overestimate trends in atmospheric opacity (humidity/clouds) which increases back-radiation.
Caveats
- The 25-year period (1990-2014) is relatively short for distinguishing long-term climate trends from decadal variability.
- ERA5 surface radiative fluxes are model-derived products and may contain their own biases compared to direct station observations.
Surface Net Longwave Radiation (Clear-Sky) Annual Linear Trend
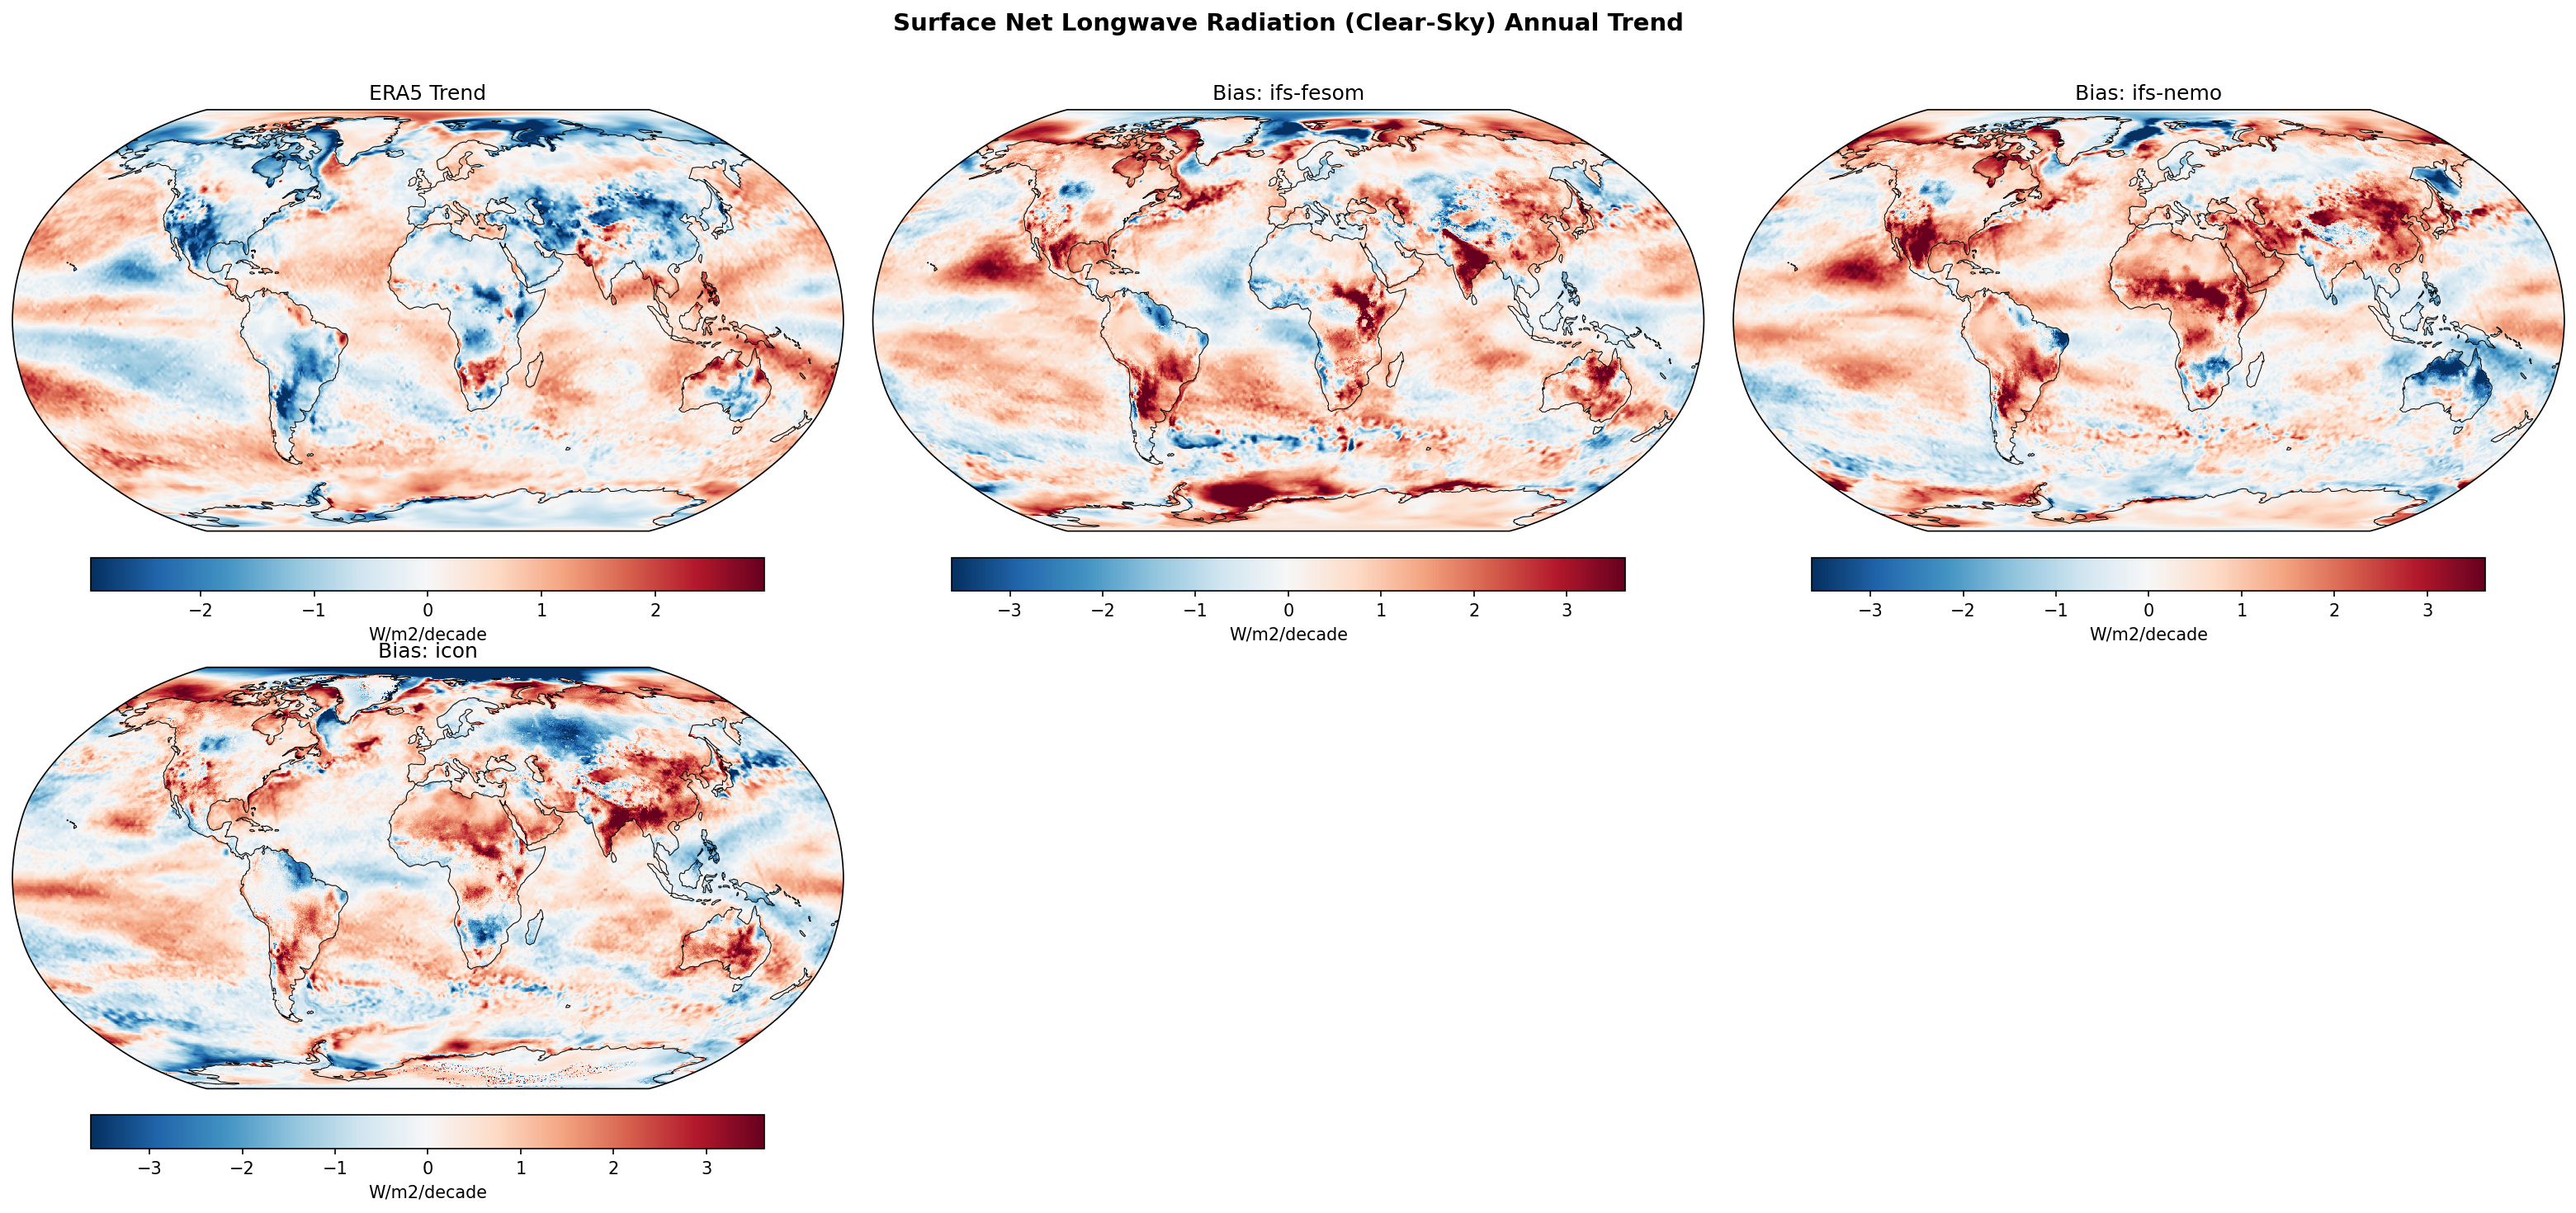
| Variables | avg_snlwrfcs |
|---|---|
| Models | ifs-fesom, ifs-nemo, icon |
| Reference Dataset | ERA5 |
| Units | W/m2/decade |
| Period | 1990–2014 |
| ifs-fesom | Global Mean Trend: 0.55 · Global Mean Trend Diff: 0.47 · Trend Rmse: 1.16 |
| ifs-nemo | Global Mean Trend: 0.50 · Global Mean Trend Diff: 0.43 · Trend Rmse: 1.15 |
| icon | Global Mean Trend: 0.35 · Global Mean Trend Diff: 0.27 · Trend Rmse: 1.14 |
Summary high
This figure evaluates annual linear trends (1990–2014) in clear-sky surface net longwave radiation for three DestinE models (IFS-FESOM, IFS-NEMO, ICON) compared to ERA5 reanalysis. While ERA5 shows mixed trends with significant cooling (negative net LW trend) over land, all three models exhibit a systematic positive trend bias, predicting increasing net longwave energy at the surface relative to observations.
Key Findings
- All models overestimate the global mean trend (0.35–0.55 W/m²/decade) compared to the minimal trend in ERA5 (~0.08 W/m²/decade), resulting in global biases of +0.27 to +0.47 W/m²/decade.
- A pervasive positive bias (red) exists over almost all non-polar land masses, particularly North America, Eurasia, and the Amazon, where models show increasing net LW trends while ERA5 often shows decreasing trends.
- In the Arctic, models exhibit a negative bias (blue), indicating they underestimate the magnitude of the strong positive trend (increasing net radiation) seen in ERA5.
- ICON displays the lowest global mean trend bias (+0.27 W/m²/decade) compared to IFS-FESOM (+0.47) and IFS-NEMO (+0.43), though spatial bias patterns remain similar.
- Trend RMSE values are consistent across all models (~1.14–1.16 W/m²/decade), suggesting similar levels of local deviation from the reanalysis.
Spatial Patterns
ERA5 (top-left) shows strong positive trends (red) in the Arctic—consistent with Arctic Amplification—and widespread negative trends (blue) over mid-latitude land. The model bias maps are dominated by red over land (tropical and mid-latitudes), indicating the models trend towards less effective radiative cooling than ERA5. Conversely, the Arctic shows blue biases, meaning model trends there are less positive than the reanalysis.
Model Agreement
There is high inter-model agreement in spatial patterns. IFS-FESOM and IFS-NEMO are nearly identical, suggesting the atmospheric physics (IFS) dominates over ocean coupling differences. ICON shares the main land/Arctic bias structures but with slightly reduced magnitudes in the global mean.
Physical Interpretation
Surface net clear-sky longwave radiation is the balance between upward emission (dependent on skin temperature) and downward emission (dependent on atmospheric temperature and water vapor). The positive bias over land suggests that in the models, the downward component (atmospheric emission) is increasing faster relative to the upward component than in ERA5. This could result from a stronger water vapor feedback (moistening trend) in the models or a weaker surface skin warming trend compared to the air temperature trend. In the Arctic, the negative bias suggests models underestimate the rapid increase in downward longwave radiation associated with the intense warming and moistening seen in ERA5.
Caveats
- ERA5 trends themselves may contain artifacts from changing observing systems over the 1990–2014 period.
- Clear-sky fluxes are theoretical in cloudy regions; sampling differences between model output and reanalysis generation could influence trends.
Surface Net Longwave Radiation (Clear-Sky) DJF Linear Trend
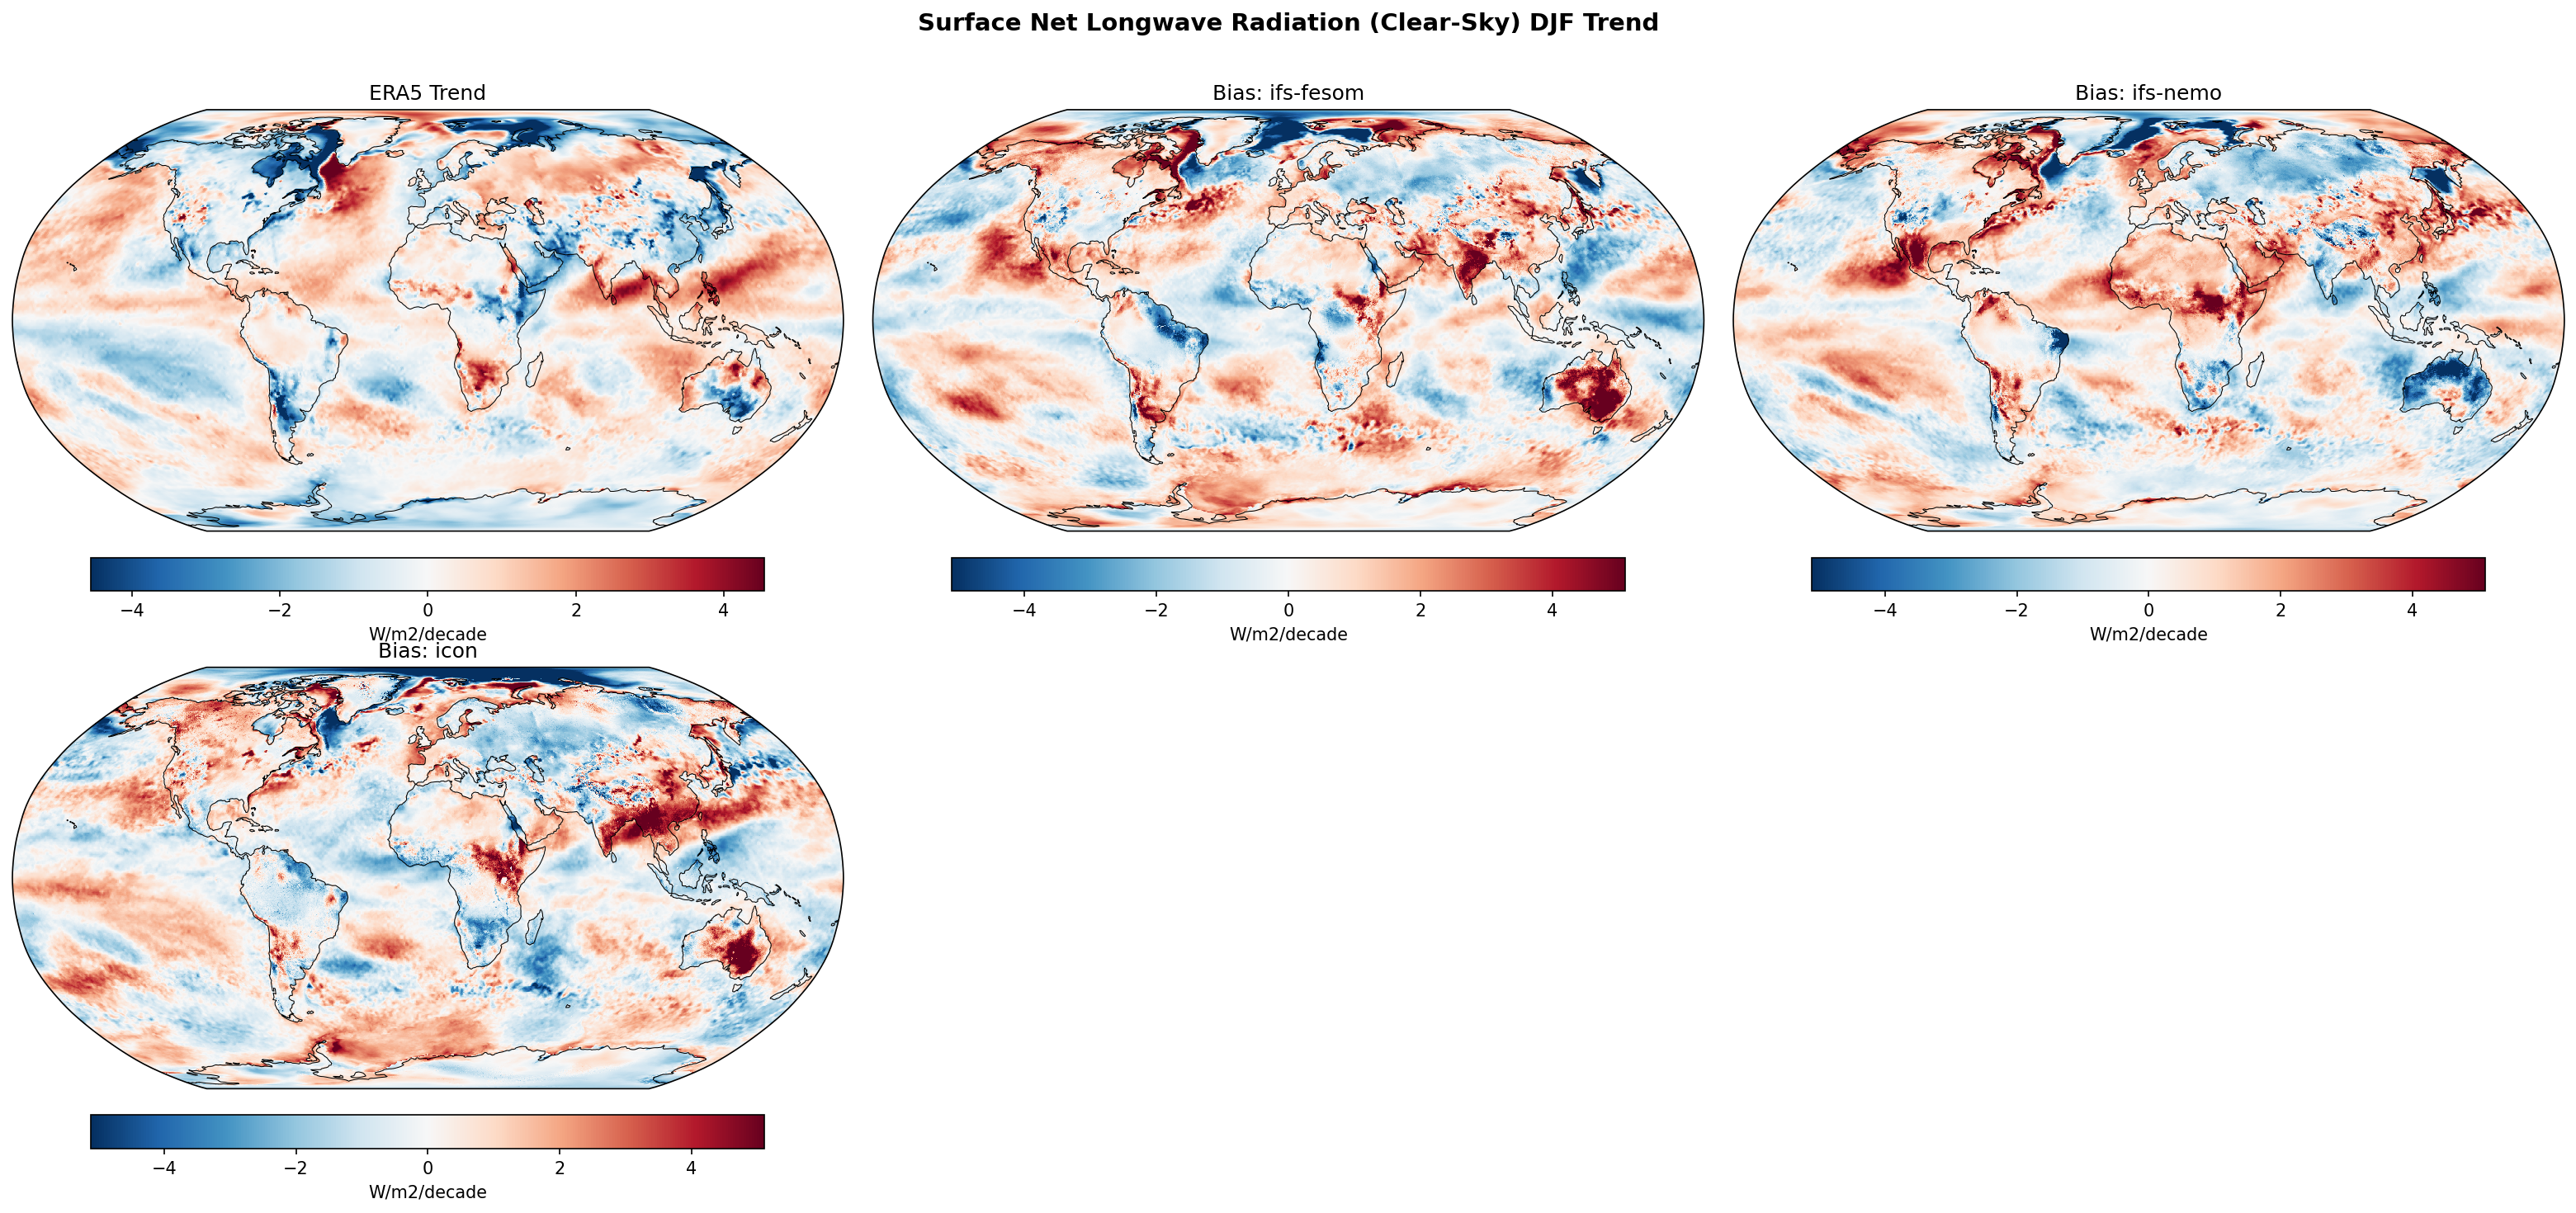
| Variables | avg_snlwrfcs |
|---|---|
| Models | ifs-fesom, ifs-nemo, icon |
| Reference Dataset | ERA5 |
| Units | W/m2/decade |
| Period | 1990–2014 |
Summary high
The figure illustrates linear trends (1990–2014) in Surface Net Longwave Radiation (Clear-Sky) for the DJF season, comparing ERA5 reanalysis with three high-resolution coupled models (IFS-FESOM, IFS-NEMO, ICON). While ERA5 shows distinct negative trends in sea-ice loss regions (Barents/Kara Seas), all models exhibit widespread positive trend biases over continental landmasses, particularly in the Southern Hemisphere.
Key Findings
- Systematic positive trend biases (red) are observed over major land regions (Australia, South America, Southern Africa, and parts of Asia) in all three models, indicating they simulate a greater increase (or smaller decrease) in net clear-sky longwave energy entering the surface than ERA5.
- IFS-FESOM and IFS-NEMO show nearly identical bias patterns, confirming that the atmospheric component (IFS) dominates the surface clear-sky radiative budget trends, with the choice of ocean model (FESOM vs. NEMO) having negligible impact.
- ICON displays a distinct, intense positive trend bias over East Asia and China that is much weaker or absent in the IFS-based models.
- ERA5 exhibits strong negative trends (blue) in the Barents and Kara Seas, consistent with enhanced surface emission (LW Up) due to sea-ice loss and surface warming; the models show mixed biases here, suggesting discrepancies in the rate or spatial footprint of sea-ice retreat.
Spatial Patterns
ERA5 shows a complex pattern with notable negative trends in the Arctic (sea ice loss regions) and mixed trends over land. In contrast, the model bias maps are dominated by large-scale positive biases over land surfaces (Australia, Amazon, Southern Africa, Himalayas). Oceanic biases are generally weaker and more spatially incoherent, except for specific regions in the North Atlantic and Southern Ocean.
Model Agreement
There is exceptionally high agreement between IFS-FESOM and IFS-NEMO, indicating robustness across ocean couplings for this atmospheric-driven variable. ICON shares the broad land-bias features but diverges regionally, particularly over East Asia and in the North Atlantic structures, indicating differences in atmospheric physics or land-surface coupling.
Physical Interpretation
Surface Net Longwave (Clear-Sky) is the balance between downward atmospheric emission and upward surface emission ($LW_{down} - LW_{up}$). A positive trend bias implies the models have either a stronger increase in $LW_{down}$ (due to excessive atmospheric warming or moistening) or a weaker increase in $LW_{up}$ (weaker surface skin temperature warming) compared to ERA5. The pervasive positive bias over land suggests the models may be underestimating the rate of surface warming (which would increase $LW_{up}$ and reduce Net LW) or overestimating water vapor feedback trend compared to the reanalysis.
Caveats
- Trends are calculated over a relatively short 25-year period (1990-2014), making them sensitive to decadal variability.
- Clear-sky diagnostics rely on sampling methodologies that may differ between the models and the reanalysis product.
Surface Net Longwave Radiation (Clear-Sky) JJA Linear Trend
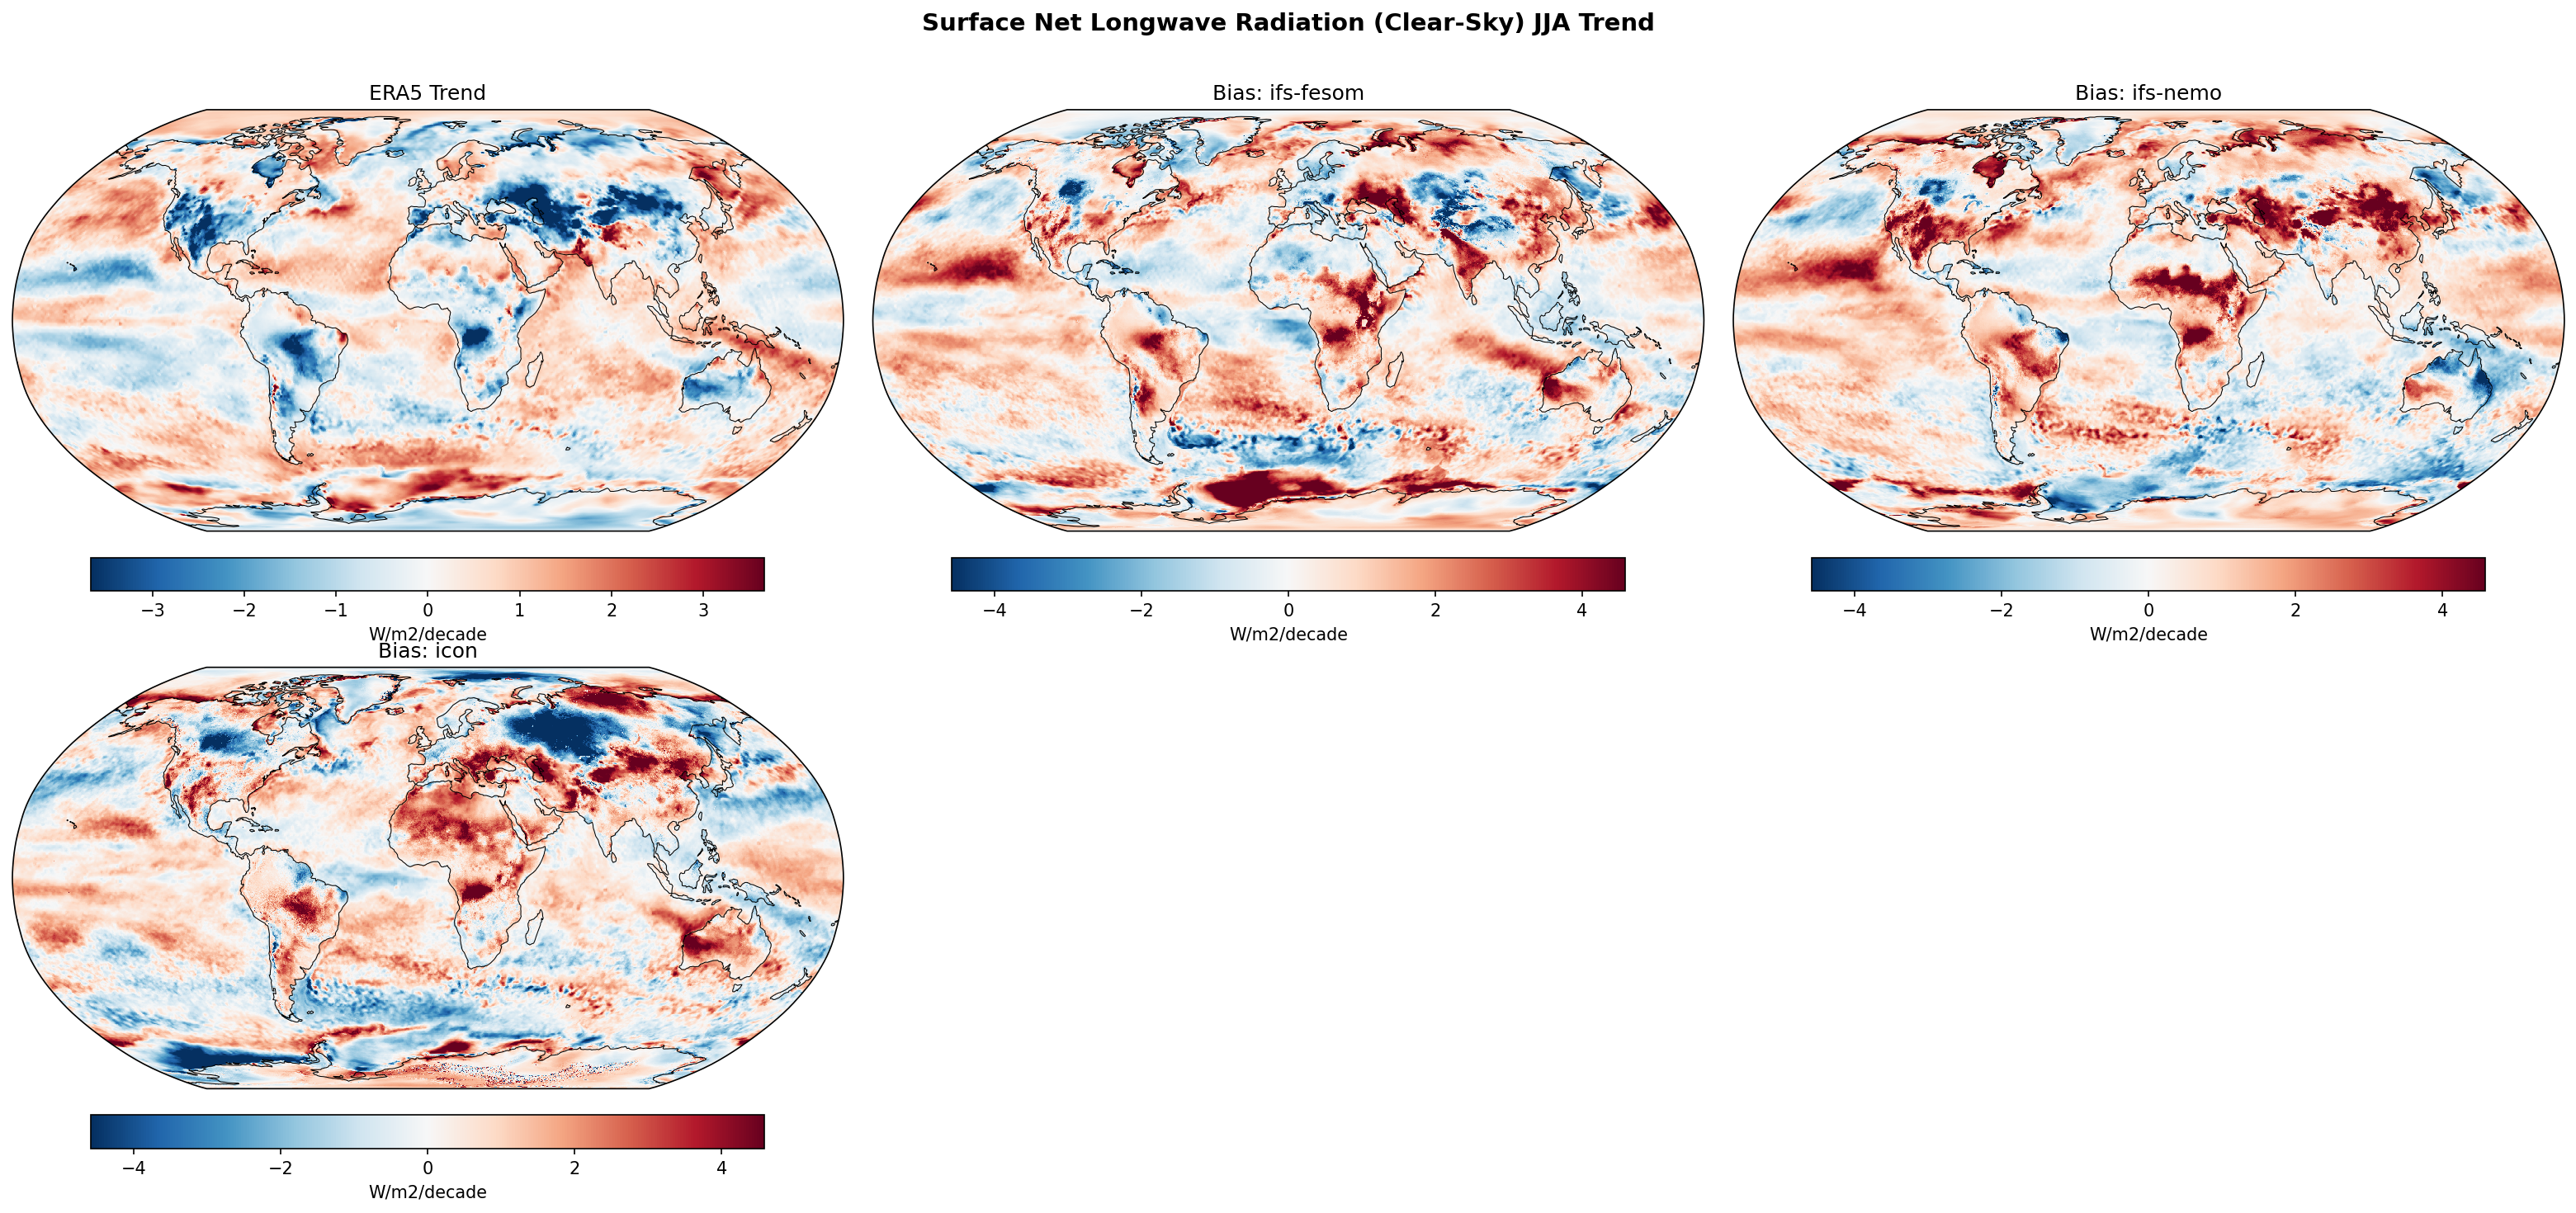
| Variables | avg_snlwrfcs |
|---|---|
| Models | ifs-fesom, ifs-nemo, icon |
| Reference Dataset | ERA5 |
| Units | W/m2/decade |
| Period | 1990–2014 |
Summary high
This diagnostic evaluates 1990–2014 linear trends in JJA surface clear-sky net longwave radiation, comparing ERA5 reanalysis against IFS-FESOM, IFS-NEMO, and ICON. The models exhibit widespread positive trend biases over land, indicating they generally underestimate the rate at which the land surface's net radiative cooling has increased (become more negative) compared to ERA5.
Key Findings
- ERA5 displays strong negative trends (-2 to -3 W/m²/decade) over Northern Hemisphere landmasses (North America, Eurasia) and tropical rainforests, consistent with surface warming increasing upward longwave emission.
- All three models show widespread positive biases (red, +2 to +4 W/m²/decade) over North America, Europe, the Amazon, and Central Africa, meaning they fail to reproduce the magnitude of the negative trends seen in ERA5.
- IFS-FESOM and IFS-NEMO are nearly identical, confirming that the atmospheric model (IFS) dictates surface radiative trends with minimal influence from the ocean coupling (FESOM vs. NEMO) over land.
- ICON diverges from the IFS models over Northern Eurasia/Siberia, where it shows a negative bias (blue) compared to the positive bias in IFS, and over the Southern Ocean.
Spatial Patterns
The dominant signal is land-sea contrast in the trends. ERA5 shows distinct darkening (negative trend) over continents in summer. The model biases are spatially coherent over these continents. Notably, the positive bias over the Amazon and Central Africa is intense in all models. Over oceans, biases are smaller and patchier, though ICON shows a distinct zonal structure in the Southern Hemisphere high latitudes not seen in the IFS models.
Model Agreement
High agreement between IFS-FESOM and IFS-NEMO (correlation ~1 over land). ICON agrees with IFS on the sign of the bias over North America and the Tropics but disagrees over Russia/Siberia and parts of the Southern Ocean. All models disagree with ERA5 regarding the magnitude of land-surface radiative trend evolution.
Physical Interpretation
Surface net clear-sky longwave radiation is a balance between upward emission (dependent on surface temperature, Ts^4) and downward emission (dependent on atmospheric water vapor and temperature). The negative trend in ERA5 suggests upward emission is increasing faster than downward emission (strong surface warming, potentially coupled with drying). The positive bias in models implies they either simulate less surface warming than ERA5 or a stronger increase in atmospheric humidity (greenhouse effect) which increases downward radiation, dampening the net cooling trend.
Caveats
- The 1990–2014 period is relatively short, so trends may be influenced by decadal variability (e.g., AMO, PDO) rather than purely forced climate change.
- Clear-sky fluxes are calculated diagnostics; methodological differences in how 'clear-sky' is defined or sampled between the reanalysis and free-running models could contribute to biases.
Surface Net Shortwave Radiation Annual Linear Trend

| Variables | avg_snswrf |
|---|---|
| Models | ifs-fesom, ifs-nemo, icon |
| Reference Dataset | ERA5 |
| Units | W/m2/decade |
| Period | 1990–2014 |
| ifs-fesom | Global Mean Trend: 0.28 · Global Mean Trend Diff: 0.34 · Trend Rmse: 2.69 |
| ifs-nemo | Global Mean Trend: 0.33 · Global Mean Trend Diff: 0.39 · Trend Rmse: 2.64 |
| icon | Global Mean Trend: 0.37 · Global Mean Trend Diff: 0.43 · Trend Rmse: 2.68 |
Summary high
All three high-resolution models show a globally positive trend in surface net shortwave radiation (0.28–0.37 W/m²/decade) that generally exceeds the trend in ERA5, characterized by distinct regional bias patterns largely shared across the models.
Key Findings
- Models underestimate the strong 'brightening' trend observed in ERA5 over Europe and East Asia, indicated by negative bias values in these regions.
- A prominent positive bias exists in the Tropical Pacific and Maritime Continent, where models fail to capture the strong negative trend (dimming) seen in ERA5.
- IFS-FESOM and IFS-NEMO exhibit nearly identical bias patterns, suggesting the atmospheric model component (IFS) drives these surface radiation trend errors rather than the ocean coupling.
- All models exhibit a positive global mean trend bias (approx. +0.3 to +0.4 W/m²/decade) relative to ERA5.
Spatial Patterns
ERA5 shows distinct brightening (positive trend) over Europe/North Atlantic and dimming (negative trend) over the Tropical Pacific and parts of the Southern Hemisphere. The models display a 'dipole' bias pattern: negative biases over Eurasia (underestimating brightening) and positive biases over the Tropical Pacific and Maritime Continent (overestimating brightening or failing to dim). Biases are also notable over the Amazon (negative) and parts of the Southern Ocean.
Model Agreement
There is very high agreement between IFS-FESOM and IFS-NEMO, indicating robustness to the ocean grid/model choice. ICON shows a very similar large-scale bias structure (Eurasian negative bias, Pacific positive bias) but differs slightly in magnitude and small-scale features in the Southern Ocean.
Physical Interpretation
The negative bias over Europe suggests the models may not fully capture the magnitude of surface brightening attributed to declining anthropogenic aerosols or associated cloud feedbacks during this period. The positive bias in the Tropical Pacific likely reflects the models' inability to reproduce the observed 1990–2014 La Niña-like cooling trend (and associated increased cloud cover/dimming), a common issue in coupled models often related to internal variability phasing (IPO) or thermostat mechanisms.
Caveats
- The analysis period (1990–2014) is relatively short, meaning trends are strongly influenced by internal decadal variability (e.g., IPO) rather than just forced climate change.
- ERA5 is a reanalysis product and may contain its own temporal inhomogeneities in radiation fluxes.
Surface Net Shortwave Radiation DJF Linear Trend
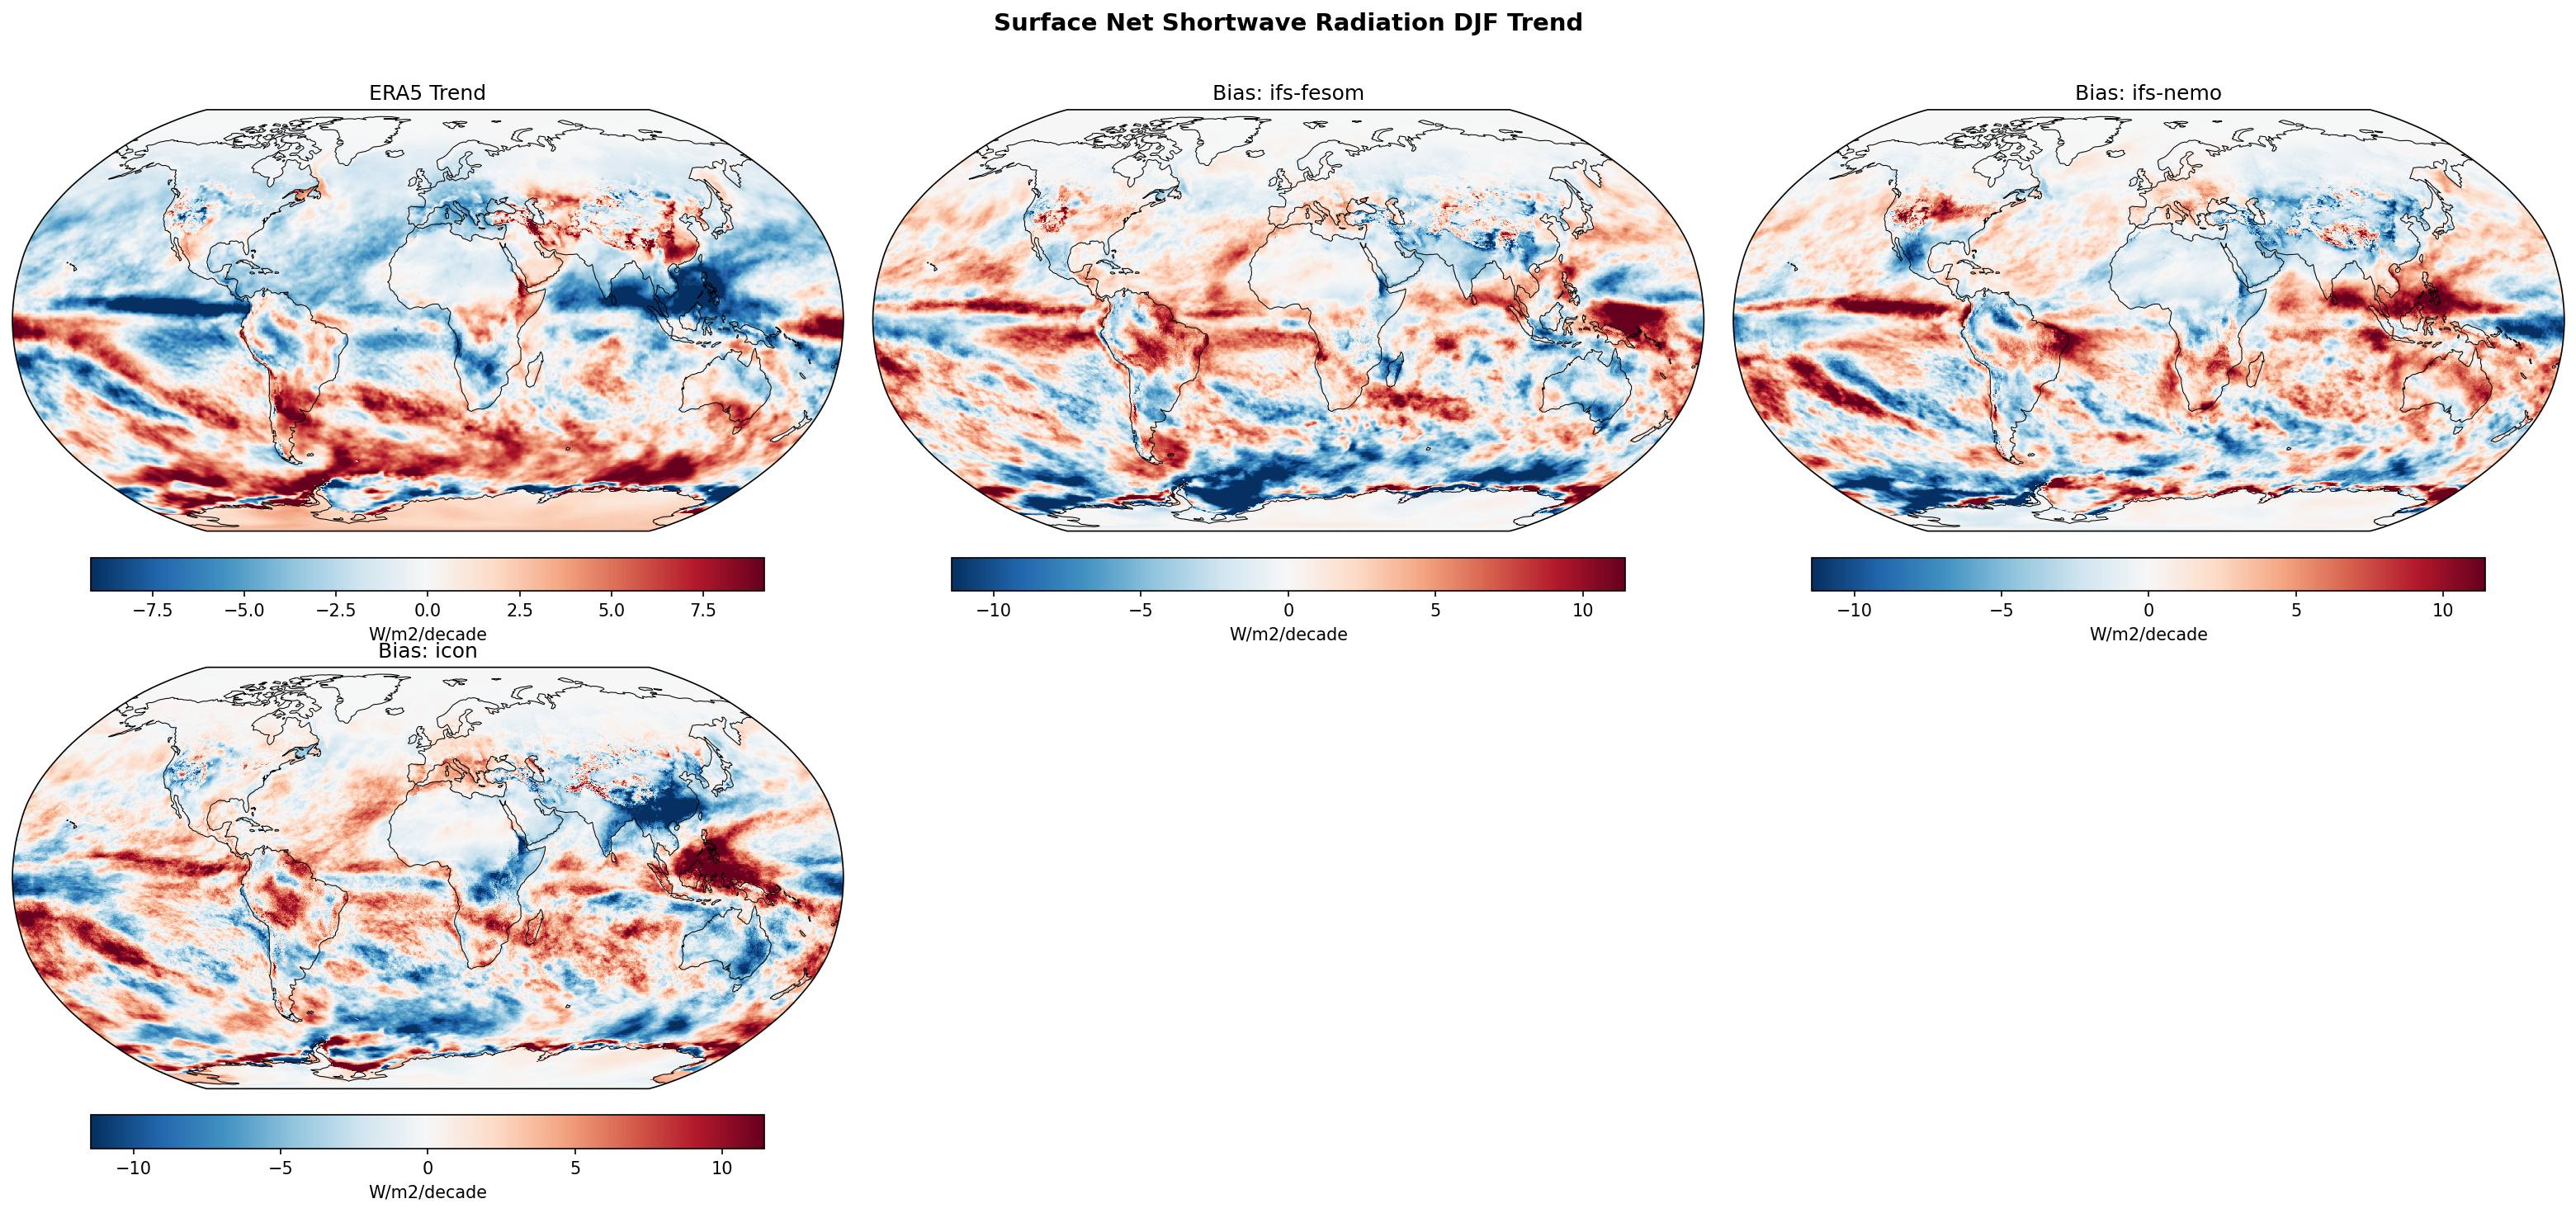
| Variables | avg_snswrf |
|---|---|
| Models | ifs-fesom, ifs-nemo, icon |
| Reference Dataset | ERA5 |
| Units | W/m2/decade |
| Period | 1990–2014 |
Summary high
This figure displays linear trends in DJF Surface Net Shortwave Radiation (SSR) for 1990–2014, revealing that IFS-based models exhibit a systemic positive trend bias (excessive brightening) over tropical landmasses, while ICON shows a negative trend bias (dimming) over East Asia compared to ERA5.
Key Findings
- IFS-FESOM and IFS-NEMO show strong positive trend biases (+5 to +10 W/m²/decade) over the Maritime Continent, Amazon, and Southern Africa, indicating they fail to capture the observed dimming or simulate excessive clearing trends.
- ICON displays a distinct negative trend bias over East Asia (China) and India, opposing the strong brightening signal observed in ERA5; this suggests ICON simulates dimming or lacks the observed reduction in aerosol optical depth/cloud cover.
- None of the models reproduce the strong observed zonal dipole trend in the Tropical Pacific (dimming in West, brightening in Central/East), leading to large-scale biases likely driven by mismatched phases of internal variability (e.g., ENSO).
Spatial Patterns
ERA5 shows a clear ENSO-like trend pattern in the Pacific and anthropogenic brightening over East Asia. The IFS models (FESOM/NEMO) are characterized by widespread positive trend differences (red) over the tropics and subtropics. ICON contrasts with a blue bias (negative trend difference) over the Northern Hemisphere continents, particularly Asia.
Model Agreement
There is very high agreement between IFS-FESOM and IFS-NEMO, indicating that the trend biases are driven by the shared atmospheric component (IFS physics) rather than the ocean model or coupling grid. ICON diverges significantly from the IFS models, particularly over Asia and the Southern Ocean.
Physical Interpretation
The discrepancies largely stem from two factors: 1) Internal Variability: Free-running coupled models have random ENSO phasing that does not match the specific 1990–2014 historical sequence, causing the large mismatches in the Tropical Pacific. 2) Forcing/Feedbacks: The negative bias in ICON over Asia suggests a different response to aerosol emissions (possibly too strong indirect effects or lacking recent emission reductions) compared to ERA5, which captures the 'brightening' effect. The positive bias in IFS suggests a tendency to dry out or reduce cloud cover over tropical land more than observed.
Caveats
- Trends over a short 25-year period are strongly influenced by internal decadal variability; mismatch in the Pacific is expected for free-running simulations and does not necessarily imply model physics errors.
- The analysis does not separate aerosol forcing contributions from cloud feedback trends.
Surface Net Shortwave Radiation JJA Linear Trend
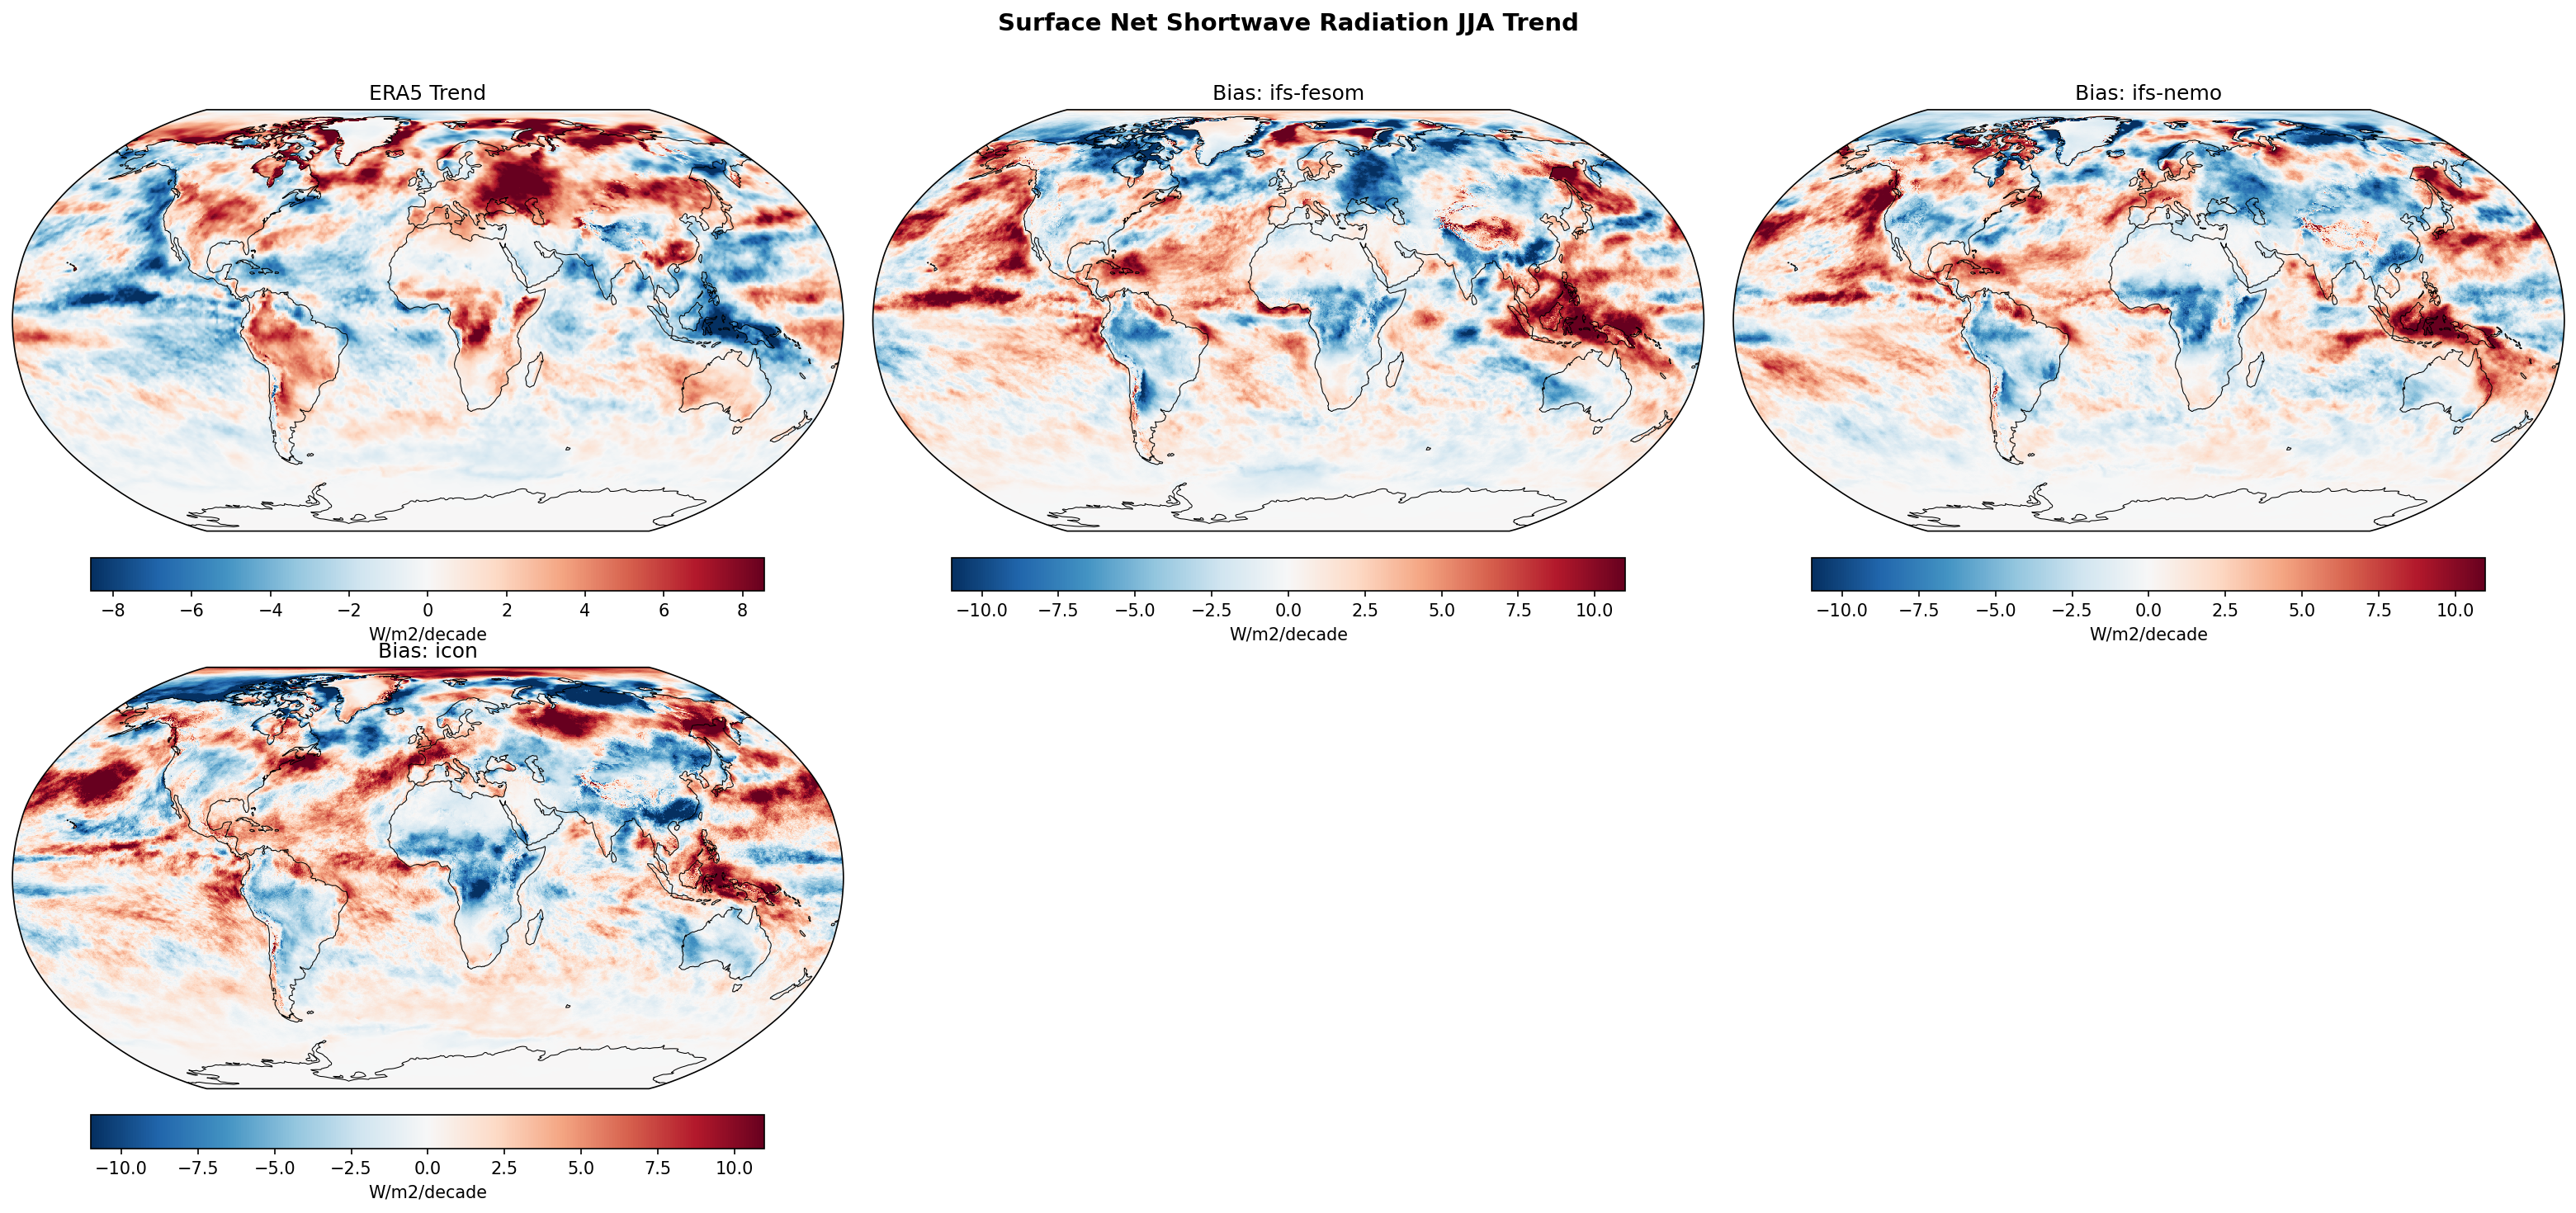
| Variables | avg_snswrf |
|---|---|
| Models | ifs-fesom, ifs-nemo, icon |
| Reference Dataset | ERA5 |
| Units | W/m2/decade |
| Period | 1990–2014 |
Summary high
This figure evaluates linear trends in JJA surface net shortwave radiation (1990–2014) for three high-resolution coupled models against ERA5 reanalysis. It highlights a widespread failure to capture the magnitude of observed surface brightening over Northern Hemisphere landmasses, particularly Europe and Russia.
Key Findings
- All models significantly underestimate the strong positive shortwave radiation trend (brightening) observed in ERA5 over Eastern Europe and Western Russia (blue bias in this region).
- IFS-FESOM and IFS-NEMO exhibit nearly identical trend bias patterns, confirming that atmospheric physics (IFS) dominates surface radiation trends over ocean model formulation.
- ICON diverges significantly from the IFS models in the tropics, particularly showing a negative trend bias over Central Africa where IFS models show a positive bias relative to observations.
Spatial Patterns
The dominant observation feature is a strong positive trend (>8 W/m²/decade) over Europe and Western Russia, indicative of summer brightening/drying. All models show a coherent negative bias (-5 to -10 W/m²/decade) in this region. In the tropics, biases are more spatially heterogeneous, with IFS models tending toward excessive brightening (positive bias) in the Amazon and Maritime Continent.
Model Agreement
There is exceptionally high agreement between IFS-FESOM and IFS-NEMO, suggesting the ocean grid (unstructured vs. structured) has little imprint on decadal surface radiation trends. ICON agrees with IFS on the Northern Hemisphere mid-latitude underestimation but disagrees on the sign of errors in the tropical Atlantic and Africa.
Physical Interpretation
The observed European brightening is likely driven by a combination of reduced aerosol loading and dynamic changes (e.g., increased anticyclonic blocking frequency). The consistent underestimation by all models suggests deficiencies in aerosol-cloud interaction parameterizations or an inability to capture the specific phase of multi-decadal atmospheric variability (e.g., jet stream positioning) that occurred in reality. Tropical differences between ICON and IFS likely reflect different convective parameterization responses to warming (cloud cover trends).
Caveats
- A 25-year period is relatively short, meaning trends are heavily influenced by internal climate variability; free-running coupled models are not expected to phase-match internal variability with observations.
- The strong observed signals may partially result from observational system changes or reanalysis inhomogeneities, though the European brightening is a well-documented physical phenomenon.
Surface Net Shortwave Radiation (Clear-Sky) Annual Linear Trend
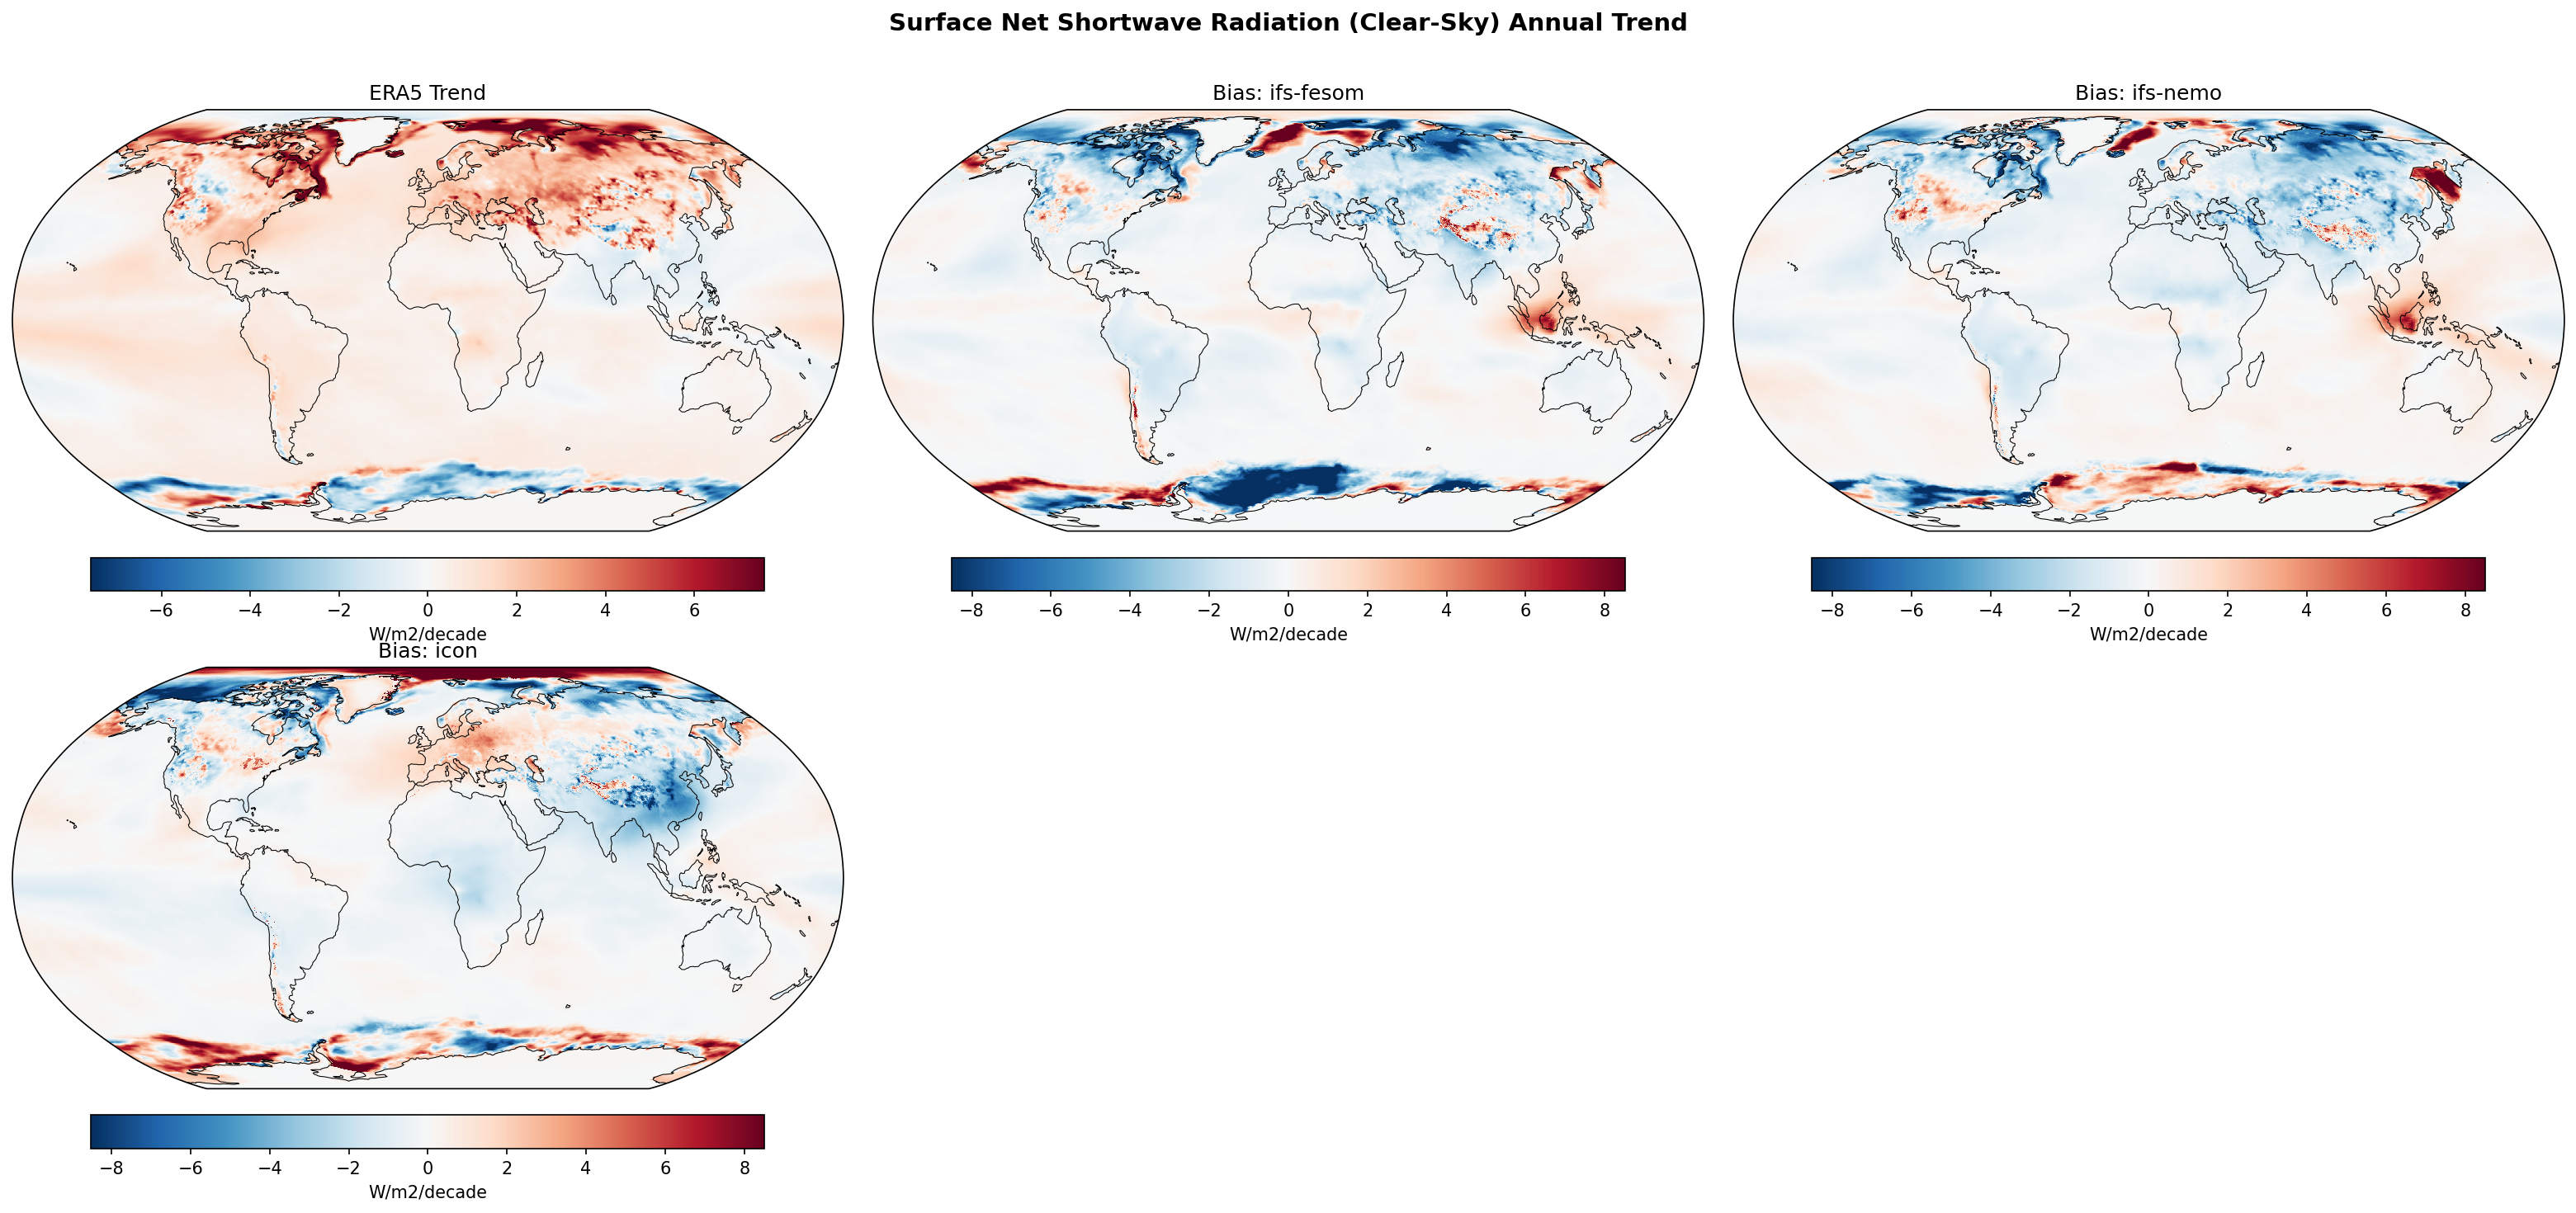
| Variables | avg_snswrfcs |
|---|---|
| Models | ifs-fesom, ifs-nemo, icon |
| Reference Dataset | ERA5 |
| Units | W/m2/decade |
| Period | 1990–2014 |
| ifs-fesom | Global Mean Trend: 0.27 · Global Mean Trend Diff: -0.36 · Trend Rmse: 1.87 |
| ifs-nemo | Global Mean Trend: 0.40 · Global Mean Trend Diff: -0.23 · Trend Rmse: 1.60 |
| icon | Global Mean Trend: 0.44 · Global Mean Trend Diff: -0.20 · Trend Rmse: 1.68 |
Summary high
The figure evaluates 1990–2014 linear trends in clear-sky surface net shortwave radiation. While ERA5 shows strong positive trends (surface brightening) in the Arctic and Northern Hemisphere mid-latitudes, all three high-resolution models generally underestimate these trends, exhibiting widespread negative biases.
Key Findings
- ERA5 exhibits substantial positive trends (>6 W/m²/decade) in the Arctic Ocean and adjacent land areas, consistent with reduced surface albedo from sea ice and snow loss.
- All models display negative trend biases in the Arctic (blue colors), indicating they underestimate the rate of albedo reduction (and thus the surface warming feedback) compared to ERA5.
- Significant inter-model divergence exists in the Southern Ocean: ICON shows a strong positive trend bias (excessive surface brightening) along the sea ice edge, while IFS-FESOM and IFS-NEMO show negative or mixed biases.
- Global mean trend differences are negative for all models (-0.20 to -0.36 W/m²/decade), suggesting a systematic underestimation of the global increase in surface energy uptake seen in the reanalysis.
Spatial Patterns
ERA5 shows a 'global brightening' signal with positive trends over Europe, East Asia, and the Arctic. The models reproduce the sign but not the magnitude, resulting in negative biases over Northern Hemisphere land masses (e.g., China, Siberia) and the Arctic. The Southern Hemisphere signal is more heterogeneous, with ICON showing a unique zonal ring of positive bias around Antarctica.
Model Agreement
IFS-NEMO performs best statistically with the lowest RMSE (1.60 W/m²/decade) and moderate bias. IFS-FESOM has the largest negative mean bias (-0.36 W/m²/decade), particularly strong in the polar regions. ICON captures the global mean best but has large compensating regional errors in the Southern Hemisphere.
Physical Interpretation
Trends in clear-sky surface net shortwave are primarily driven by changes in surface albedo (cryosphere) and atmospheric transparency (aerosols/water vapor). The widespread negative biases in the Arctic suggest the models simulate slower sea ice/snow retreat than occurred in reality (1990-2014). In mid-latitudes, the underestimation of positive trends over Europe and Asia suggests differences in aerosol forcing implementation (e.g., under-representing the 'brightening' from reduced pollution) or water vapor feedbacks.
Caveats
- ERA5 is a reanalysis and relies on its own radiative transfer model and assimilated data; it is not a direct observation.
- Clear-sky diagnostics exclude cloud effects, so these biases relate strictly to surface properties (albedo) and clear-air absorption (aerosols/water vapor).
Surface Net Shortwave Radiation (Clear-Sky) DJF Linear Trend
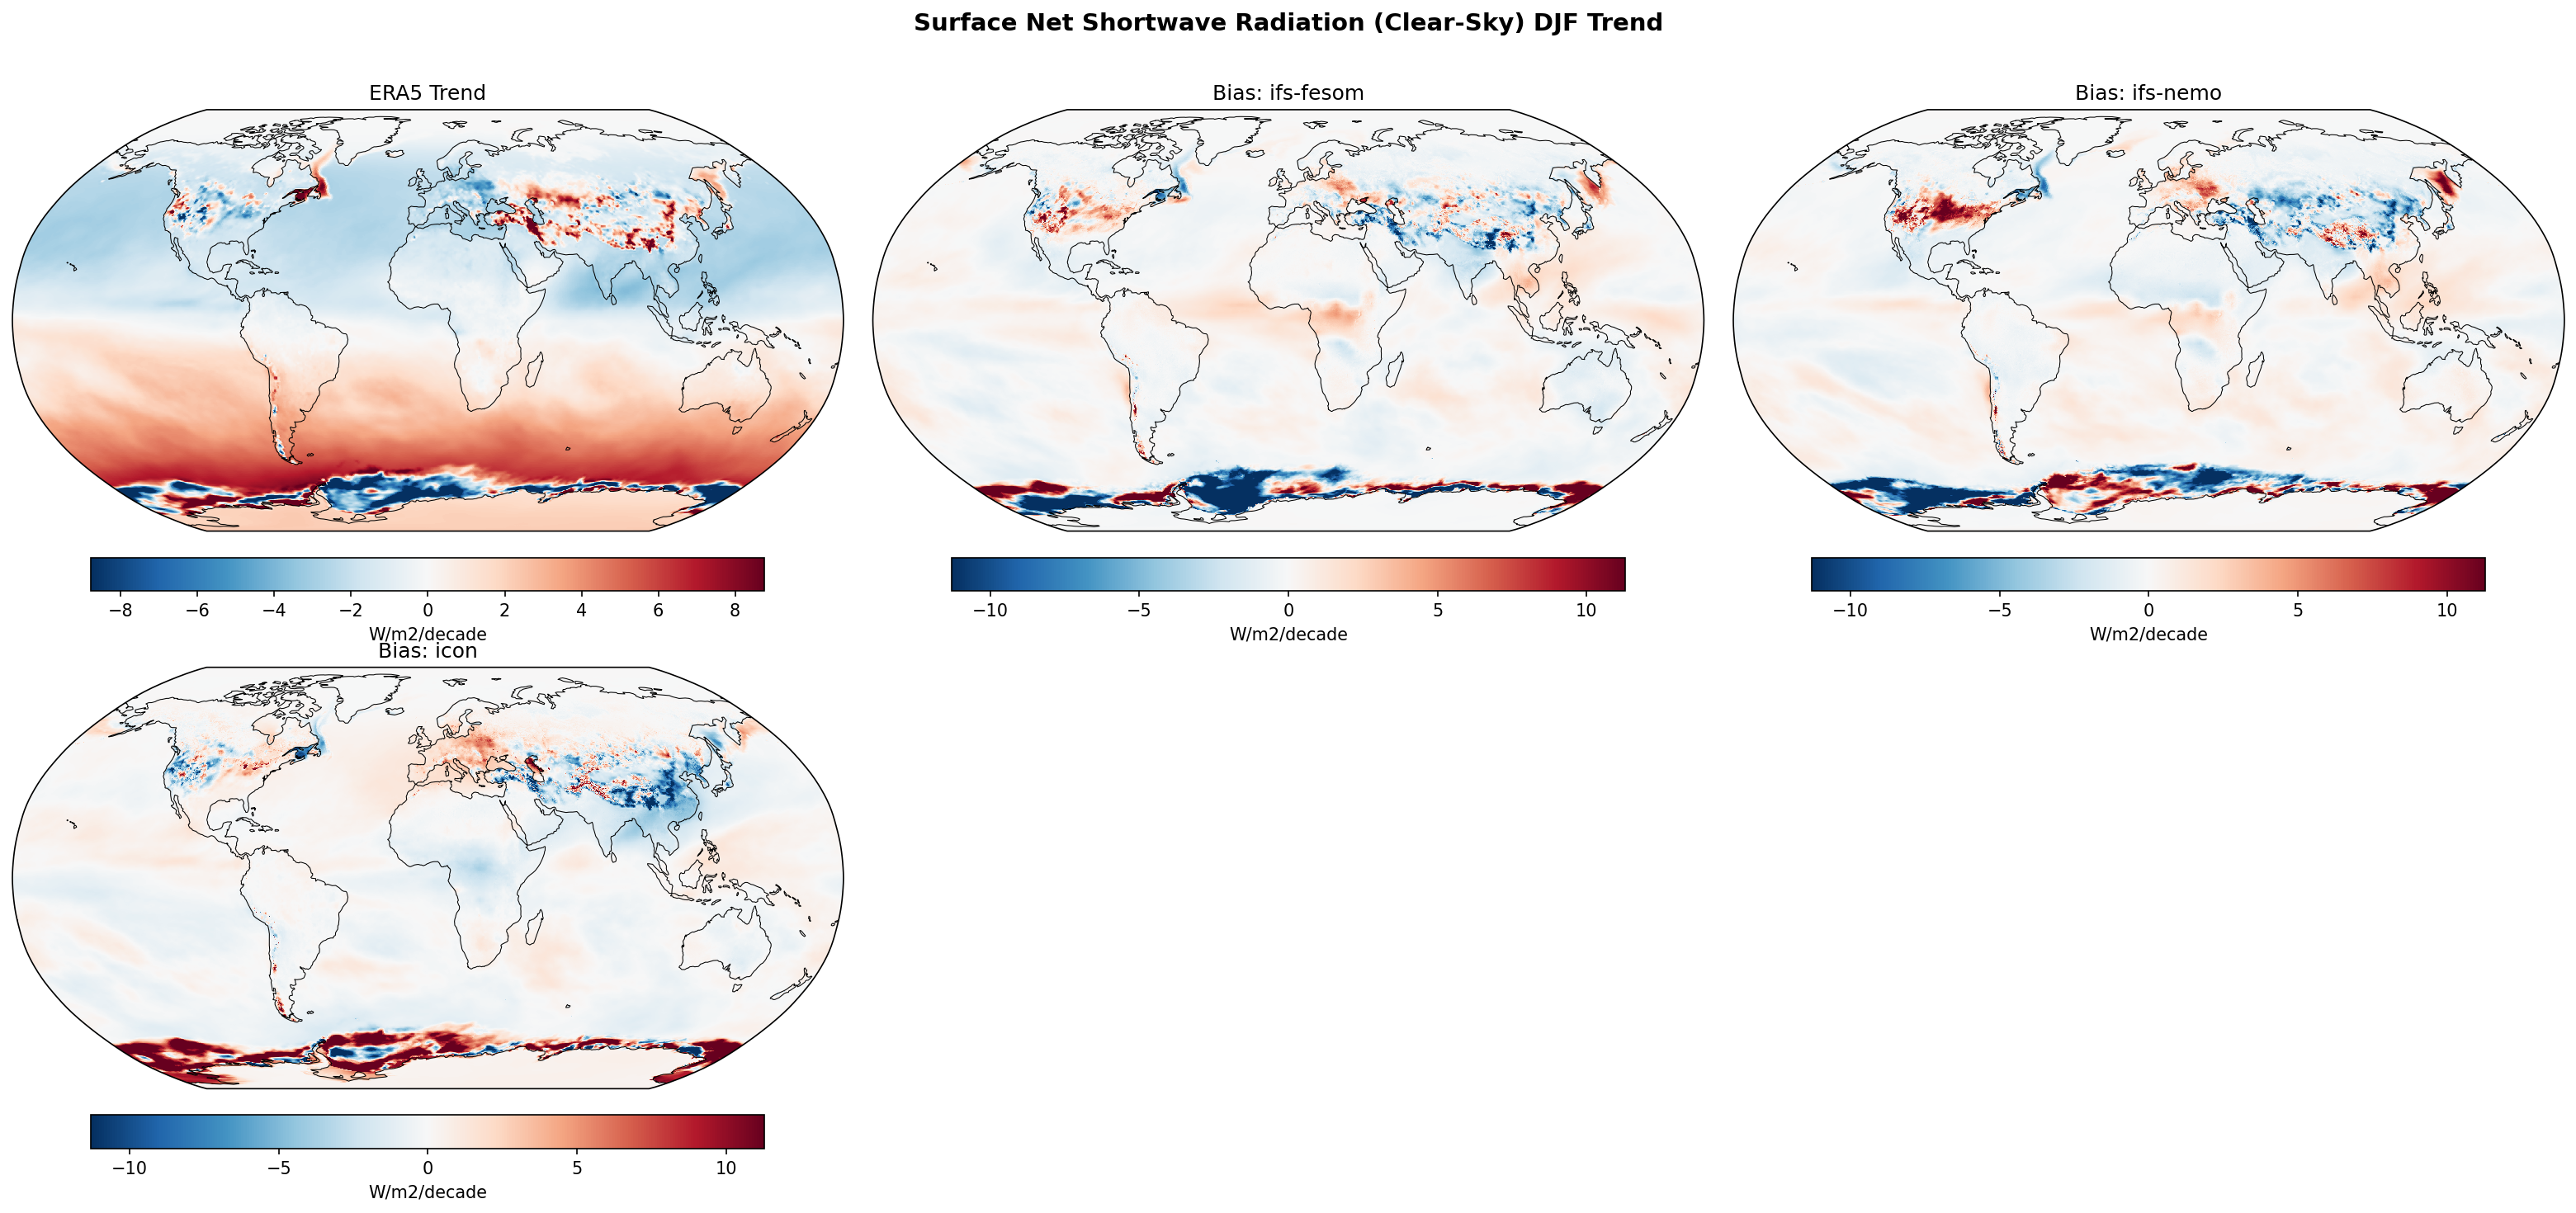
| Variables | avg_snswrfcs |
|---|---|
| Models | ifs-fesom, ifs-nemo, icon |
| Reference Dataset | ERA5 |
| Units | W/m2/decade |
| Period | 1990–2014 |
Summary high
The figure illustrates linear trends (1990–2014) in DJF Surface Net Shortwave Radiation (Clear-Sky), where model biases relative to ERA5 are dominated by surface albedo changes in the cryosphere (Northern Hemisphere snow and Southern Hemisphere sea ice).
Key Findings
- All models exhibit a prominent dipole bias pattern over Northern Hemisphere land: positive trend biases (relative darkening/warming) over North America and negative trend biases (relative brightening/cooling) over Central Asia and the Himalayas.
- In the Southern Hemisphere, biases are concentrated along the Antarctic sea ice edge, reflecting mismatches in sea ice retreat/expansion trends.
- ICON shows a distinct, coherent positive trend bias along the Antarctic coast compared to the more noisy, dipolar biases of the IFS models, suggesting stronger sea ice loss or albedo reduction in ICON for this period.
- IFS-FESOM and IFS-NEMO display very strong inter-model agreement, indicating that the atmospheric component (IFS) or common forcing drives the trend patterns more than the ocean grid formulation (unstructured vs. structured).
Spatial Patterns
The ERA5 baseline shows complex regional signals, including strong positive trends (increased absorption) in parts of the Southern Ocean and mixed signals over Northern continents. Model biases are spatially correlated with snow and ice margins. The North American positive bias indicates models simulate a stronger reduction in snow albedo (or weaker increase) than observed, while the Asian negative bias suggests the opposite.
Model Agreement
IFS-FESOM and IFS-NEMO are nearly identical, showing high internal consistency. ICON diverges primarily in the Antarctic region with stronger positive trend biases. All models disagree significantly with ERA5 on the precise spatial location of trends in regions of high internal variability (snow/ice margins).
Physical Interpretation
Since this is a clear-sky diagnostic, trends in surface net shortwave radiation are driven primarily by surface albedo changes (snow and ice cover) rather than cloud changes. A positive trend implies decreasing albedo (melting), while a negative trend implies increasing albedo. The observed biases therefore reflect discrepancies in the decadal evolution of snow cover extent in the Northern Hemisphere and sea ice concentration in the Southern Ocean.
Caveats
- The analysis period (1990–2014) is relatively short (25 years), meaning trends in free-running coupled models are heavily influenced by internal decadal variability (e.g., ENSO, NAO phases) which will not phase-match the historical realization in ERA5.
- Clear-sky diagnostics exclude cloud effects, so these biases isolate surface/aerosol processes and do not represent the full all-sky radiation budget errors.
Surface Net Shortwave Radiation (Clear-Sky) JJA Linear Trend
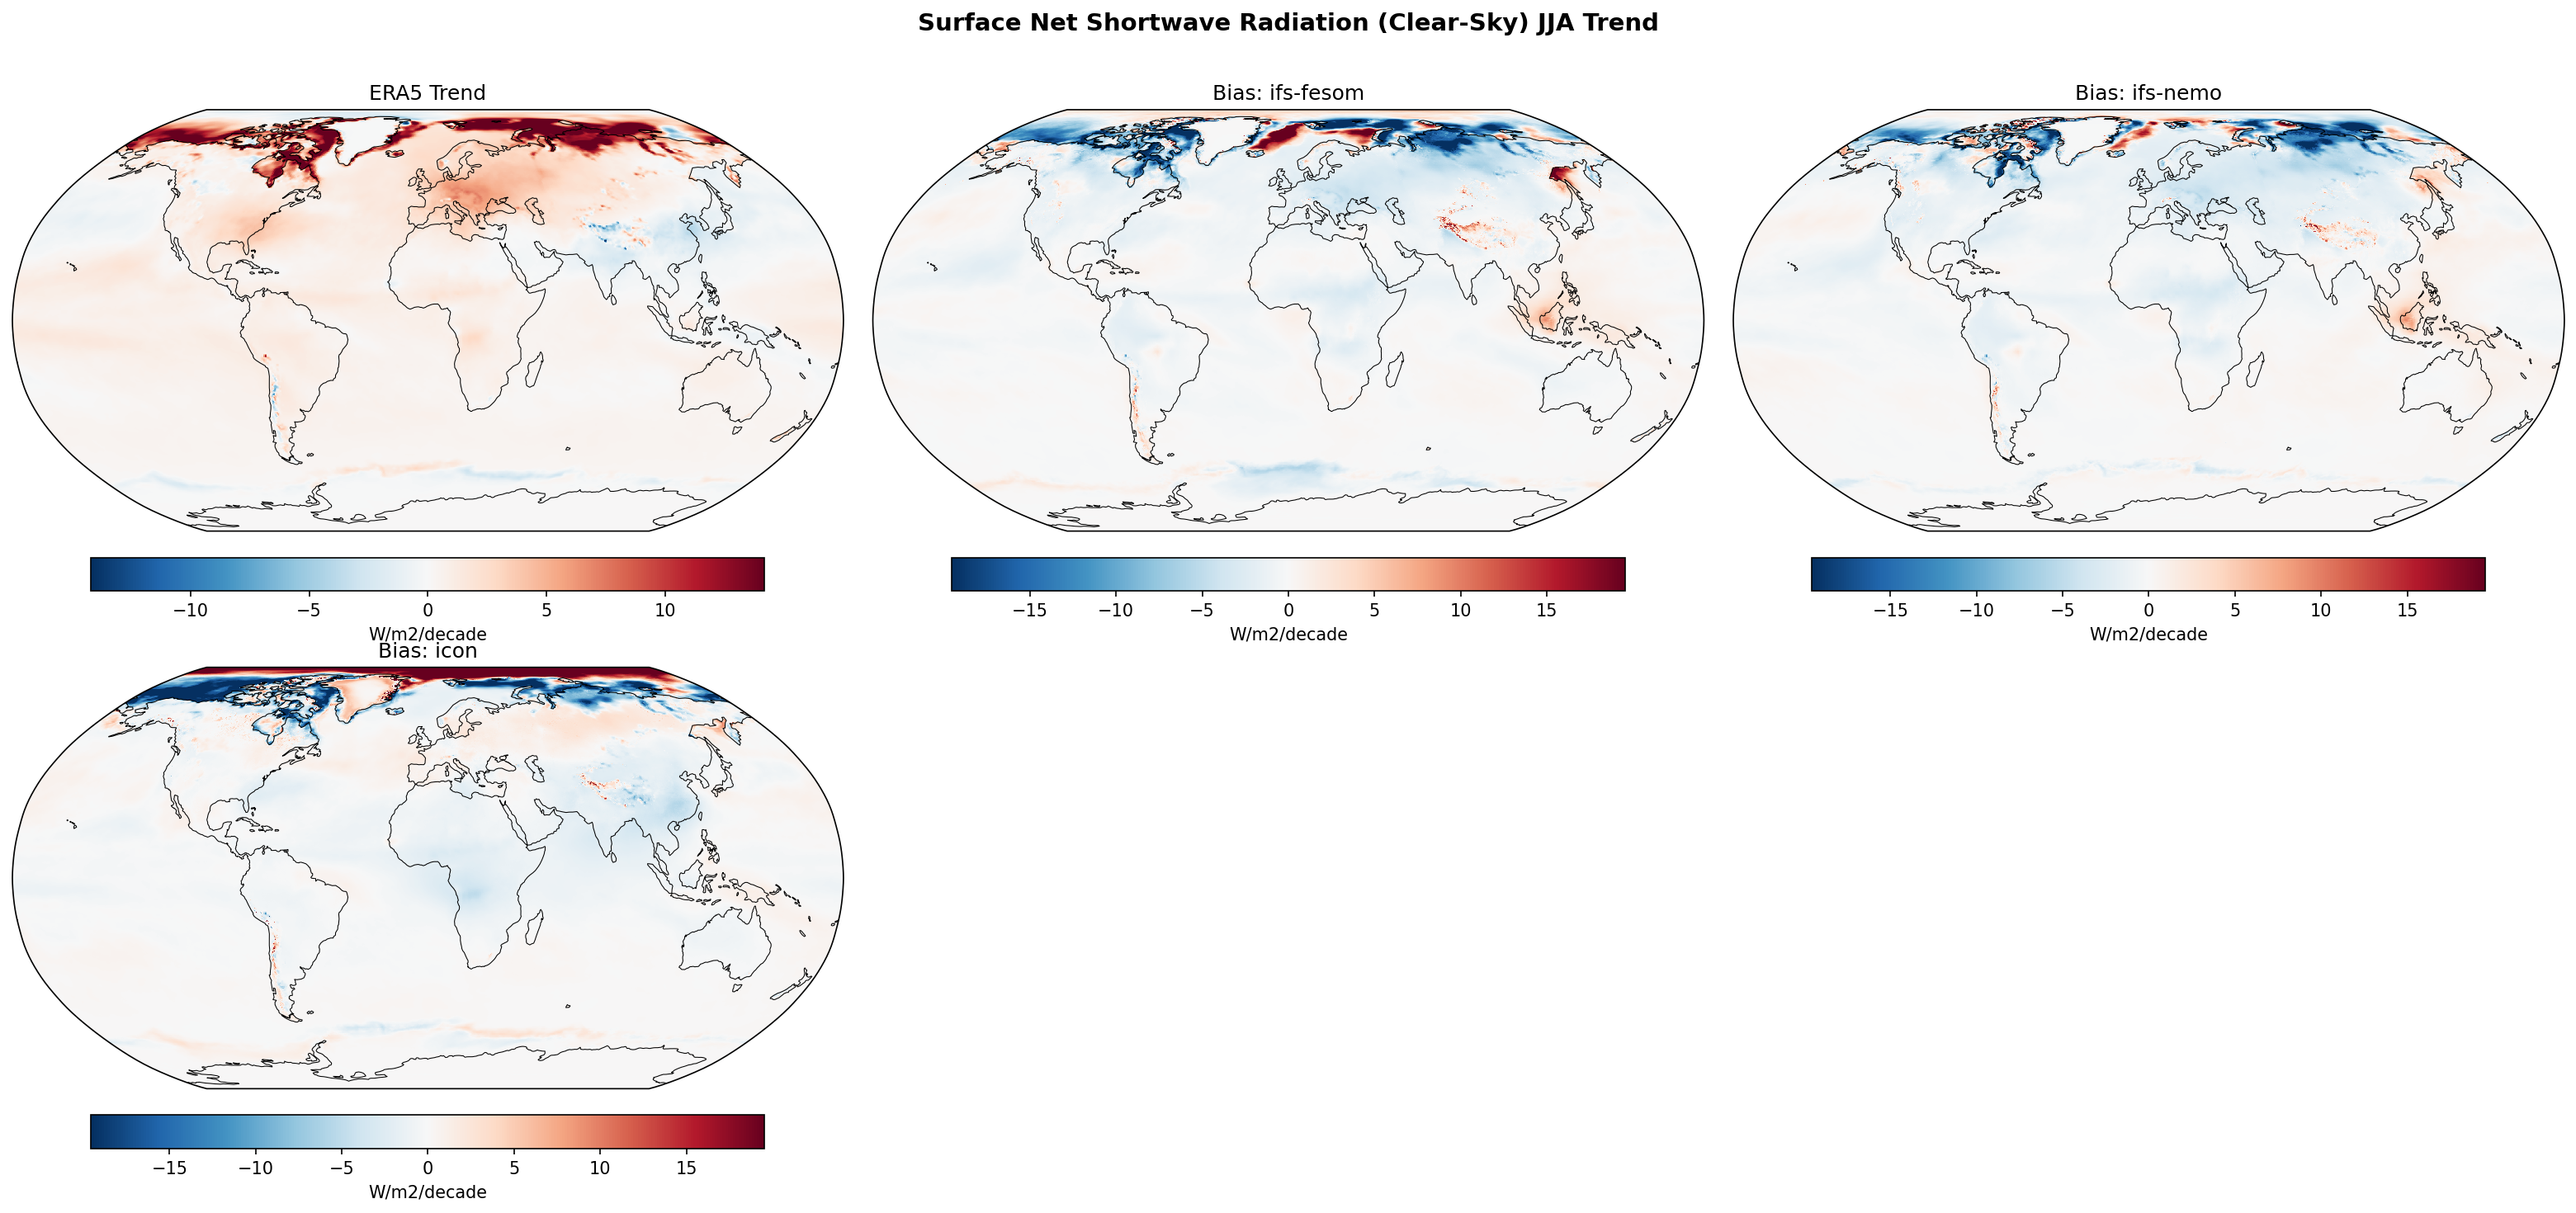
| Variables | avg_snswrfcs |
|---|---|
| Models | ifs-fesom, ifs-nemo, icon |
| Reference Dataset | ERA5 |
| Units | W/m2/decade |
| Period | 1990–2014 |
Summary high
During JJA (1990–2014), ERA5 shows a strong positive trend in clear-sky surface net shortwave radiation over the Arctic due to albedo reduction (ice/snow melt), a feature all three models significantly underestimate.
Key Findings
- ERA5 displays strong positive trends (>10 W/m²/decade) in absorbed clear-sky solar radiation across the Arctic Ocean and high-latitude land masses, consistent with observed sea ice retreat and snow cover reduction.
- All three models (IFS-FESOM, IFS-NEMO, ICON) exhibit widespread negative trend biases (approx. -10 to -15 W/m²/decade) in the Arctic, indicating a failure to capture the magnitude of the observed albedo feedback.
- Global non-polar regions show weak trend biases, suggesting good agreement on solar forcing and aerosol trends outside the cryosphere.
- ICON shows slightly broader negative biases over Eurasian land areas compared to the IFS variants, but the high-latitude cryospheric signal is robust across all models.
Spatial Patterns
The dominant feature is the contrast between the strong positive trend in the ERA5 high Northern latitudes (Arctic Ocean, Siberia, Canada) and the corresponding negative bias in all model panels. The signal is strongest along the climatological sea ice margins and snow-covered coastlines.
Model Agreement
There is high inter-model agreement regarding the underestimation of Arctic trends. While minor regional differences exist (e.g., ICON's bias extent over Asia), all models systematically miss the rate of radiative heating increase associated with Arctic amplification in this period.
Physical Interpretation
In clear-sky conditions, trends in surface net shortwave radiation are primarily driven by surface albedo changes (since cloud effects are excluded). The positive ERA5 trend reflects a darkening Arctic surface (melting ice/snow). The negative model biases imply that the models' sea ice and snow cover are not retreating or darkening as rapidly as observed in the reanalysis during this 1990–2014 window.
Caveats
- ERA5 trends are influenced by changing satellite data assimilation, which may sharpen the trend compared to free-running models.
- The 25-year period (1990-2014) is relatively short for trend analysis, meaning internal variability in sea ice dynamics could contribute to model-observation discrepancies.
Total Cloud Cover Annual Linear Trend
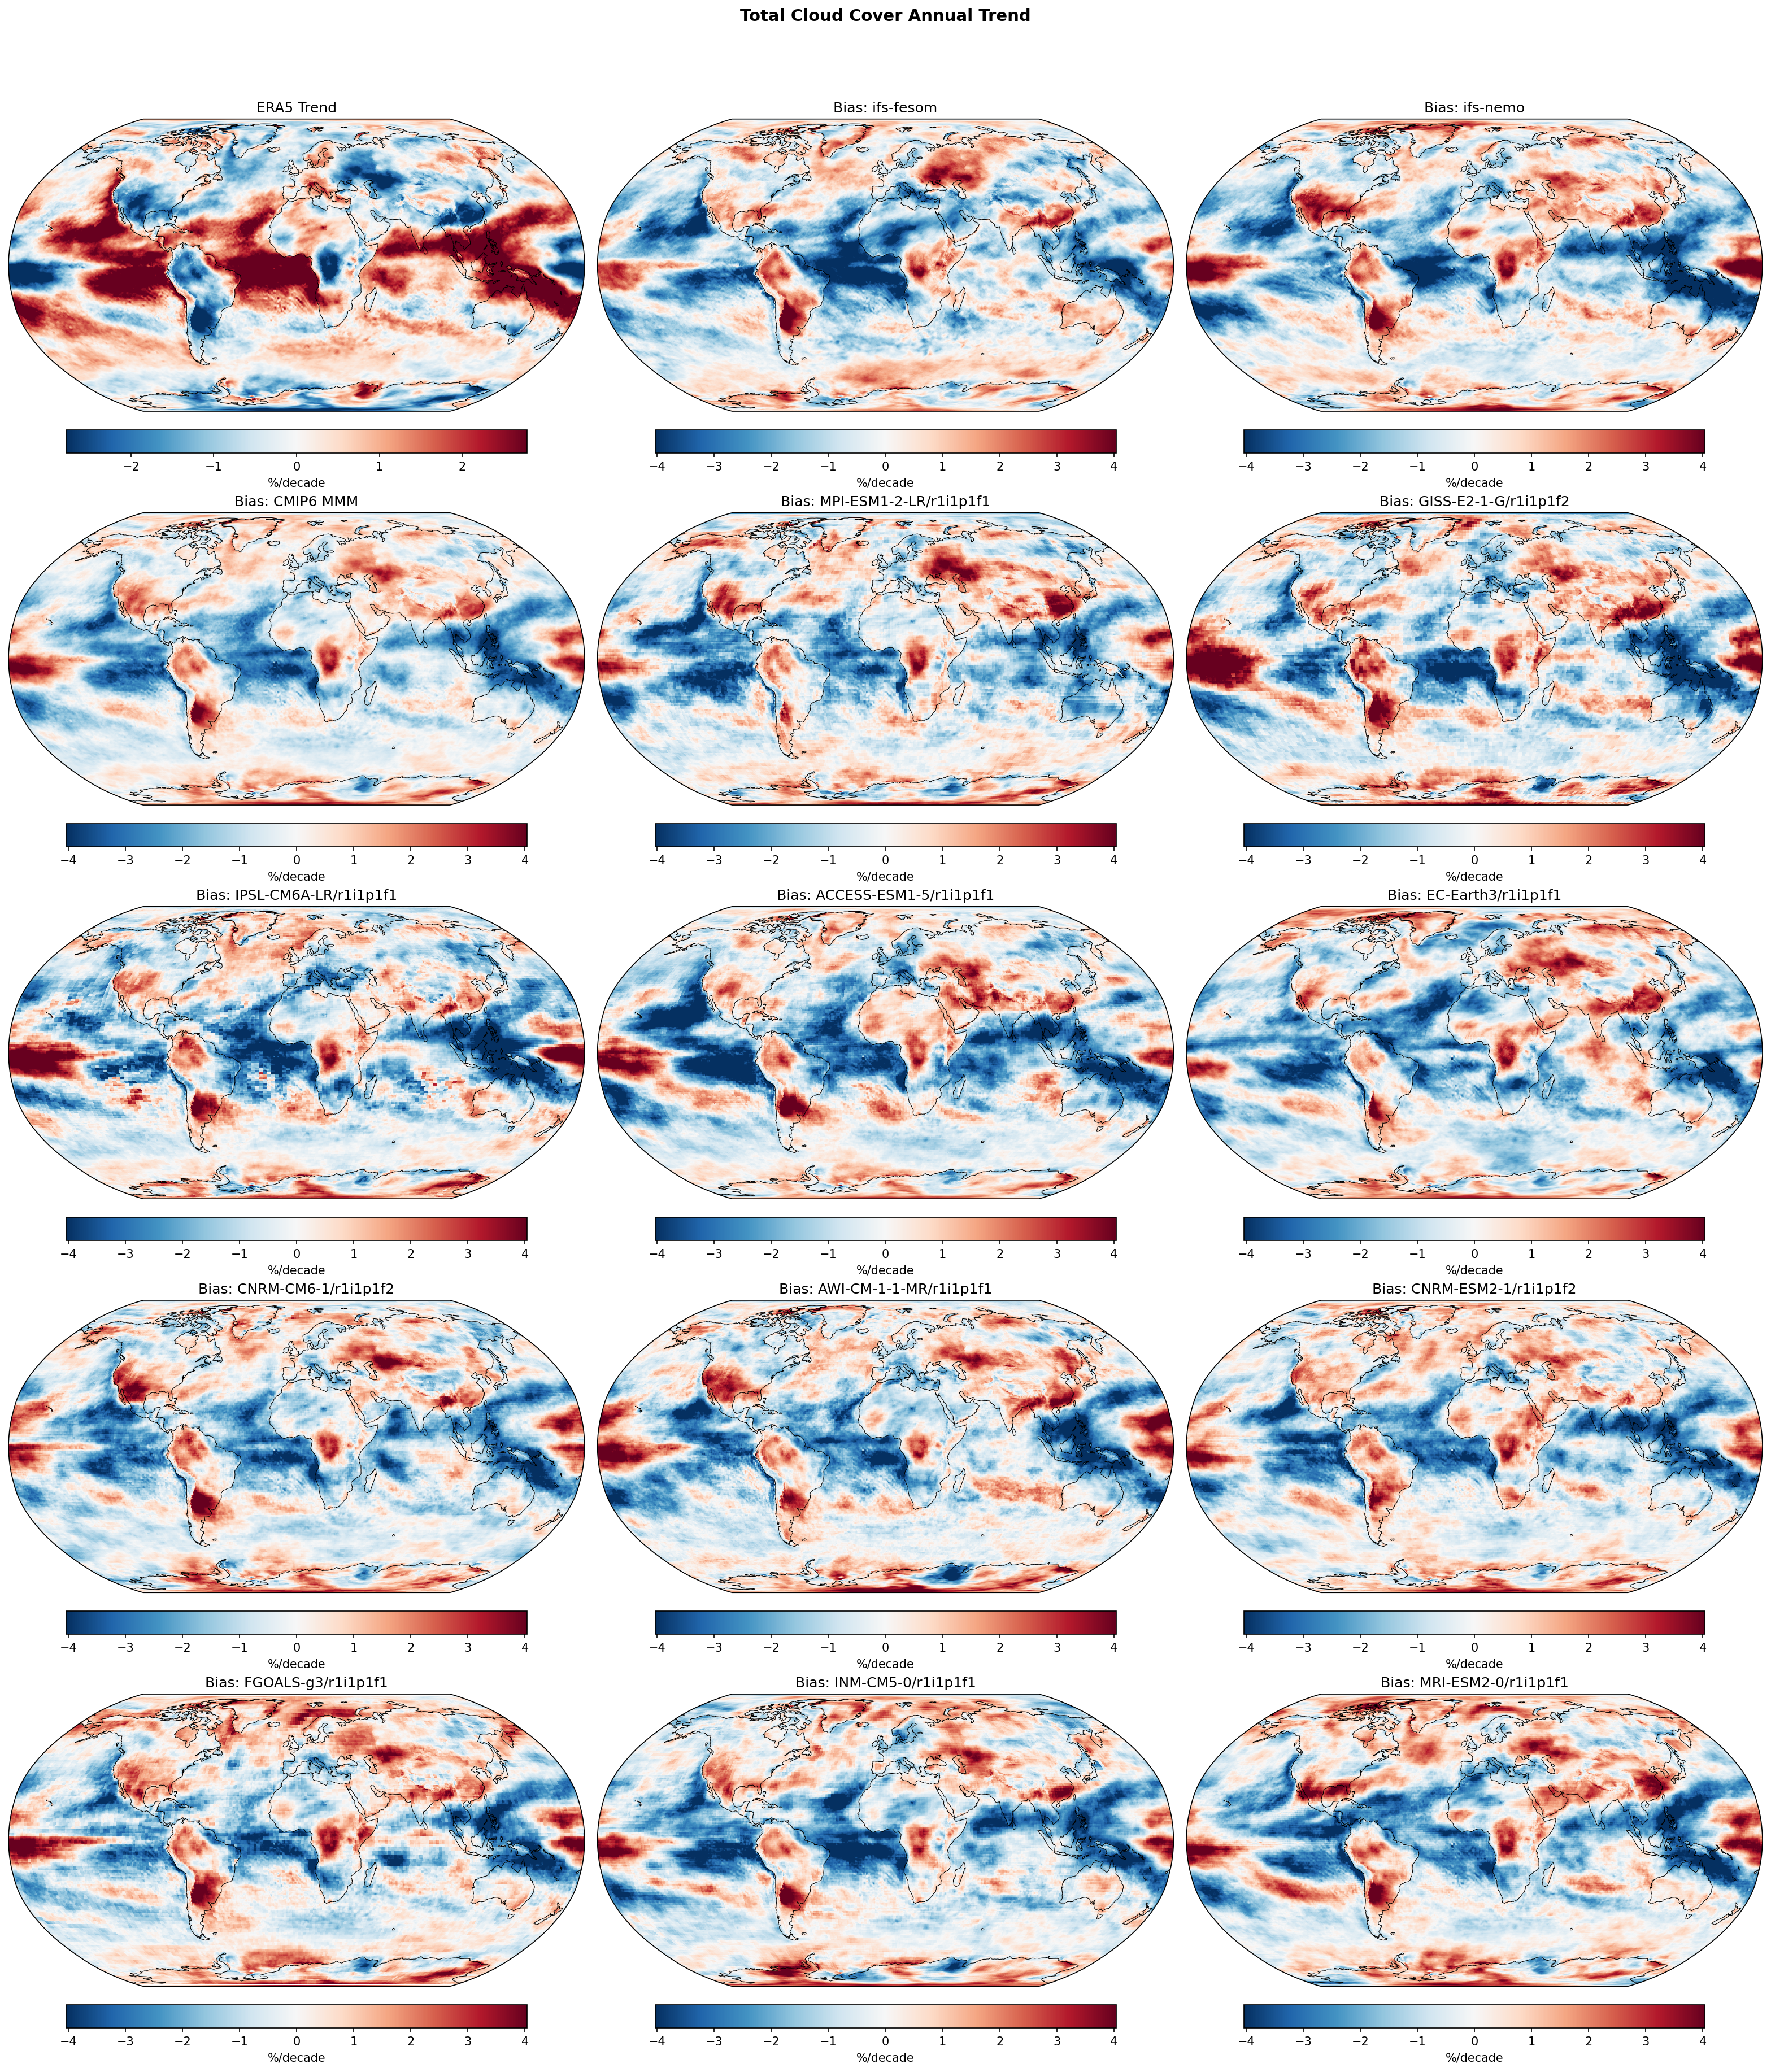
| Variables | avg_tcc |
|---|---|
| Models | ifs-fesom, ifs-nemo, CMIP6 MMM, MPI-ESM1-2-LR/r1i1p1f1, GISS-E2-1-G/r1i1p1f2, IPSL-CM6A-LR/r1i1p1f1, ACCESS-ESM1-5/r1i1p1f1, EC-Earth3/r1i1p1f1, CNRM-CM6-1/r1i1p1f2, AWI-CM-1-1-MR/r1i1p1f1, CNRM-ESM2-1/r1i1p1f2, FGOALS-g3/r1i1p1f1, INM-CM5-0/r1i1p1f1, MRI-ESM2-0/r1i1p1f1 |
| Reference Dataset | ERA5 |
| Units | %/decade |
| Period | 1990–2014 |
| ifs-fesom | Global Mean Trend: -0.12 · Global Mean Trend Diff: -0.53 · Trend Rmse: 1.72 |
| ifs-nemo | Global Mean Trend: 0.01 · Global Mean Trend Diff: -0.39 · Trend Rmse: 1.80 |
| CMIP6 MMM | Global Mean Trend Diff: -0.42 · Trend Rmse: 1.50 |
| MPI-ESM1-2-LR/r1i1p1f1 | Global Mean Trend Diff: -0.42 · Trend Rmse: 1.59 |
| GISS-E2-1-G/r1i1p1f2 | Global Mean Trend Diff: -0.24 · Trend Rmse: 1.84 |
| IPSL-CM6A-LR/r1i1p1f1 | Global Mean Trend Diff: -0.50 · Trend Rmse: 1.88 |
| ACCESS-ESM1-5/r1i1p1f1 | Global Mean Trend Diff: -0.61 · Trend Rmse: 1.92 |
| EC-Earth3/r1i1p1f1 | Global Mean Trend Diff: -0.54 · Trend Rmse: 1.62 |
| CNRM-CM6-1/r1i1p1f2 | Global Mean Trend Diff: -0.45 · Trend Rmse: 1.61 |
| AWI-CM-1-1-MR/r1i1p1f1 | Global Mean Trend Diff: -0.37 · Trend Rmse: 1.70 |
| CNRM-ESM2-1/r1i1p1f2 | Global Mean Trend Diff: -0.38 · Trend Rmse: 1.59 |
| FGOALS-g3/r1i1p1f1 | Global Mean Trend Diff: -0.23 · Trend Rmse: 1.62 |
| INM-CM5-0/r1i1p1f1 | Global Mean Trend Diff: -0.53 · Trend Rmse: 1.73 |
| MRI-ESM2-0/r1i1p1f1 | Global Mean Trend Diff: -0.32 · Trend Rmse: 1.74 |
Summary high
This diagnostic compares the annual linear trend in Total Cloud Cover (%) over 1990-2014 from ERA5 reanalysis against high-resolution DestinE models (IFS-FESOM, IFS-NEMO) and a suite of CMIP6 models. The analysis highlights a significant discrepancy in spatial trend patterns, dominated by the mismatch in internal climate variability phases between free-running coupled simulations and the observed historical record.
Key Findings
- The spatial structure of trend differences is dominated by a strong zonal dipole in the tropical Pacific; models fail to capture the specific observed pattern of increasing cloud cover in the Eastern Pacific and decreasing cover in the Western Pacific/Maritime Continent seen in ERA5.
- Globally, ERA5 exhibits a positive cloud cover trend (inferred ~+0.4 %/decade) which the models generally do not reproduce (model trends range from ~-0.1 to +0.01 %/decade), resulting in widespread negative values in the global mean trend difference statistics (-0.2 to -0.6 %/decade).
- The high-resolution DestinE models perform within the range of the CMIP6 ensemble; IFS-NEMO shows a slightly smaller global trend error (-0.39 %/decade) compared to IFS-FESOM (-0.53 %/decade) and the CMIP6 MMM (-0.42 %/decade), but neither captures the observed tropical spatial variability.
Spatial Patterns
ERA5 shows distinct regional trends: strong positive trends in the Eastern Equatorial Pacific and North Atlantic, and negative trends in the Western Pacific warm pool. The 'Bias' (difference) maps for almost all models display the inverse of this pattern (negative bias in E. Pacific, positive bias in W. Pacific), implying the models simulate near-zero or spatially uncorrelated trends in these regions compared to the strong observational signal.
Model Agreement
There is high consistency across all models (DestinE and CMIP6) in their inability to match the ERA5 spatial trend pattern. This is expected for free-running coupled models over a 25-year period where internal variability dominates. IFS-NEMO displays distinct positive trend biases in the Southern Ocean compared to IFS-FESOM.
Physical Interpretation
The discrepancies are primarily driven by the phasing of internal decadal variability (e.g., ENSO, IPO/PDO). The 1990-2014 period in ERA5 contains specific phases of these oscillations (e.g., El Niño/La Niña dominance) that free-running coupled models will not reproduce in chronological sync. Thus, the 'bias' maps largely reflect the subtraction of the observational variability signal from a neutral model background.
Caveats
- A 25-year trend analysis in coupled models is heavily influenced by internal variability, making it a poor metric for assessing systematic model physics errors versus simple phasing mismatches.
- ERA5 cloud trends may contain artifacts from changes in the satellite observing system (e.g., introduction of new sensors) during this period.
Total Cloud Cover DJF Linear Trend
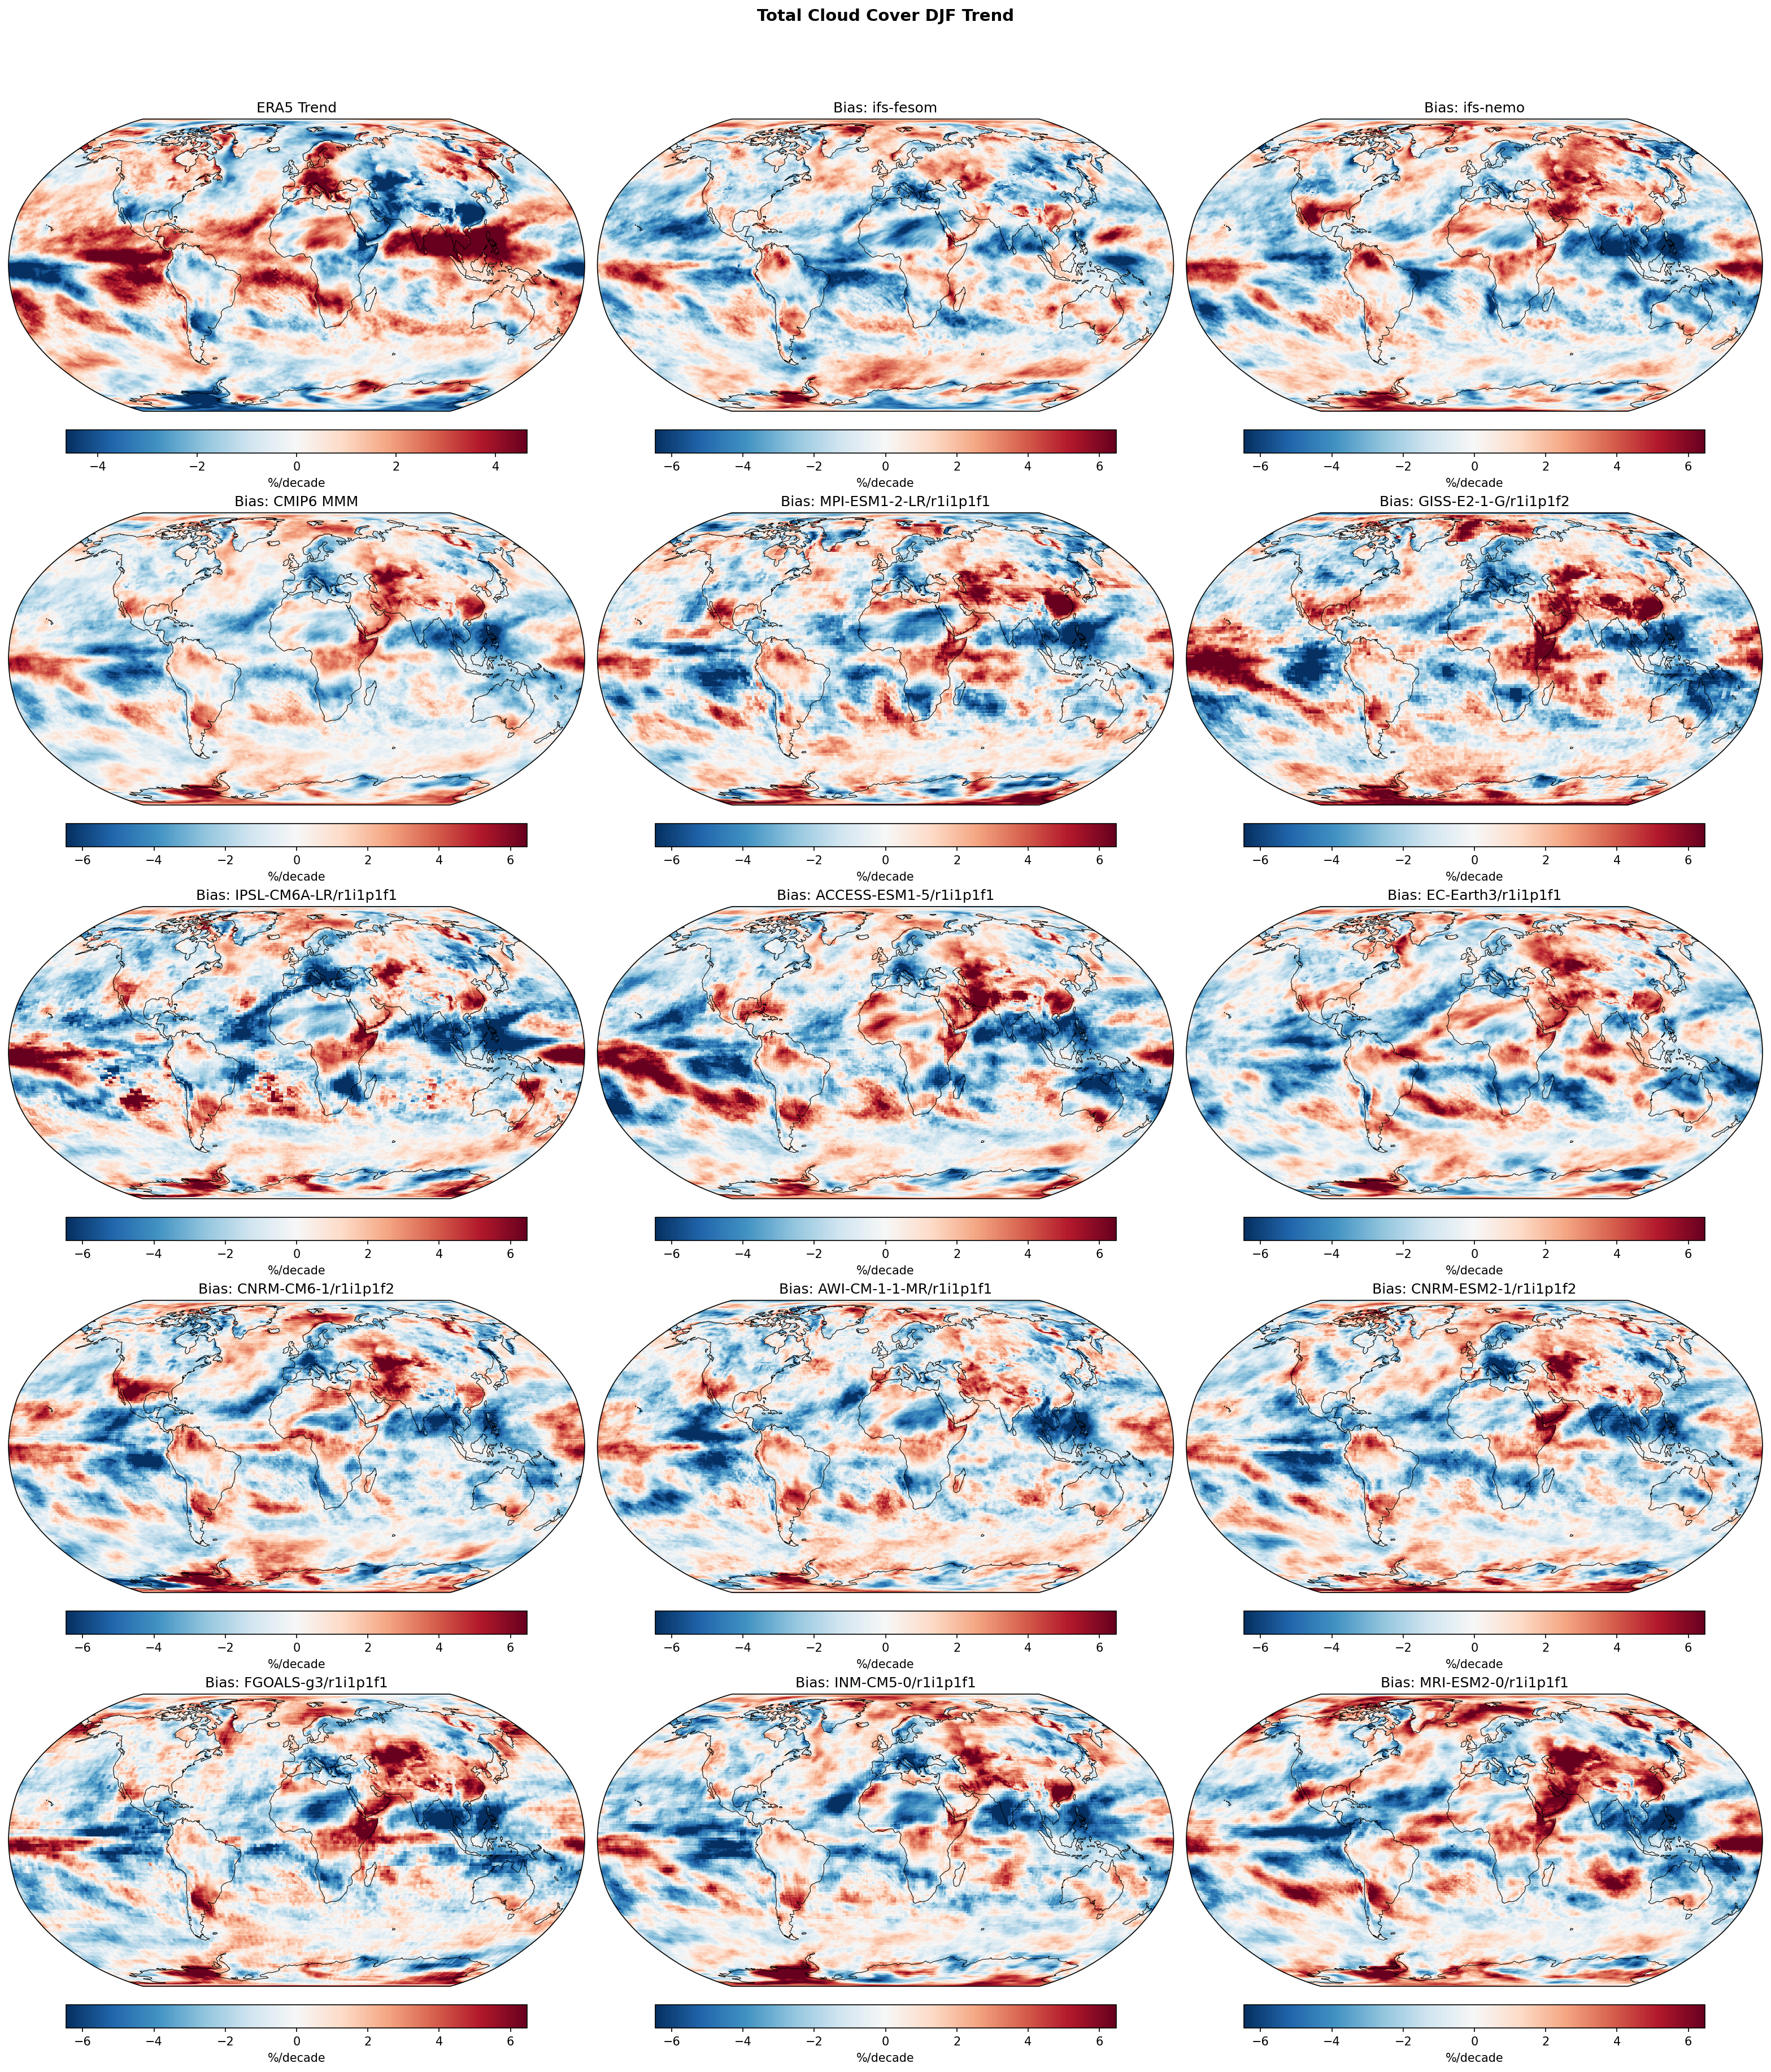
| Variables | avg_tcc |
|---|---|
| Models | ifs-fesom, ifs-nemo, CMIP6 MMM, MPI-ESM1-2-LR/r1i1p1f1, GISS-E2-1-G/r1i1p1f2, IPSL-CM6A-LR/r1i1p1f1, ACCESS-ESM1-5/r1i1p1f1, EC-Earth3/r1i1p1f1, CNRM-CM6-1/r1i1p1f2, AWI-CM-1-1-MR/r1i1p1f1, CNRM-ESM2-1/r1i1p1f2, FGOALS-g3/r1i1p1f1, INM-CM5-0/r1i1p1f1, MRI-ESM2-0/r1i1p1f1 |
| Reference Dataset | ERA5 |
| Units | %/decade |
| Period | 1990–2014 |
| CMIP6 MMM | Global Mean Trend Diff: -0.34 · Trend Rmse: None |
| MPI-ESM1-2-LR/r1i1p1f1 | Global Mean Trend Diff: -0.28 · Trend Rmse: None |
| GISS-E2-1-G/r1i1p1f2 | Global Mean Trend Diff: -0.06 · Trend Rmse: None |
| IPSL-CM6A-LR/r1i1p1f1 | Global Mean Trend Diff: -0.42 · Trend Rmse: None |
| ACCESS-ESM1-5/r1i1p1f1 | Global Mean Trend Diff: -0.35 · Trend Rmse: None |
| EC-Earth3/r1i1p1f1 | Global Mean Trend Diff: -0.35 · Trend Rmse: None |
| CNRM-CM6-1/r1i1p1f2 | Global Mean Trend Diff: -0.39 · Trend Rmse: None |
| AWI-CM-1-1-MR/r1i1p1f1 | Global Mean Trend Diff: -0.43 · Trend Rmse: None |
| CNRM-ESM2-1/r1i1p1f2 | Global Mean Trend Diff: -0.49 · Trend Rmse: None |
| FGOALS-g3/r1i1p1f1 | Global Mean Trend Diff: -0.33 · Trend Rmse: None |
| INM-CM5-0/r1i1p1f1 | Global Mean Trend Diff: -0.50 · Trend Rmse: None |
| MRI-ESM2-0/r1i1p1f1 | Global Mean Trend Diff: -0.11 · Trend Rmse: None |
Summary high
This figure compares linear trends in Total Cloud Cover (TCC) for DJF 1990–2014 between ERA5 reanalysis, two high-resolution DestinE models (IFS-FESOM, IFS-NEMO), and the CMIP6 ensemble. The comparison reveals that the 25-year observed trends are dominated by internal variability patterns (likely ENSO/PDO related) which free-running models do not reproduce in phase, resulting in large apparent trend biases.
Key Findings
- ERA5 displays a strong zonal dipole in Pacific cloud cover trends (increasing in the East, decreasing in the West), characteristic of specific ENSO or PDO phases active during 1990–2014.
- Both DestinE models and the CMIP6 ensemble exhibit trend difference maps that are largely the inverse of the ERA5 pattern (negative bias in East Pacific, positive in West), implying the models effectively lack the strong specific internal variability signal seen in observations.
- The magnitude of the trend differences (up to ±6 %/decade) exceeds the amplitude of the observed trends themselves, confirming that internal variability dominates the signal over this short 25-year period.
- IFS-FESOM and IFS-NEMO show very similar large-scale trend bias patterns in the tropics, indicating that the choice of ocean model (unstructured vs. structured grid) does not alter the fundamental mismatch in decadal variability phasing relative to observations.
Spatial Patterns
The dominant spatial feature is the Pacific basin dipole. In ERA5, TCC increases (>+4 %/decade) in the central/eastern tropical Pacific and decreases in the western Pacific/Maritime Continent. The model bias maps show the opposite (blue/negative in the east, red/positive in the west). Similar inverse patterns appear in the North Atlantic, where ERA5 shows positive trends that models generally fail to capture (appearing as negative bias).
Model Agreement
Models generally disagree with observations regarding the spatial distribution of trends, which is expected for uninitialized simulations over decadal timescales. The CMIP6 Multi-Model Mean (MMM) bias closely resembles the negative of the ERA5 trend, suggesting the forced response is weak and the error is dominated by the presence of strong internal variability in the observations that is averaged out in the MMM.
Physical Interpretation
The 1990–2014 period spans a specific realization of low-frequency climate variability (e.g., transitions in the Interdecadal Pacific Oscillation). Free-running coupled models generate their own spontaneous internal variability which is not temporally synchronized with the real world. Therefore, the 'bias' maps primarily illustrate the subtraction of the observed variability pattern from the models' uncorrelated states, rather than systematic errors in cloud physics or climate sensitivity.
Caveats
- The 25-year analysis period is too short to distinguish forced climate trends from internal decadal variability.
- High trend differences should not be interpreted as model deficiencies but rather as an expected consequence of comparing free-running coupled simulations to a single observational realization without data assimilation.
Total Cloud Cover JJA Linear Trend
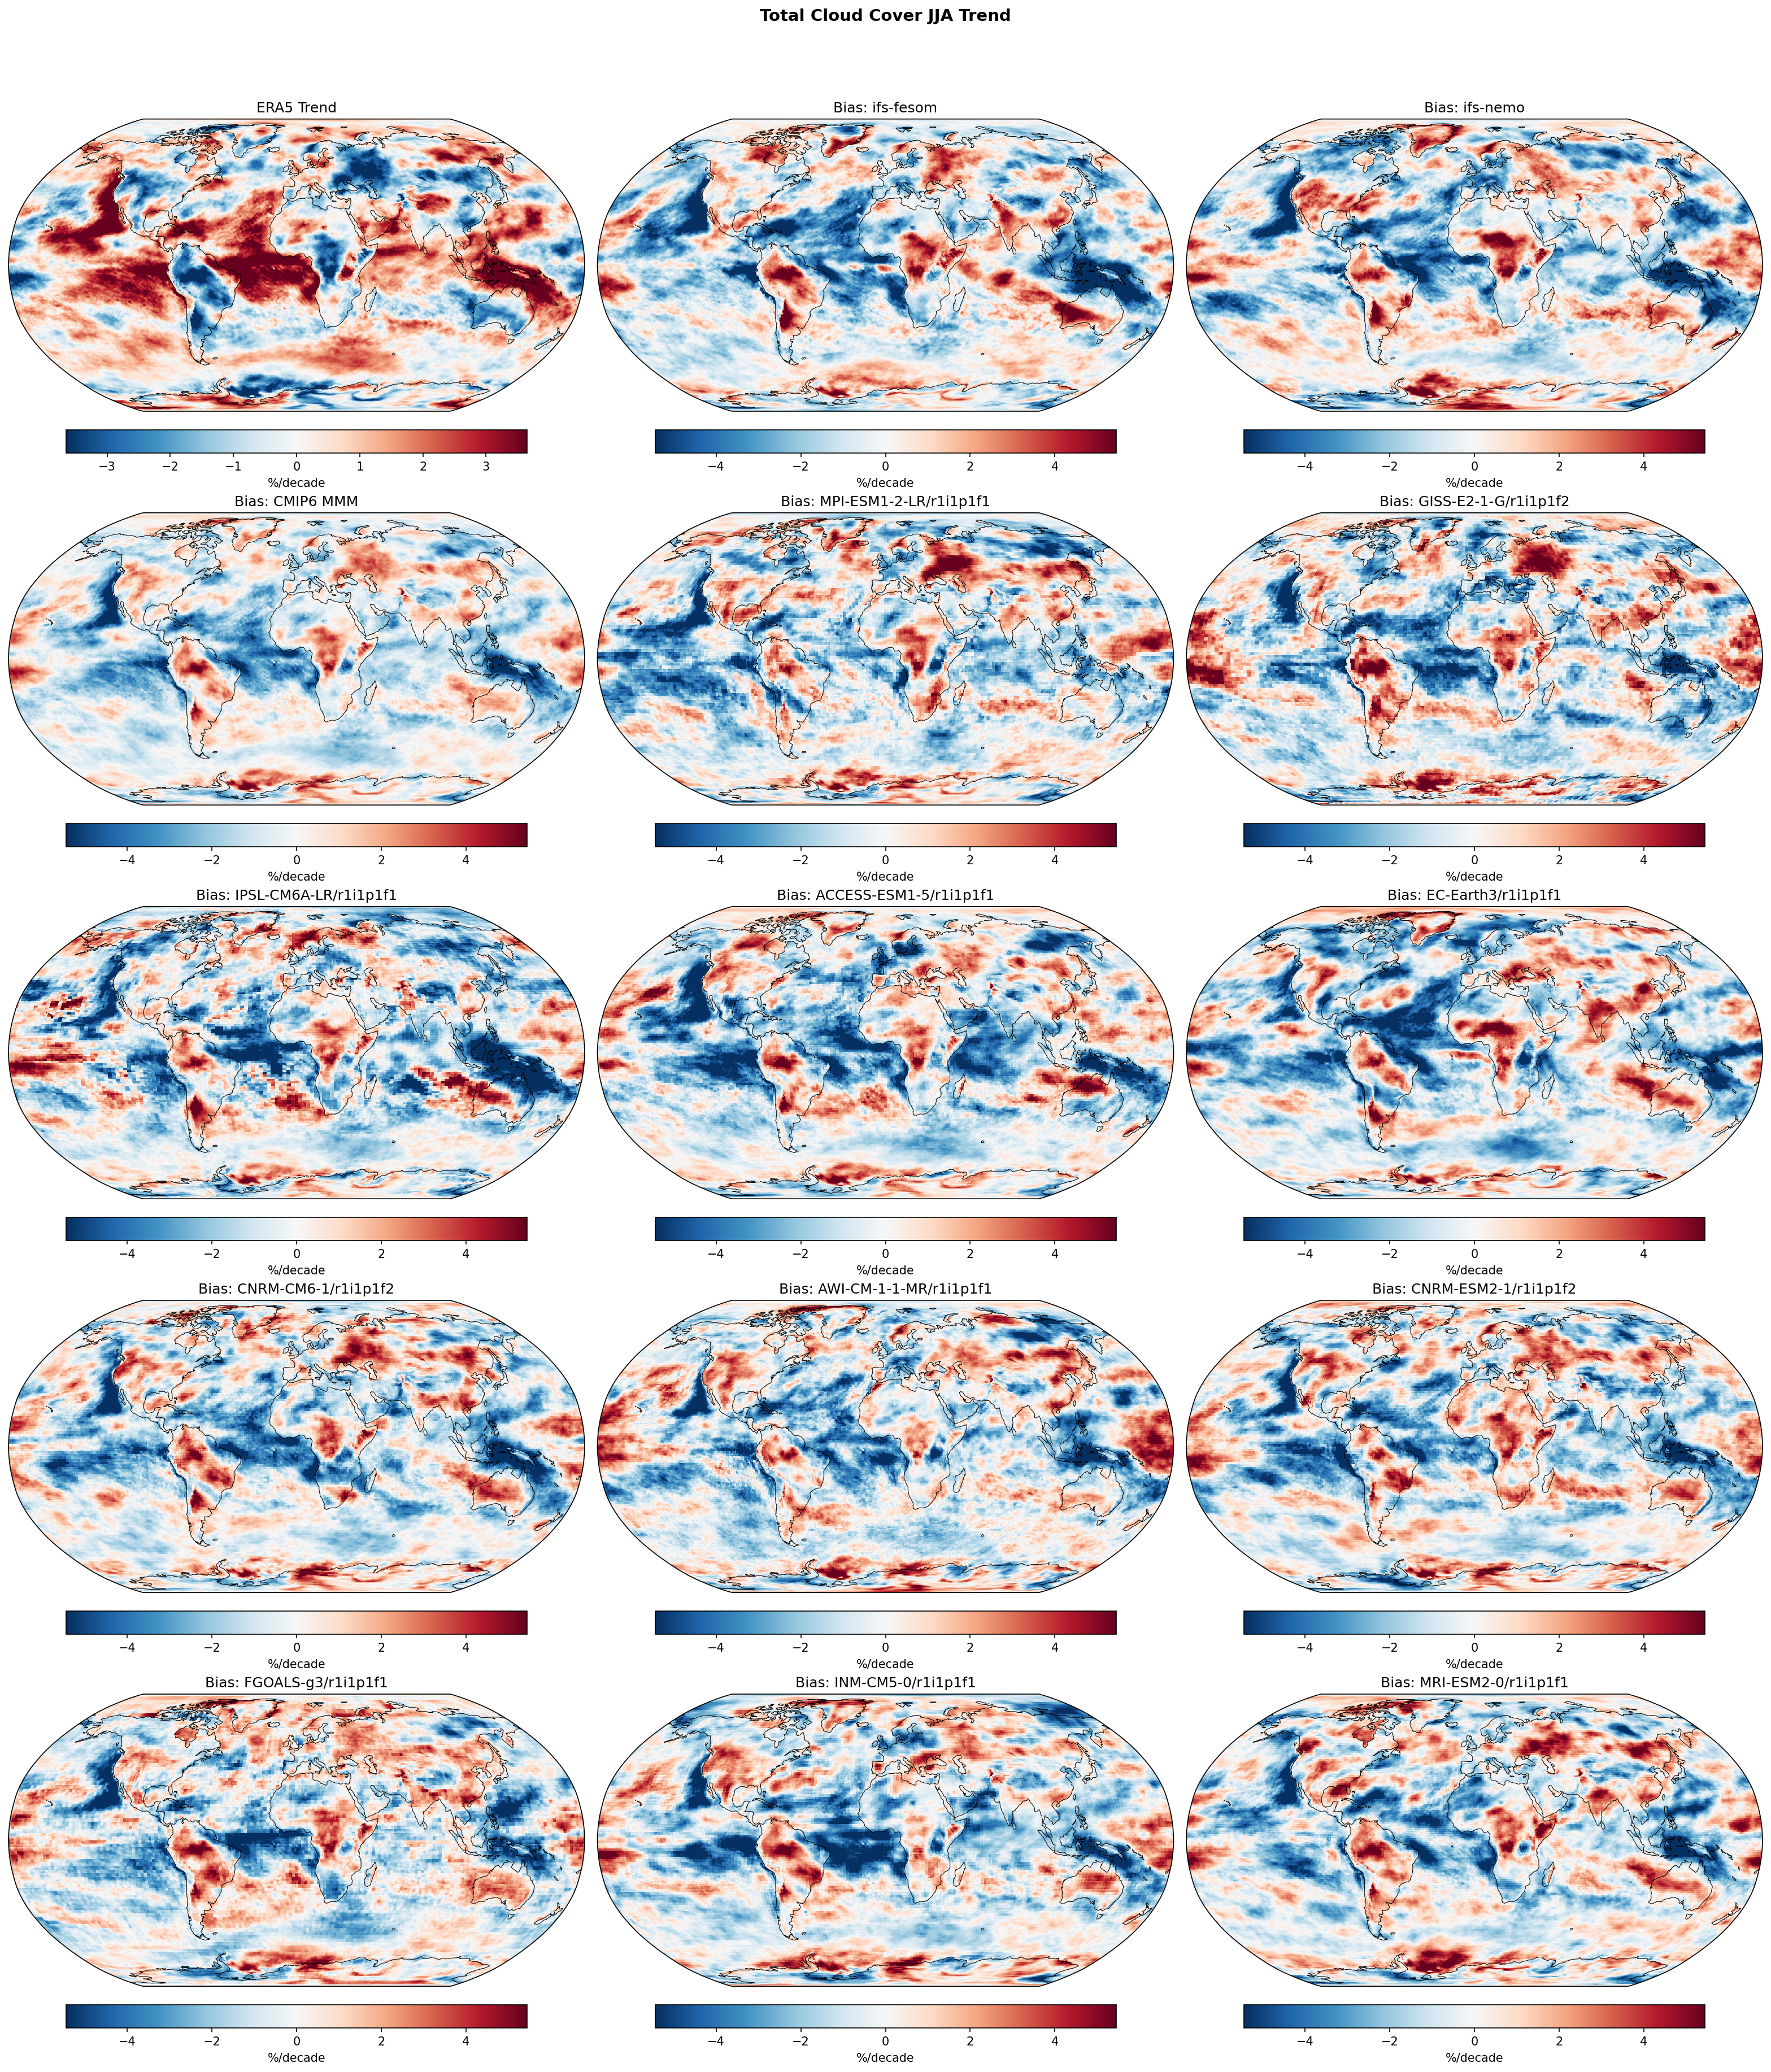
| Variables | avg_tcc |
|---|---|
| Models | ifs-fesom, ifs-nemo, CMIP6 MMM, MPI-ESM1-2-LR/r1i1p1f1, GISS-E2-1-G/r1i1p1f2, IPSL-CM6A-LR/r1i1p1f1, ACCESS-ESM1-5/r1i1p1f1, EC-Earth3/r1i1p1f1, CNRM-CM6-1/r1i1p1f2, AWI-CM-1-1-MR/r1i1p1f1, CNRM-ESM2-1/r1i1p1f2, FGOALS-g3/r1i1p1f1, INM-CM5-0/r1i1p1f1, MRI-ESM2-0/r1i1p1f1 |
| Reference Dataset | ERA5 |
| Units | %/decade |
| Period | 1990–2014 |
| CMIP6 MMM | Global Mean Trend Diff: -0.54 · Trend Rmse: None |
| MPI-ESM1-2-LR/r1i1p1f1 | Global Mean Trend Diff: -0.54 · Trend Rmse: None |
| GISS-E2-1-G/r1i1p1f2 | Global Mean Trend Diff: -0.40 · Trend Rmse: None |
| IPSL-CM6A-LR/r1i1p1f1 | Global Mean Trend Diff: -0.70 · Trend Rmse: None |
| ACCESS-ESM1-5/r1i1p1f1 | Global Mean Trend Diff: -0.76 · Trend Rmse: None |
| EC-Earth3/r1i1p1f1 | Global Mean Trend Diff: -0.71 · Trend Rmse: None |
| CNRM-CM6-1/r1i1p1f2 | Global Mean Trend Diff: -0.54 · Trend Rmse: None |
| AWI-CM-1-1-MR/r1i1p1f1 | Global Mean Trend Diff: -0.52 · Trend Rmse: None |
| CNRM-ESM2-1/r1i1p1f2 | Global Mean Trend Diff: -0.45 · Trend Rmse: None |
| FGOALS-g3/r1i1p1f1 | Global Mean Trend Diff: -0.37 · Trend Rmse: None |
| INM-CM5-0/r1i1p1f1 | Global Mean Trend Diff: -0.62 · Trend Rmse: None |
| MRI-ESM2-0/r1i1p1f1 | Global Mean Trend Diff: -0.38 · Trend Rmse: None |
Summary high
This figure evaluates linear trends in JJA Total Cloud Cover (TCC) over the period 1990–2014, comparing ERA5 reanalysis with high-resolution DestinE models (IFS-FESOM, IFS-NEMO) and the CMIP6 ensemble. The diagnostic highlights spatial discrepancies in decadal evolution, particularly in the tropics.
Key Findings
- A systematic 'dipole' bias exists in the Tropical Pacific across all models (IFS and CMIP6): models underestimate the observed increasing cloudiness in the Western Pacific (negative bias) and underestimate the observed clearing in the Eastern Pacific (positive bias).
- IFS-FESOM and IFS-NEMO show remarkably similar trend bias patterns, indicating that the atmospheric component (IFS) or common coupled forcing dominates the cloud trend response rather than the specific ocean grid formulation.
- Models exhibit a widespread negative trend bias over tropical land masses, particularly the Amazon and Central Africa, where they fail to capture the strong positive cloud cover trends seen in ERA5.
- Globally, all models show a negative mean trend difference (approx. -0.4 to -0.7 %/decade) relative to ERA5, suggesting a general tendency to simulate drying or cloud clearing trends more aggressively than observed in the reanalysis.
Spatial Patterns
The dominant feature is the zonal discrepancy in the Tropical Pacific. ERA5 shows a pattern consistent with a strengthening Walker circulation (more clouds in the warm pool, fewer in the cold tongue). The models' bias maps show the inverse (blue in the west, red in the east), implying they simulate a neutral or weakening Walker circulation trend. Over land, strong negative biases (blue) are prevalent over South America and Africa.
Model Agreement
There is high inter-model agreement regarding the sign and spatial structure of the biases. IFS-FESOM and IFS-NEMO are nearly indistinguishable, and their patterns align closely with the CMIP6 Multi-Model Mean (MMM). This suggests the bias is driven by systematic errors common to coupled climate models (e.g., response to forcing or internal variability phasing) rather than model-specific resolution or parameterization details.
Physical Interpretation
The bias patterns reflect the well-known discrepancy between modeled and observed historical trends in the Pacific. During 1990–2014, the real world experienced a 'La Niña-like' trend with a strengthened Walker circulation (increased convection/clouds in the West Pacific, increased subsidence/clearing in the East). Coupled models, including the high-res DestinE simulations, typically produce an 'El Niño-like' or uniform warming trend, failing to capture this circulation intensification. Consequently, they underestimate cloud cover increases in the Maritime Continent and underestimate cloud reductions in the eastern Pacific.
Caveats
- The analysis period (1990–2014) is relatively short (25 years), making trends highly susceptible to internal climate variability (e.g., IPO phase). Disagreements may stem from differing internal variability phases rather than structural model physics errors.
- ERA5 cloud cover trends may contain artifacts due to changes in the satellite observing system over the reanalysis period.
TOA Net Longwave Radiation Annual Linear Trend
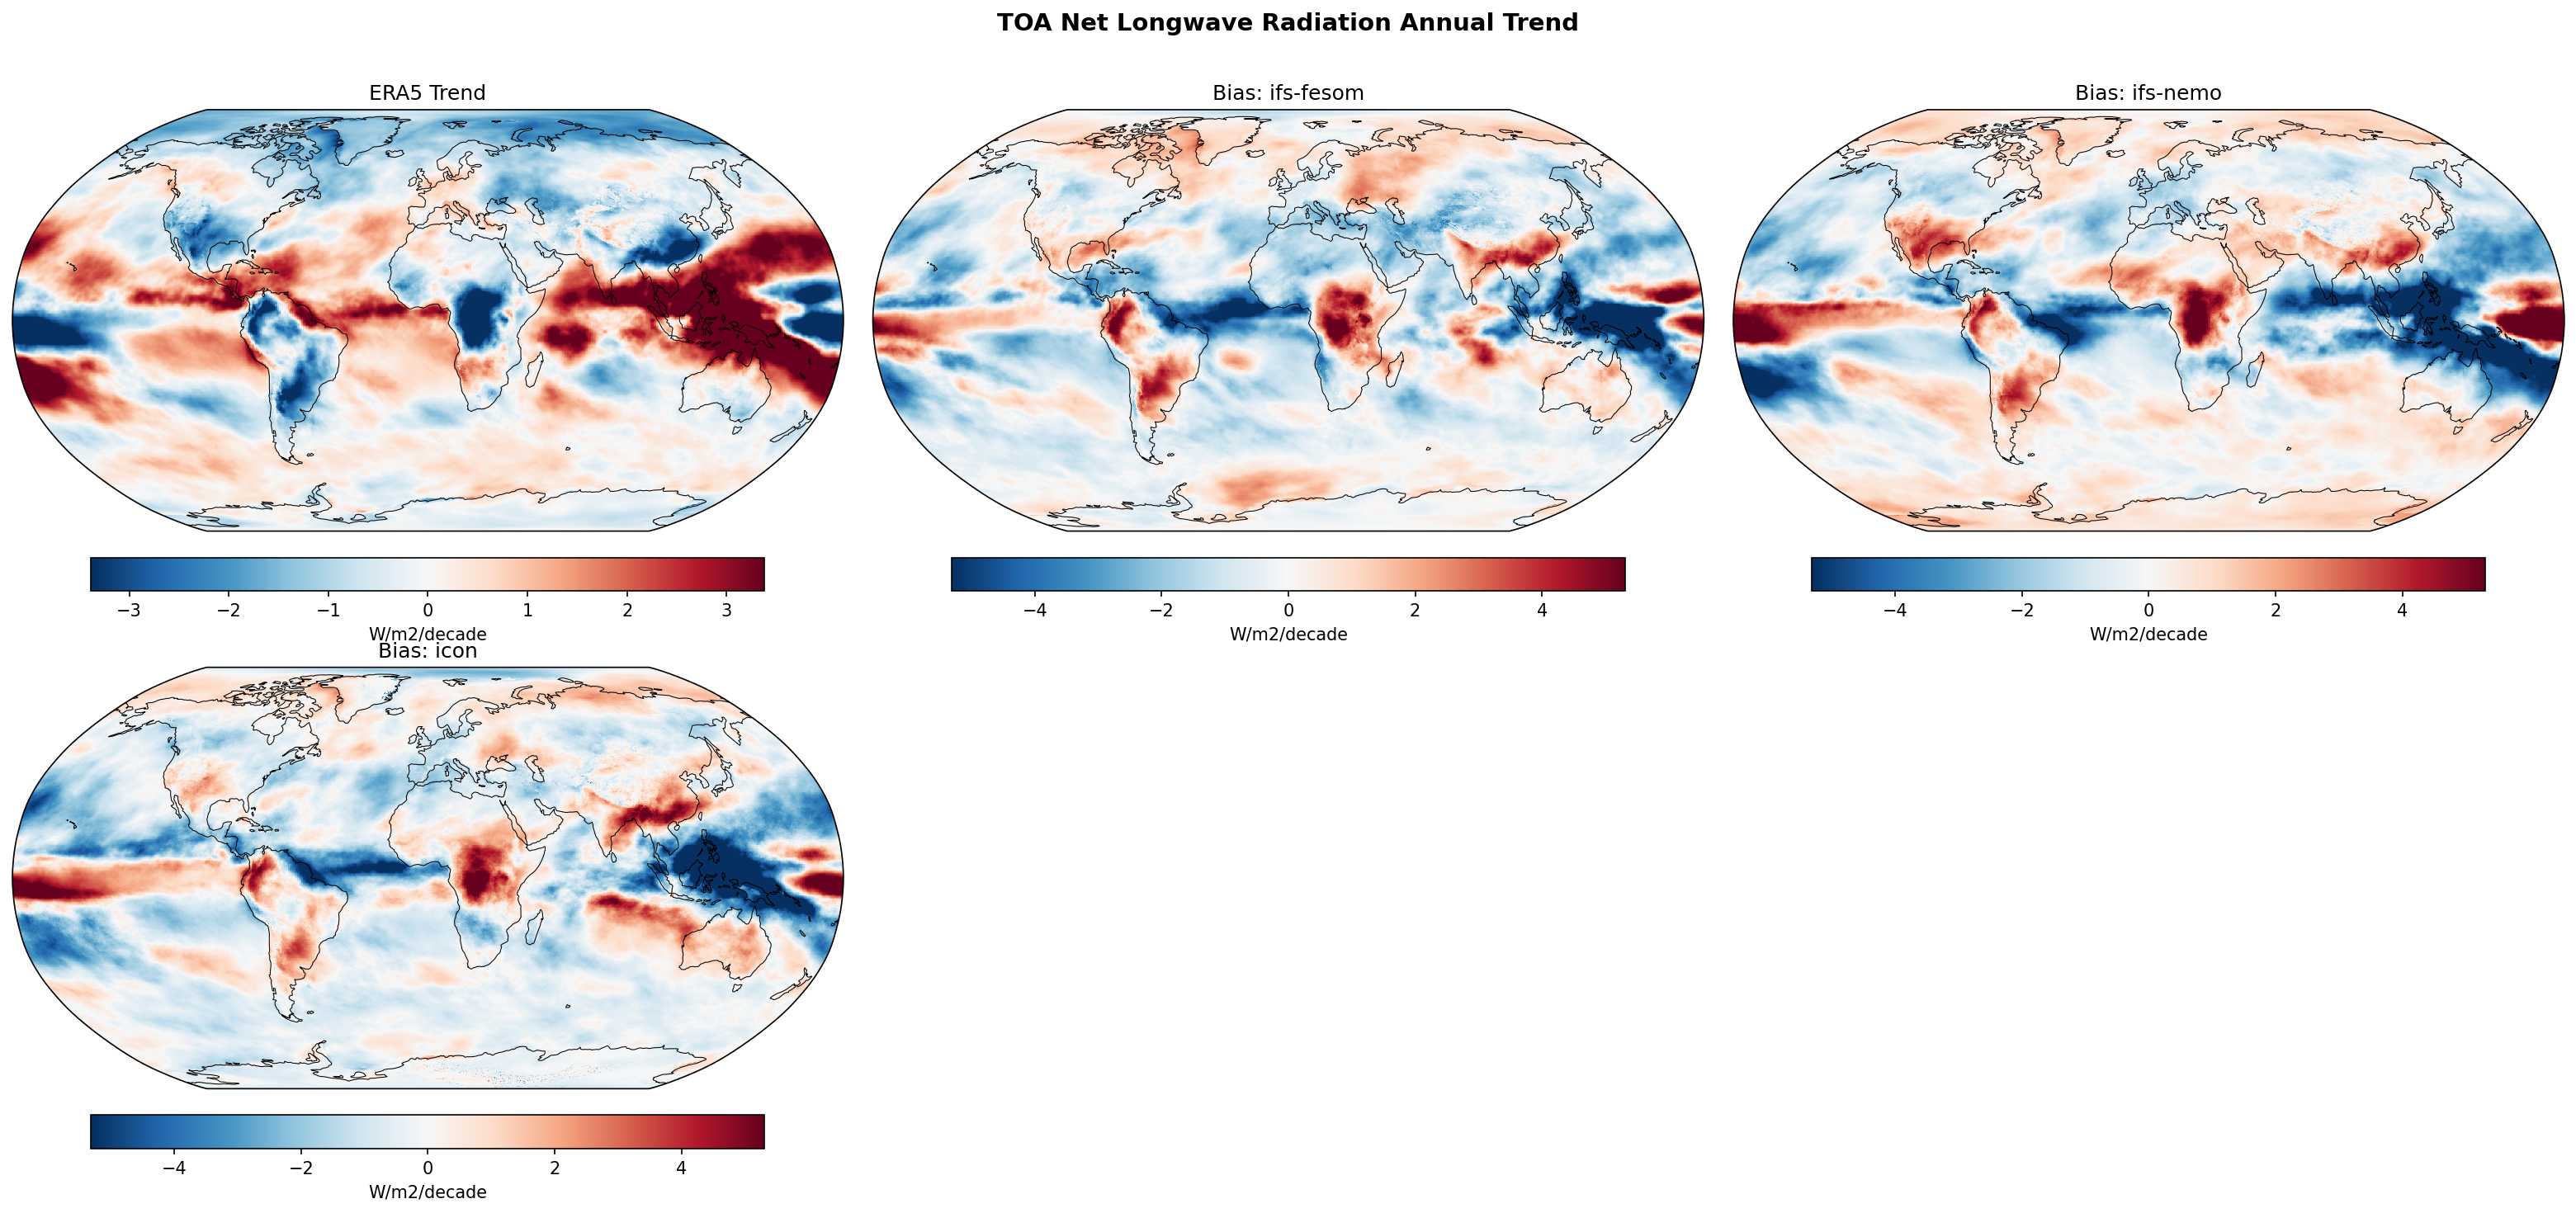
| Variables | avg_tnlwrf |
|---|---|
| Models | ifs-fesom, ifs-nemo, icon |
| Reference Dataset | ERA5 |
| Units | W/m2/decade |
| Period | 1990–2014 |
| ifs-fesom | Global Mean Trend: -0.23 · Global Mean Trend Diff: -0.47 · Trend Rmse: 1.94 |
| ifs-nemo | Global Mean Trend: -0.09 · Global Mean Trend Diff: -0.32 · Trend Rmse: 2.21 |
| icon | Global Mean Trend: -0.23 · Global Mean Trend Diff: -0.46 · Trend Rmse: 2.02 |
Summary high
This figure compares the 1990–2014 annual linear trends in TOA Net Longwave Radiation (OLR) between three high-resolution coupled models and ERA5 observations. The analysis highlights a significant discrepancy in the tropical Pacific, where models fail to capture the observed intensification of the Walker Circulation.
Key Findings
- Opposing Tropical Pacific Trends: ERA5 shows a distinct La Niña-like trend pattern (decreasing OLR/more convection over the Maritime Continent, increasing OLR/clearing over the Central Pacific). Models fail to reproduce this, resulting in a dipole bias pattern (positive bias West, negative bias East).
- Global Trend Sign Reversal: All three models simulate a global decrease in outgoing longwave radiation (approx. -0.1 to -0.2 W/m²/decade), whereas ERA5 implies a global increase (inferred ~+0.2 W/m²/decade), leading to substantial negative global mean trend biases.
- Continental Land Biases: Strong positive trend biases (red) are evident over the Amazon and Congo basins, suggesting the models simulate stronger drying or surface warming (leading to higher OLR) than observed in ERA5.
- Atmospheric Dominance: The bias patterns of IFS-FESOM and IFS-NEMO are nearly identical, indicating that the atmospheric model formulation (IFS) dictates the radiative trend errors rather than the ocean coupling (FESOM vs. NEMO).
Spatial Patterns
ERA5 exhibits a strong zonal asymmetry in the tropical Pacific (blue trend West, red trend East) characteristic of the observational 'Hiatus' period (1998-2012) trade wind intensification. The models generally show weaker or opposing gradients. Over land, ERA5 shows moderate positive trends, while models show intense positive trends, leading to strong red biases over South America and Africa.
Model Agreement
There is very high agreement between IFS-FESOM and IFS-NEMO, confirming that systematic biases stem from the shared atmospheric component. ICON shares the broad tropical bias structure but differs in regional details over the Atlantic and Indian Oceans.
Physical Interpretation
The primary driver of the mismatch is likely the phasing of multi-decadal internal variability (e.g., the Interdecadal Pacific Oscillation or IPO). The 1990–2014 period saw a strengthening of the Walker Circulation in reality, which free-running coupled models do not spontaneously reproduce unless constrained or by chance. The global sign difference suggests models may be responding with a stronger water vapor/cloud feedback (trapping heat) compared to the observational record where clear-sky or surface emission changes dominated.
Caveats
- The 25-year analysis period is short and heavily influenced by internal climate variability; uninitialized coupled models are not expected to match the historical phase of internal modes.
- Trend estimates in reanalysis (ERA5) are subject to changes in the observing system over time.
TOA Net Longwave Radiation DJF Linear Trend
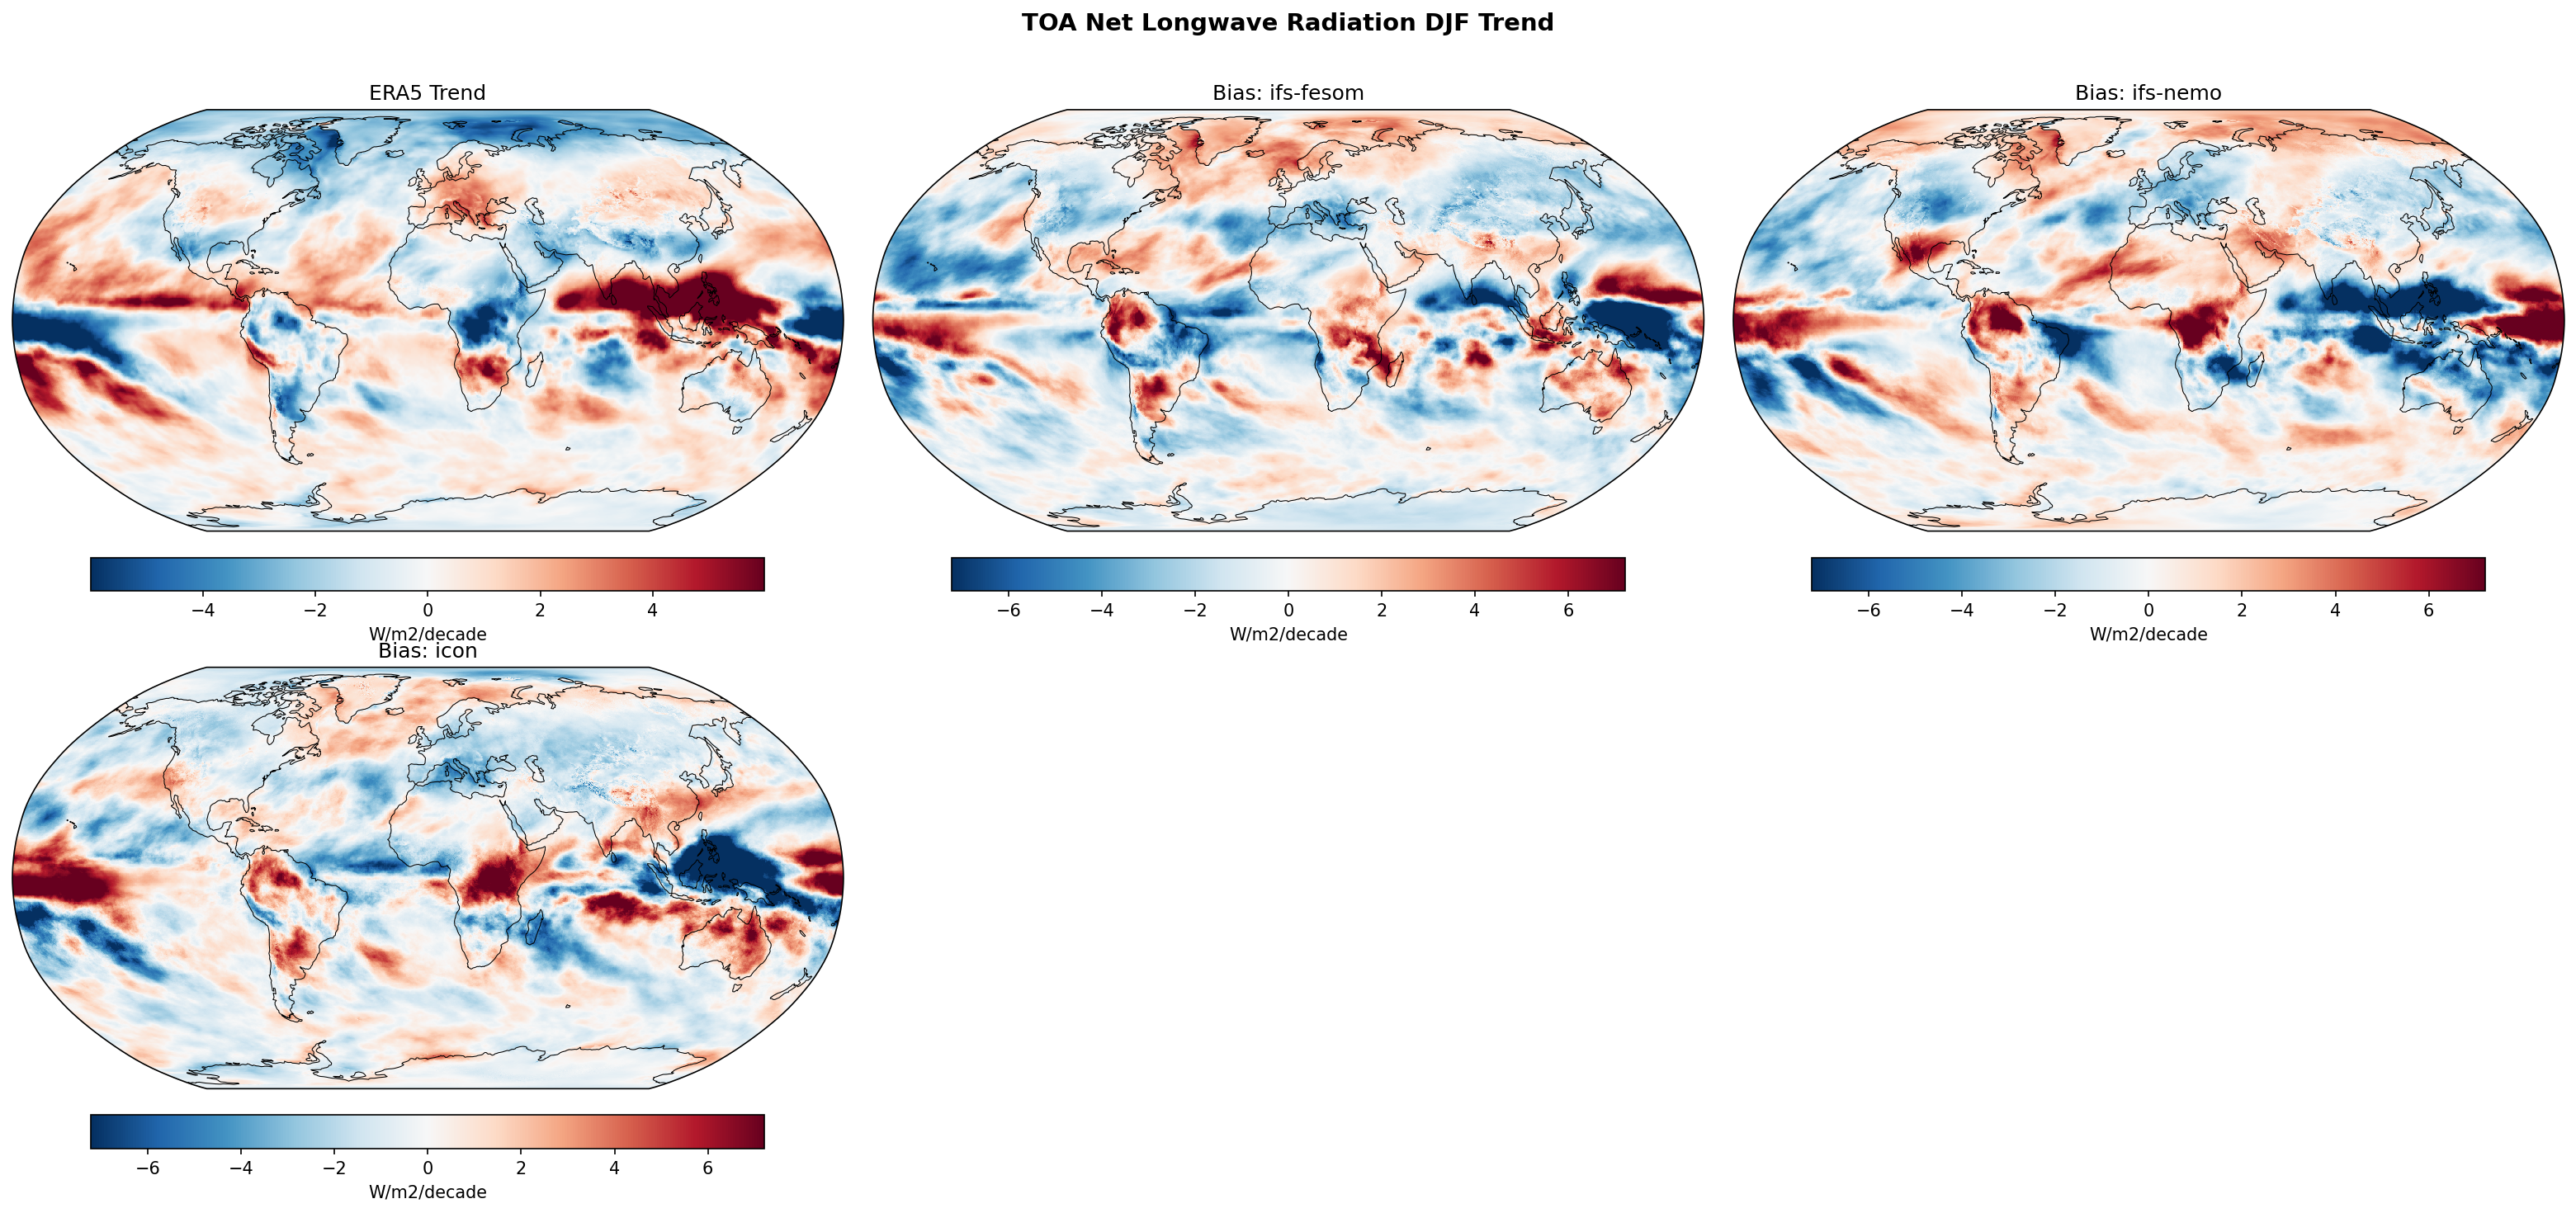
| Variables | avg_tnlwrf |
|---|---|
| Models | ifs-fesom, ifs-nemo, icon |
| Reference Dataset | ERA5 |
| Units | W/m2/decade |
| Period | 1990–2014 |
Summary high
This diagnostic evaluates DJF linear trends (1990–2014) in TOA Net Longwave Radiation, revealing a major discrepancy in tropical Pacific atmospheric circulation changes between the models and ERA5 reanalysis.
Key Findings
- ERA5 displays a distinct La Niña-like trend pattern characterized by increased convective cloud trapping (positive net LW trend) over the Maritime Continent and increased outgoing radiation (negative net LW trend) in the Central Pacific.
- All three models (IFS-FESOM, IFS-NEMO, ICON) fail to capture this strengthening of the Walker circulation, exhibiting large-scale biases that are spatially anti-correlated with the observed trends.
- The models show a positive trend bias in the Central Pacific and a negative trend bias in the Maritime Continent, implying they simulate a weakening or neutral Walker circulation trend rather than the observed strengthening.
- Bias patterns are highly consistent across the two IFS-based models, while ICON shows similar tropical biases but distinct regional differences in the Indian Ocean.
Spatial Patterns
The dominant feature is a zonal dipole in the tropical Pacific. ERA5 shows a strong positive trend (red) in the west and negative (blue) in the central/east. The model bias maps show the inverse: strong red biases (overestimation of net LW/underestimation of OLR) in the central Pacific and blue biases (underestimation of net LW) in the western Pacific/Indo-Pacific warm pool. Notable biases also exist over South America (Amazon), where models generally show negative biases.
Model Agreement
There is high inter-model agreement regarding the sign and structure of the tropical Pacific errors. IFS-FESOM and IFS-NEMO are nearly identical, suggesting the atmospheric model (IFS) or common forcing dominates the response. ICON shares the main tropical Pacific bias structure but exhibits more intense negative biases extending into the Indian Ocean.
Physical Interpretation
The period 1990–2014 is historically associated with a negative phase of the Interdecadal Pacific Oscillation (IPO) and a strengthening of the Pacific trade winds (La Niña-like trend). The models likely produce a greenhouse-gas-forced El Niño-like warming trend or simply fail to synchronize with the specific phase of internal decadal variability observed in the real world. Consequently, the models simulate more convection (higher clouds, less OLR) in the Central Pacific and less in the West than was observed, leading to the pronounced dipole bias.
Caveats
- The analysis period (1990–2014) is relatively short (25 years) and strongly influenced by internal decadal variability (e.g., the 'warming hiatus'), which free-running coupled models are not expected to reproduce in phase unless initialized specifically for decadal prediction.
- Interpretation assumes standard sign convention where positive Net LW trend implies reduced OLR (increased cloud trapping).
TOA Net Longwave Radiation JJA Linear Trend
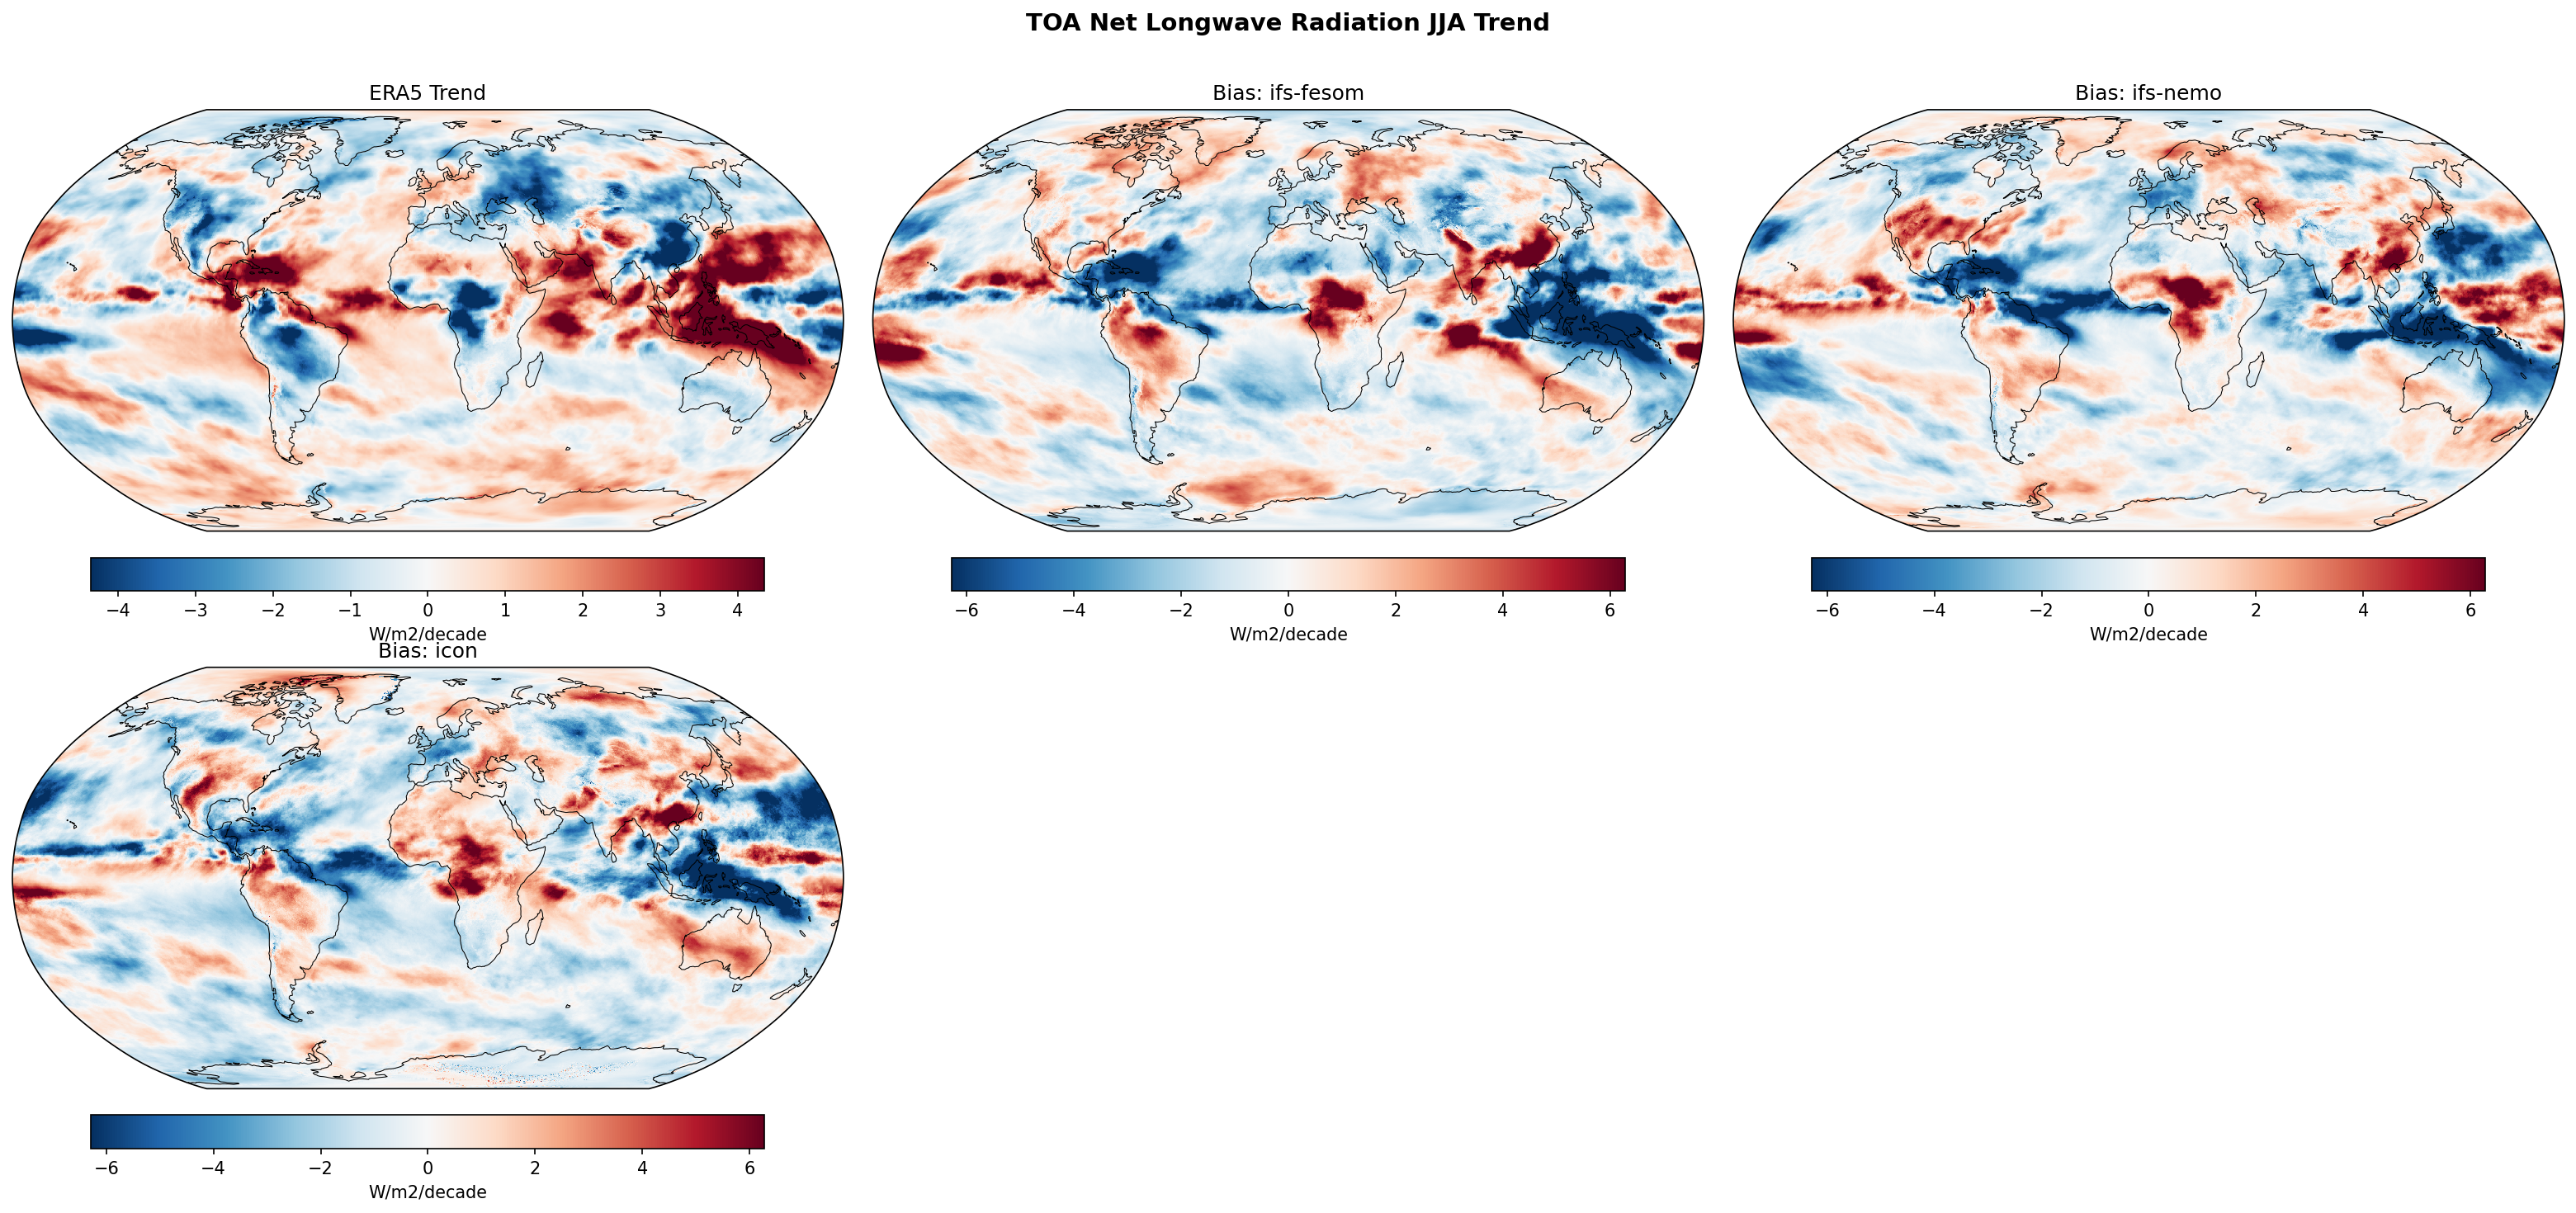
| Variables | avg_tnlwrf |
|---|---|
| Models | ifs-fesom, ifs-nemo, icon |
| Reference Dataset | ERA5 |
| Units | W/m2/decade |
| Period | 1990–2014 |
Summary high
This figure evaluates linear trends in JJA TOA Net Longwave Radiation (1990–2014), revealing that all three high-resolution models fail to capture the observed intensification of convective activity in the Indo-Pacific warm pool.
Key Findings
- ERA5 displays a distinct 'La Niña-like' trend pattern with increasing Net LW (enhanced convection) in the West Pacific/Maritime Continent and decreasing Net LW (reduced convection) in the Central Pacific.
- All three models exhibit a striking systematic dipole bias: they underestimate the positive trend in the West Pacific (blue bias) and overestimate the trend in the Central Pacific (red bias), effectively missing the observed strengthening of the Walker Circulation.
- IFS-FESOM and IFS-NEMO show nearly identical bias patterns, indicating that the choice of ocean grid (unstructured vs. structured) has negligible impact on these atmospheric radiation trend errors compared to shared atmospheric physics or forcing.
- Significant negative biases (underestimation of trend) are also evident in the Tropical Atlantic ITCZ region across all models.
Spatial Patterns
The dominant spatial feature is a zonal dipole in the Tropical Pacific. In observations (ERA5), there is a strong positive trend (red) in the Indo-Pacific warm pool and a negative trend (blue) in the Central/East Pacific. The model bias maps show the inverse image: negative biases (blue) over the Maritime Continent and positive biases (red) extending into the Central Pacific. This suggests the models simulate a more spatially uniform or 'El Niño-like' warming trend rather than the observed gradient sharpening.
Model Agreement
There is exceptionally high agreement between the three models regarding the spatial structure and sign of the biases. IFS-FESOM and IFS-NEMO are virtually indistinguishable. ICON shares the same broad tropical bias features but exhibits slightly different patterns over continental regions (e.g., South America) and high latitudes, suggesting the primary error driver is common to the coupled state of the Tropical Pacific across these simulations.
Physical Interpretation
TOA Net Longwave Radiation trends primarily reflect changes in cloud top height and deep convection (higher/colder clouds = reduced OLR = increased Net LW). The observations show a trend of intensifying convection over the Asian Monsoon/Maritime Continent region and suppressing convection in the Central Pacific (strengthening Walker Circulation) during this 1990–2014 period. The models' inability to reproduce this—often referred to as the 'pattern effect' or historical trend mismatch—is a known issue in coupled climate modeling, where models often simulate expanding warm pools rather than the observed dynamical sharpening of sea surface temperature and convective gradients.
Caveats
- The analysis period (1990–2014) is relatively short (25 years) and is strongly influenced by internal decadal variability (e.g., IPO/PDO phases), which coupled models are not expected to phase-match with observations unless initialized.
- Differences in observational products (e.g., CERES vs. ERA5) can sometimes be significant for trends, though the ERA5 pattern here is consistent with known hydroclimatic shifts.
TOA Net Longwave Radiation (Clear-Sky) Annual Linear Trend
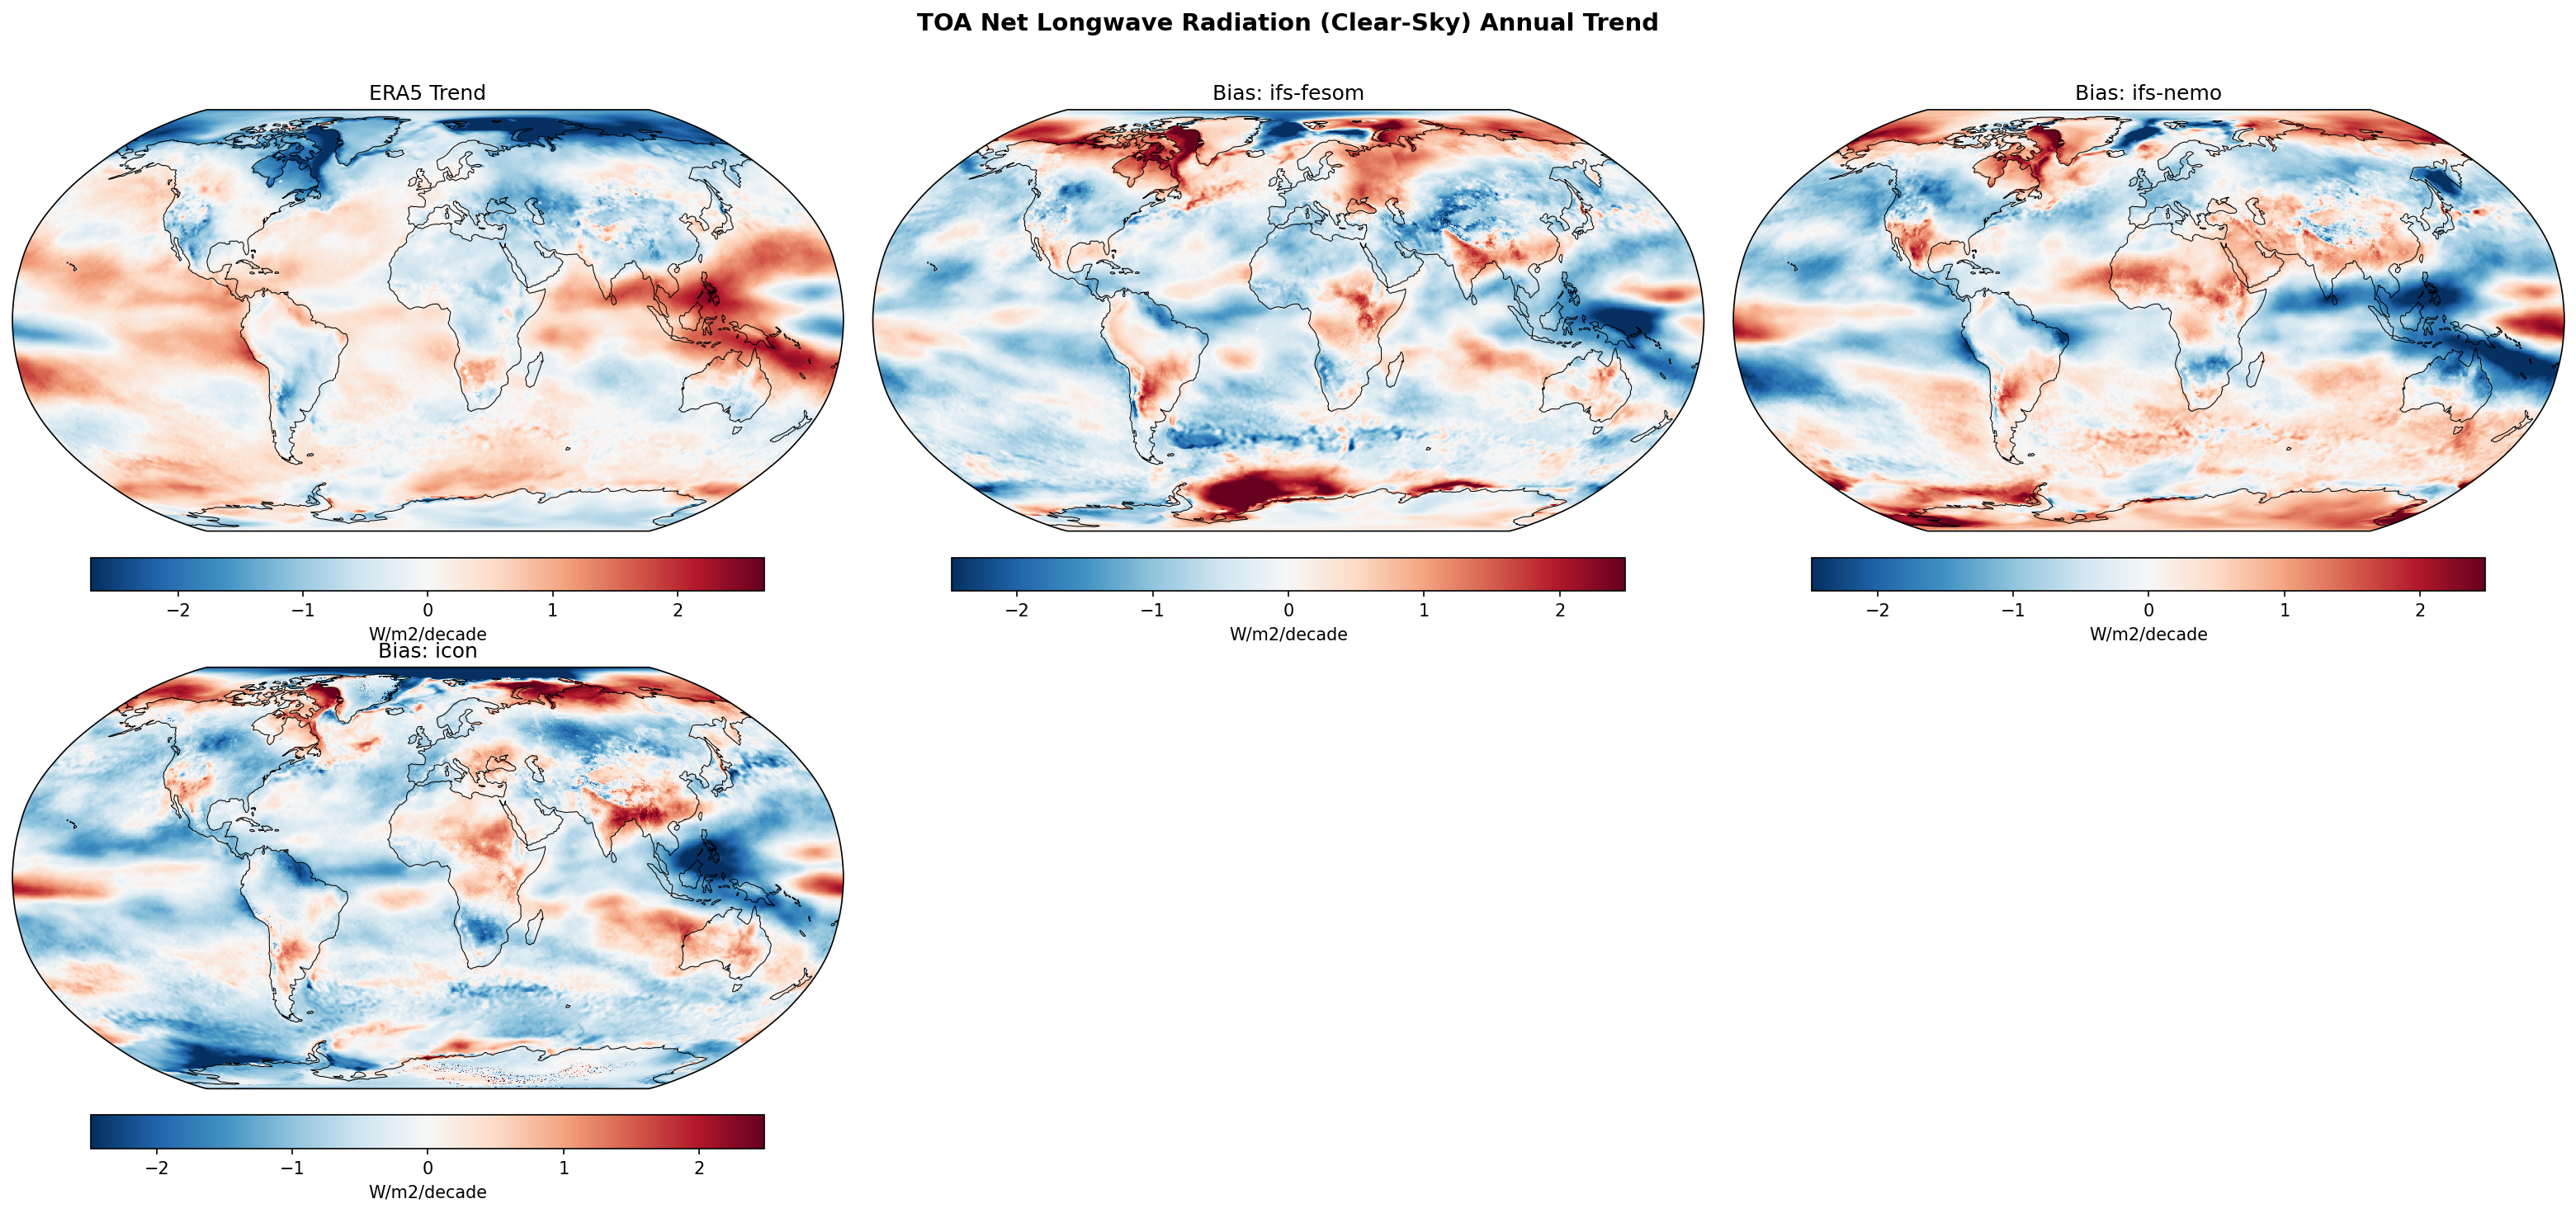
| Variables | avg_tnlwrfcs |
|---|---|
| Models | ifs-fesom, ifs-nemo, icon |
| Reference Dataset | ERA5 |
| Units | W/m2/decade |
| Period | 1990–2014 |
| ifs-fesom | Global Mean Trend: -0.16 · Global Mean Trend Diff: -0.23 · Trend Rmse: 0.80 |
| ifs-nemo | Global Mean Trend: -0.08 · Global Mean Trend Diff: -0.15 · Trend Rmse: 0.85 |
| icon | Global Mean Trend: -0.26 · Global Mean Trend Diff: -0.32 · Trend Rmse: 0.82 |
Summary high
This diagnostic evaluates annual linear trends in TOA Net Clear-Sky Longwave Radiation (1990–2014), a proxy for surface temperature and water vapor changes, comparing three DestinE models (IFS-FESOM, IFS-NEMO, ICON) against ERA5 reanalysis.
Key Findings
- Models exhibit a systematic negative trend bias (global mean diffs: -0.15 to -0.32 W/m²/decade), indicating they simulate stronger increases in outgoing radiation (surface warming) than ERA5.
- ERA5 shows positive trends (red) in the Eastern Pacific, consistent with the surface cooling associated with the negative phase of the IPO ('global warming hiatus') during this period; models generally fail to capture this, showing negative (blue) biases.
- ICON shows the strongest negative trend bias (-0.32 W/m²/decade) and highest warming rate (-0.26 W/m²/decade), while IFS-NEMO has the smallest global bias.
- High-latitude regions (Arctic/Southern Ocean) show positive (red) biases in models, suggesting they underestimate the strong polar warming/OLR increase seen in observations or simulate excessive water vapor trapping.
Spatial Patterns
ERA5 displays a distinct 'hiatus' pattern with positive trends (reduced cooling to space/surface cooling) in the Eastern Pacific and Southern Ocean. The models generally show widespread negative trends (blue bias) in the tropics and mid-latitudes, indicative of spatially uniform GHG-driven warming that lacks the specific internal variability phasing of the observations. Notable red biases appear over the North Atlantic subpolar gyre and Southern Ocean in the IFS models.
Model Agreement
All three models agree on the sign of the global bias (negative) and the broad spatial structure (blue tropics, red poles). The two IFS variants (FESOM and NEMO) are spatially very similar, implying the atmospheric physics dominates the clear-sky radiative trend, though NEMO has a smaller global mean bias. ICON is an outlier with significantly stronger negative trends (more warming/OLR release) globally.
Physical Interpretation
Net Clear-Sky Longwave trend is primarily driven by the Planck response (surface warming increases OLR, making Net LW more negative). The period 1990–2014 includes the 'global warming hiatus,' where observed surface warming slowed due to internal variability (e.g., ocean heat uptake). The models, likely responding primarily to radiative forcing without initialized internal variability, continue to warm rapidly, leading to the observed negative bias (excessive increase in outgoing radiation). The positive biases at high latitudes may reflect weaker polar amplification in the models compared to ERA5 or differences in lapse-rate/water-vapor feedbacks.
Caveats
- The analysis period (1990-2014) is short and dominated by internal variability (IPO/Hiatus), so model-obs discrepancies may reflect phasing mismatches rather than fundamental sensitivity errors.
- Clear-sky diagnostics exclude cloud radiative effects; total radiation trends might differ significantly.
TOA Net Longwave Radiation (Clear-Sky) DJF Linear Trend
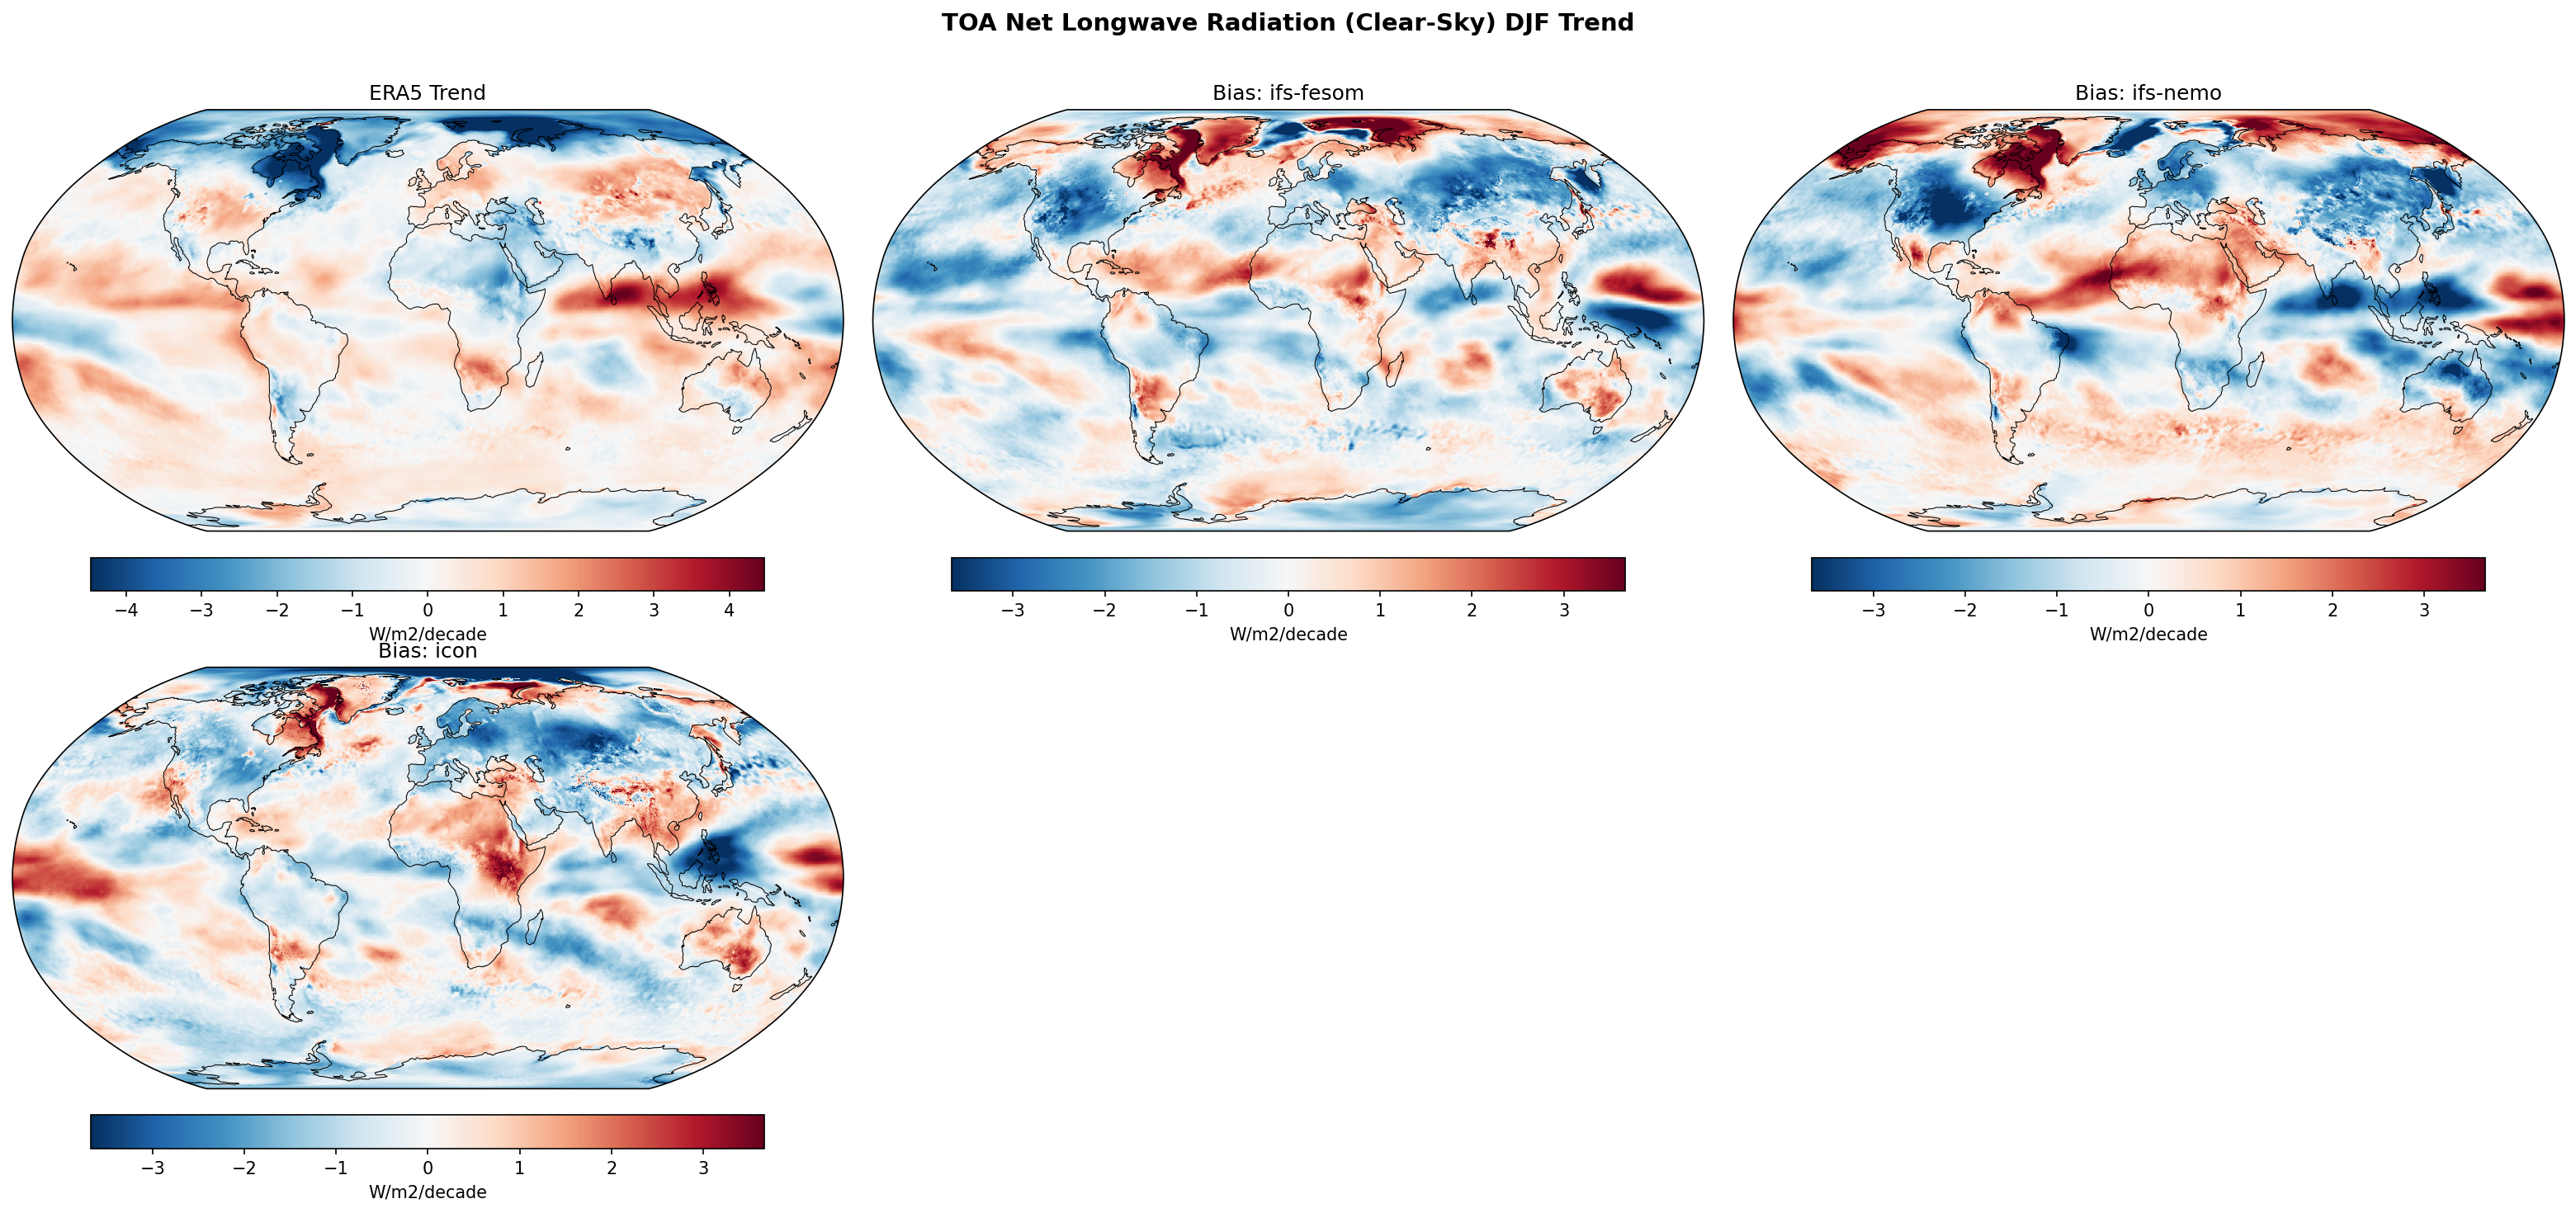
| Variables | avg_tnlwrfcs |
|---|---|
| Models | ifs-fesom, ifs-nemo, icon |
| Reference Dataset | ERA5 |
| Units | W/m2/decade |
| Period | 1990–2014 |
Summary high
This figure displays the 1990–2014 linear trend in DJF Clear-Sky TOA Net Longwave Radiation for ERA5 and the bias (model minus observation trend) for three coupled models (IFS-FESOM, IFS-NEMO, ICON). The analysis highlights a significant discrepancy in the Arctic, where models underestimate the observed trend of increasing heat loss associated with surface warming.
Key Findings
- **Arctic Trend Mismatch:** ERA5 shows a strong negative trend (blue, ~-4 W/m²/decade) in the Barents-Kara Sea region, indicative of increased outgoing radiation due to surface warming and sea-ice loss. All three models exhibit a strong positive bias (red) in this region, meaning they simulate a much weaker trend (less warming/ice loss) than observed.
- **IFS Model Similarity:** IFS-FESOM and IFS-NEMO show nearly identical bias patterns globally, suggesting that the atmospheric model physics (IFS) dominates the clear-sky radiative trend signal over the differences in ocean discretization (FESOM vs. NEMO).
- **Tropical Pacific Divergence:** Models generally show a negative bias (blue) in the eastern Pacific and North Atlantic, likely reflecting a failure to capture the specific phase of internal variability (e.g., cooling trends) observed in ERA5 during this period, resulting in modeled GHG-induced warming (increased OLR) where observations show steady or cooling conditions.
- **ICON Regional Specifics:** ICON displays a distinct strong positive bias (red) over the Arabian Sea and broader negative biases in the Southern Ocean compared to the IFS variants.
Spatial Patterns
The observational trend (ERA5) is dominated by strong negative values (heat loss) in the Arctic (Barents-Kara) and positive values (heat retention/cooling) in parts of the tropical oceans. The bias maps are spatially coherent, with high-latitude positive biases (red) indicating models underestimate the Arctic radiative response to warming, and tropical/mid-latitude negative biases (blue) suggesting models may overestimate warming (and thus OLR) in regions like the North Atlantic and East Pacific relative to the specific observational trajectory.
Model Agreement
There is exceptionally high agreement between IFS-FESOM and IFS-NEMO, indicating robustness across ocean grid choices for this metric. ICON shares the Arctic bias sign but differs in the magnitude and spatial distribution of biases in the tropics and Southern Hemisphere.
Physical Interpretation
Clear-sky TOA Net Longwave is primarily driven by surface temperature (Planck feedback) and water vapor. The negative trends in ERA5 over the Arctic correspond to rapid surface warming (likely sea-ice retreat) increasing Outgoing Longwave Radiation (OLR). The positive bias in the models implies they did not simulate the same magnitude of regional surface warming or sea-ice loss in the Barents-Kara sector during the 1990-2014 period. In the tropics, biases likely stem from discrepancies in SST trends, potentially due to the models not being synchronized with the observed phases of decadal variability (e.g., IPO, AMO).
Caveats
- The 1990–2014 period is relatively short and includes the so-called 'global warming hiatus,' making trends highly sensitive to internal decadal variability which free-running coupled models are not expected to reproduce in phase.
- The sign convention (Net = Down - Up) implies negative trends denote increased outgoing radiation (warming surface).
TOA Net Longwave Radiation (Clear-Sky) JJA Linear Trend
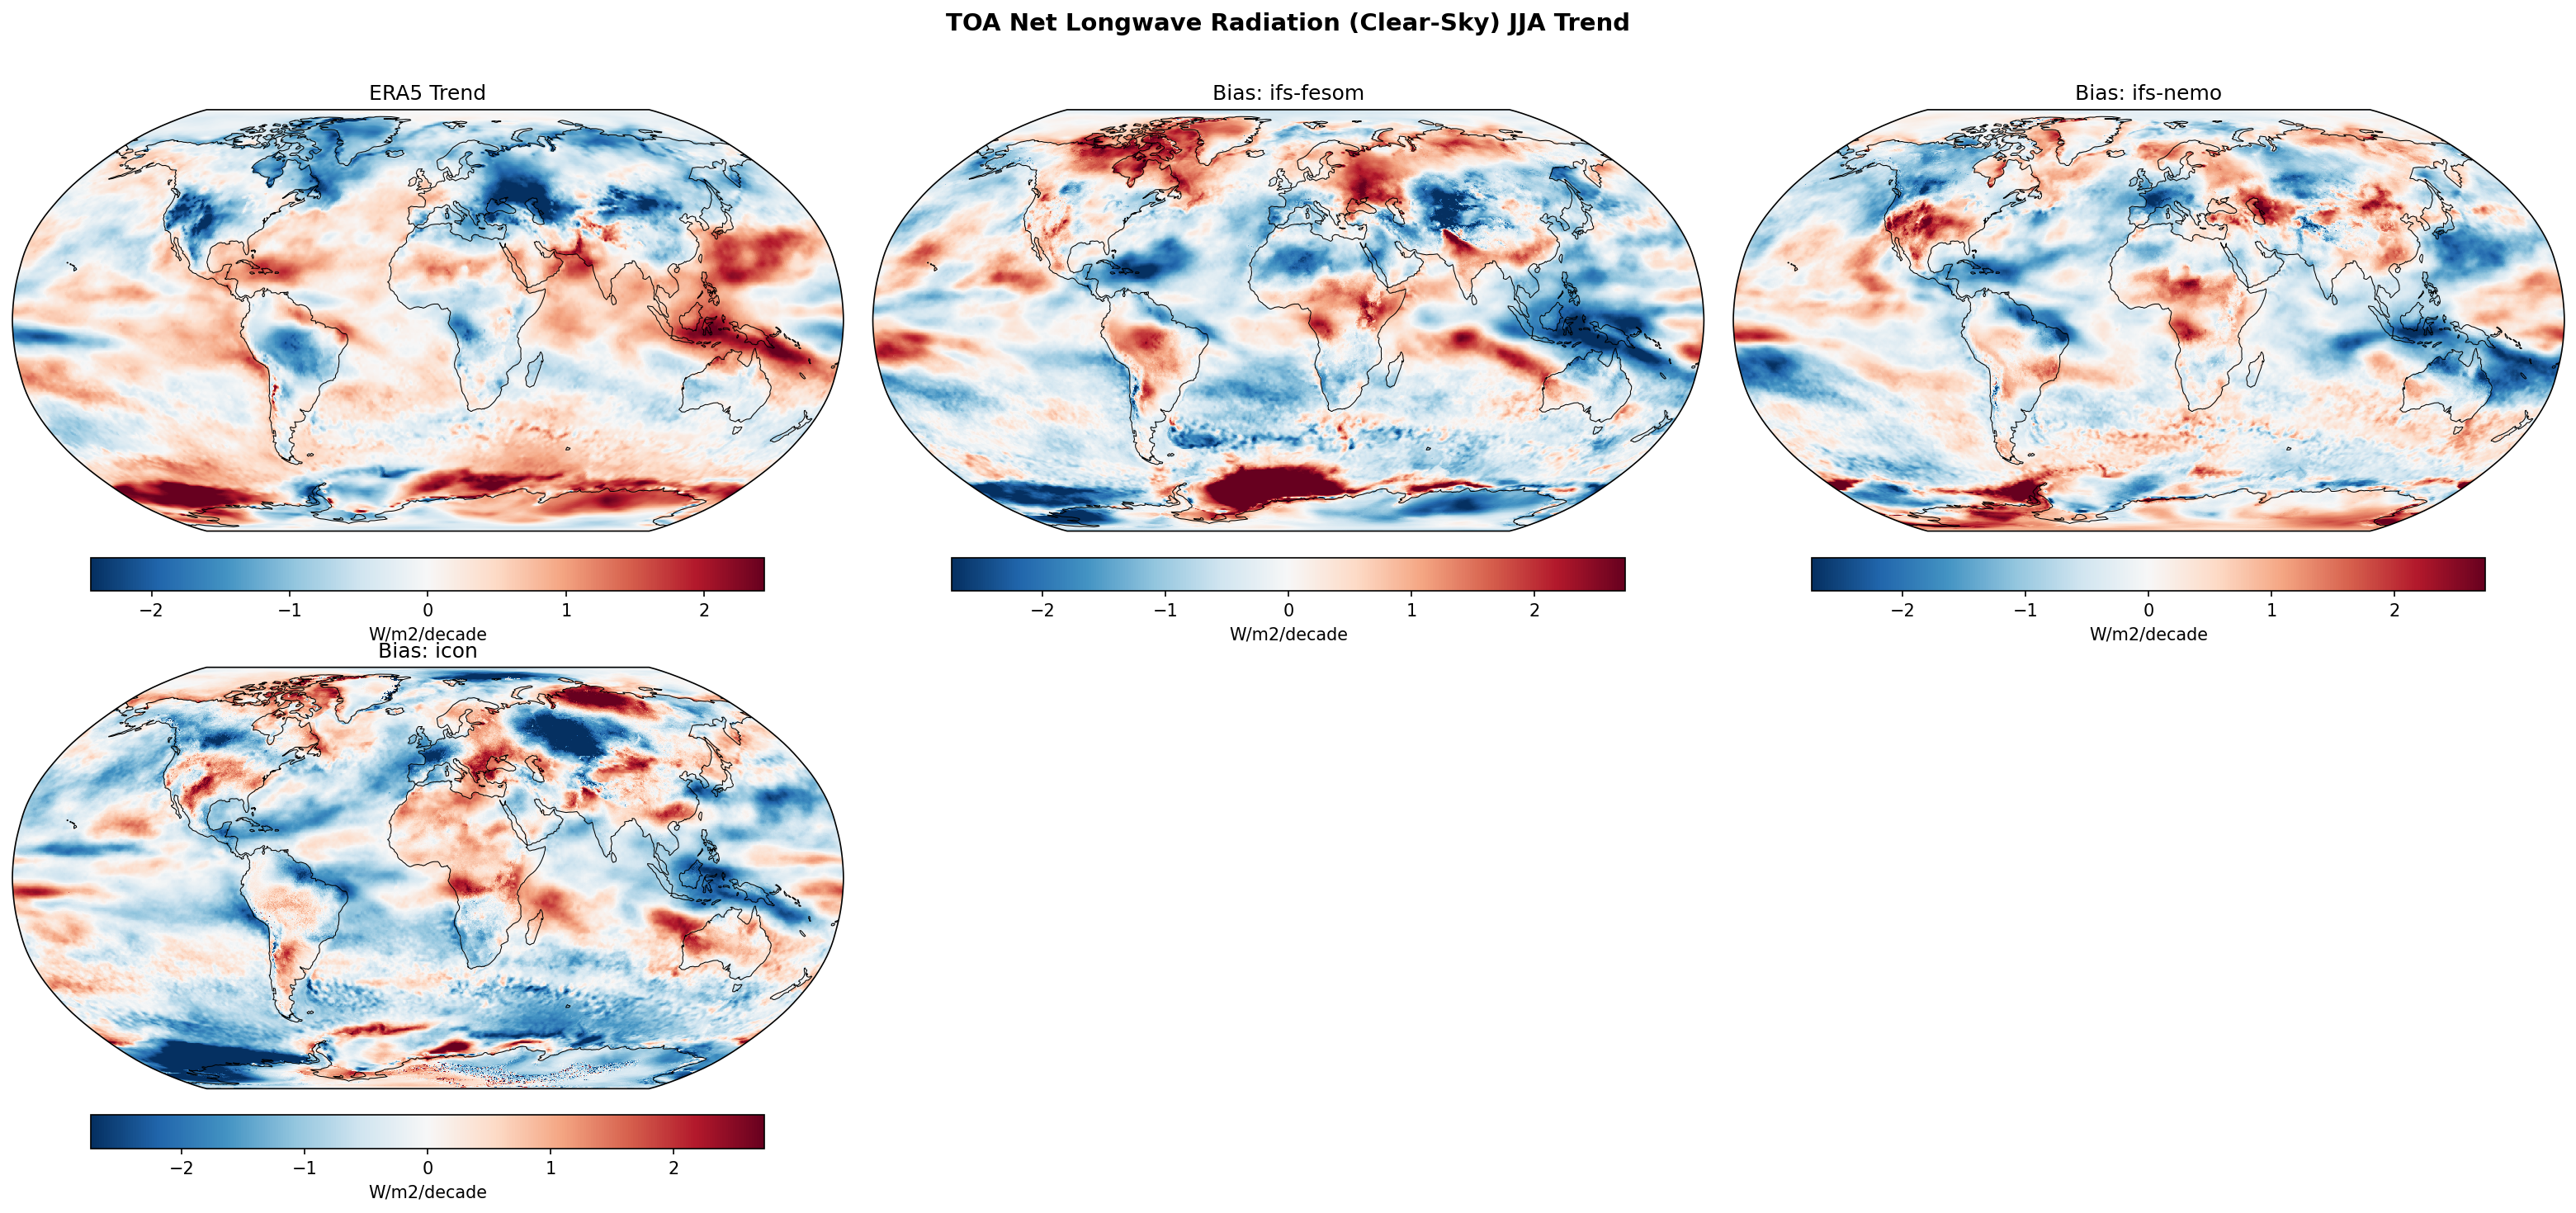
| Variables | avg_tnlwrfcs |
|---|---|
| Models | ifs-fesom, ifs-nemo, icon |
| Reference Dataset | ERA5 |
| Units | W/m2/decade |
| Period | 1990–2014 |
Summary medium
This diagnostic evaluates linear trends (1990–2014) in June-July-August (JJA) clear-sky TOA net longwave radiation. While the spatial patterns of the trends show some broad agreement, there are significant regional trend biases, particularly in the high latitudes, with a notable divergence between ICON and the IFS-based models in the Southern Ocean.
Key Findings
- Widespread positive trend bias in Northern High Latitudes: All three models exhibit a coherent positive bias (red colors) over the Arctic, Northern Canada, and Eurasia compared to ERA5. This implies the models simulate a weaker increase in outgoing longwave radiation (OLR)—or a decrease—relative to the reanalysis.
- Southern Ocean model divergence: There is a stark contrast in the Southern Hemisphere high latitudes. IFS-FESOM and IFS-NEMO show strong positive biases (red) in the Weddell Sea sector, whereas ICON shows a strong negative bias (blue) in the Amundsen/Bellingshausen Sea regions. This indicates fundamentally different surface temperature or sea ice cover trends in the simulations.
- North Atlantic trend discrepancy: ERA5 displays a strong negative trend (blue, increasing OLR) over the North Atlantic, likely associated with surface variability. The models generally fail to capture the magnitude of this feature, resulting in a positive bias across the region.
Spatial Patterns
ERA5 shows negative trends (blue, increasing outgoing radiation if sign convention is positive-down) over the North Atlantic and parts of Eurasia, and mixed positive/negative trends in the Southern Ocean. The models tend to be redder (positive bias) globally, especially over land masses in the Northern Hemisphere.
Model Agreement
IFS-FESOM and IFS-NEMO show strong agreement in their bias patterns, particularly the positive biases in the Northern Hemisphere and the Weddell Sea. ICON diverges significantly in the Southern Ocean, showing a negative bias where IFS models show positive biases, likely reflecting differences in sea ice sensitivity or ocean circulation responses.
Physical Interpretation
Clear-sky TOA net longwave trends are primarily driven by changes in surface temperature (Planck feedback) and column water vapor (greenhouse effect). A positive bias (Model > Obs) in Net LW (defined usually as positive down) implies the models have less outgoing radiation increase than observations. This suggests that in the Northern High Latitudes, the models may be moistening faster (trapping more heat) or warming less at the surface than ERA5. The Southern Ocean discrepancies likely stem from differing trends in sea ice concentration; sea ice loss leads to drastic surface warming and increased OLR (negative trend bias), while ice retention or expansion leads to the opposite.
Caveats
- The 1990–2014 period is relatively short for trend analysis and is heavily influenced by internal climate variability (e.g., ENSO, PDO) rather than just forced signals.
- ERA5 trends in high latitudes can be uncertain due to changes in data assimilation sources over the satellite era.
TOA Net Shortwave Radiation Annual Linear Trend
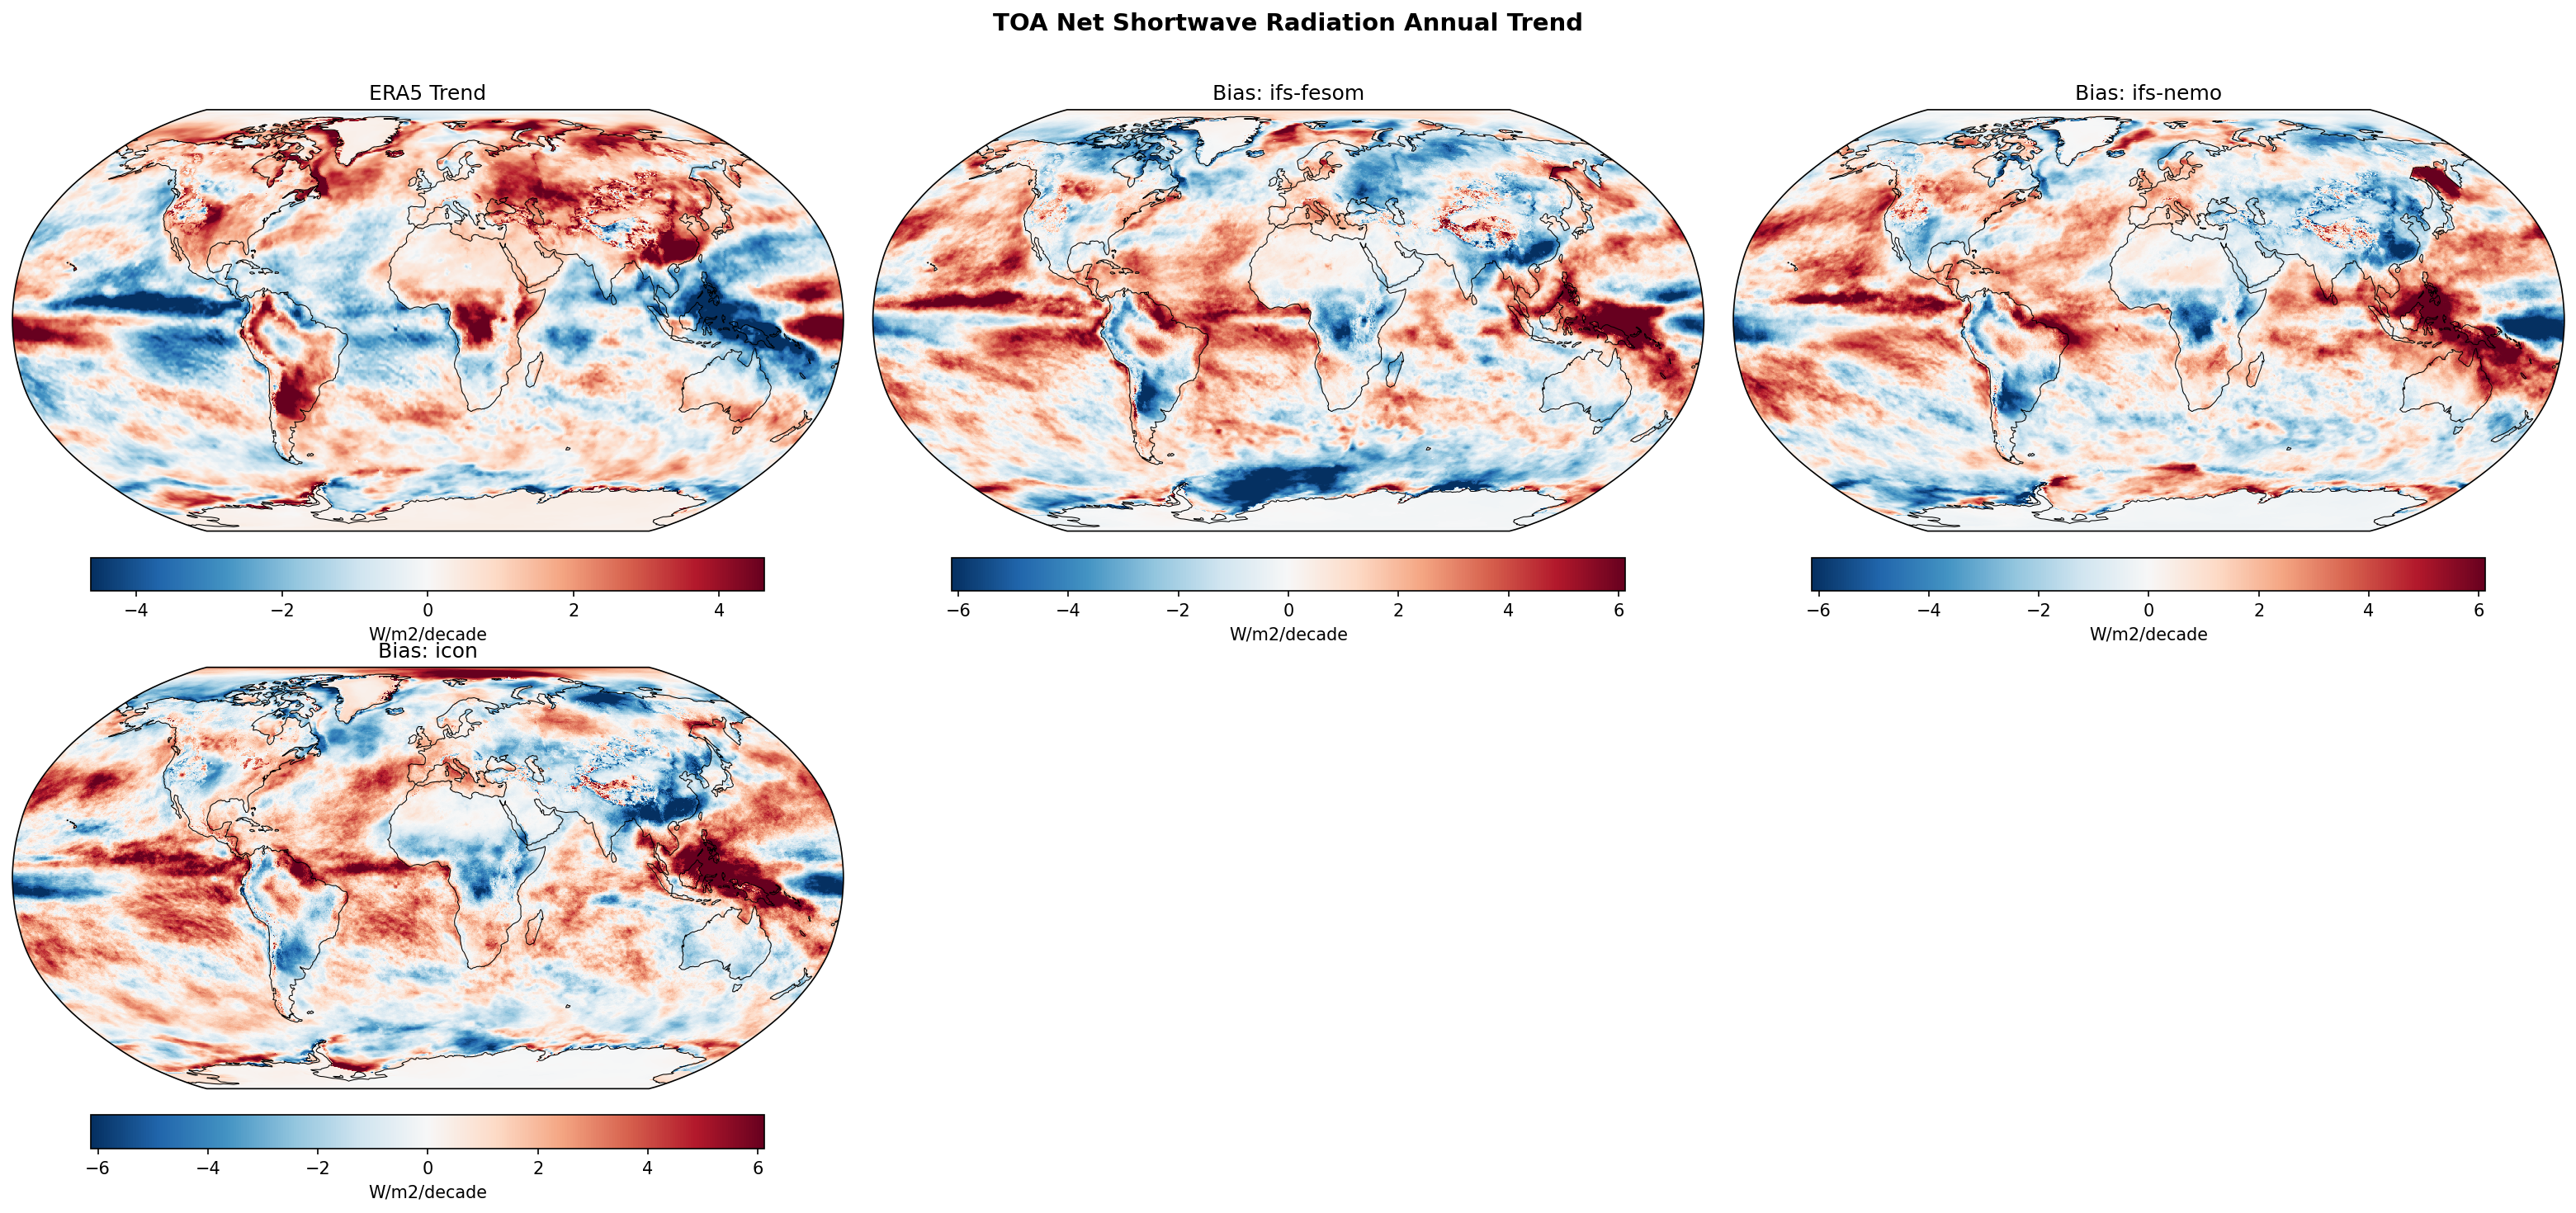
| Variables | avg_tnswrf |
|---|---|
| Models | ifs-fesom, ifs-nemo, icon |
| Reference Dataset | ERA5 |
| Units | W/m2/decade |
| Period | 1990–2014 |
| ifs-fesom | Global Mean Trend: 0.63 · Global Mean Trend Diff: 0.47 · Trend Rmse: 2.43 |
| ifs-nemo | Global Mean Trend: 0.68 · Global Mean Trend Diff: 0.52 · Trend Rmse: 2.32 |
| icon | Global Mean Trend: 0.72 · Global Mean Trend Diff: 0.57 · Trend Rmse: 2.36 |
Summary high
Models consistently overestimate the global increasing trend in TOA Net Shortwave Radiation (SW) compared to ERA5 (1990-2014), driven largely by discrepancies in the Tropical Pacific and Southern Ocean.
Key Findings
- Models exhibit a substantial positive global trend bias (+0.47 to +0.57 W/m²/decade) relative to ERA5 (~0.16 W/m²/decade), implying simulated Earth is darkening/absorbing SW much faster than observed.
- A prominent dipole bias exists in the Tropical Pacific: models show a strong positive bias (red) in the Central/Eastern Pacific and negative bias (blue) in the Maritime Continent, indicating a failure to capture observed circulation/cloud trends.
- All models display a strong negative trend bias over the Tibetan Plateau/Himalayas, contrasting with the positive/neutral trend in ERA5.
- ERA5 shows significant 'brightening' (increased Net SW) over Europe and the North Atlantic which models underestimate (blue bias in those regions).
Spatial Patterns
ERA5 shows a complex trend pattern with increased SW absorption (red) over the Arctic, Europe, and North Pacific, and decreased absorption (blue) in the Eastern Equatorial Pacific. The models, however, show widespread positive trend biases (red) over most tropical oceans and land masses. The 'Pacific Bias' pattern is zonal: models are too absorptive in the East/Central Pacific and too reflective in the West relative to ERA5 trends. High-latitude biases are mixed, but the Arctic generally shows reasonable agreement or slight underestimation of the warming trend.
Model Agreement
Inter-model agreement is high regarding the spatial structure of biases. Both IFS variants (FESOM and NEMO) and ICON share the Pacific dipole and Himalayan biases. ICON exhibits the strongest global mean trend (0.72 W/m²/decade) and the most intense negative bias over the Himalayas, while IFS-FESOM has the lowest RMSE (2.43 W/m²/decade) and smallest global bias.
Physical Interpretation
The bias pattern in the Tropical Pacific is consistent with the 'pattern effect' problem: models typically fail to reproduce the observed historical strengthening of the Pacific Walker circulation (La Niña-like cooling in the East), instead simulating more uniform warming or El Niño-like trends. The observed Eastern Pacific cooling enhances marine stratocumulus (more reflection, negative Net SW trend), which models miss, leading to the strong positive SW bias there. The negative bias over the Himalayas suggests models may be retaining snow cover or increasing cloudiness in that region contrary to the observational trend of snow loss or aerosol reduction.
Caveats
- Trends are calculated over a relatively short period (1990-2014), making them sensitive to decadal variability (e.g., PDO/IPO phases).
- ERA5 TOA fluxes are reanalysis products and may contain artifacts from satellite observing system changes, though they are generally consistent with CERES in the later period.
TOA Net Shortwave Radiation DJF Linear Trend
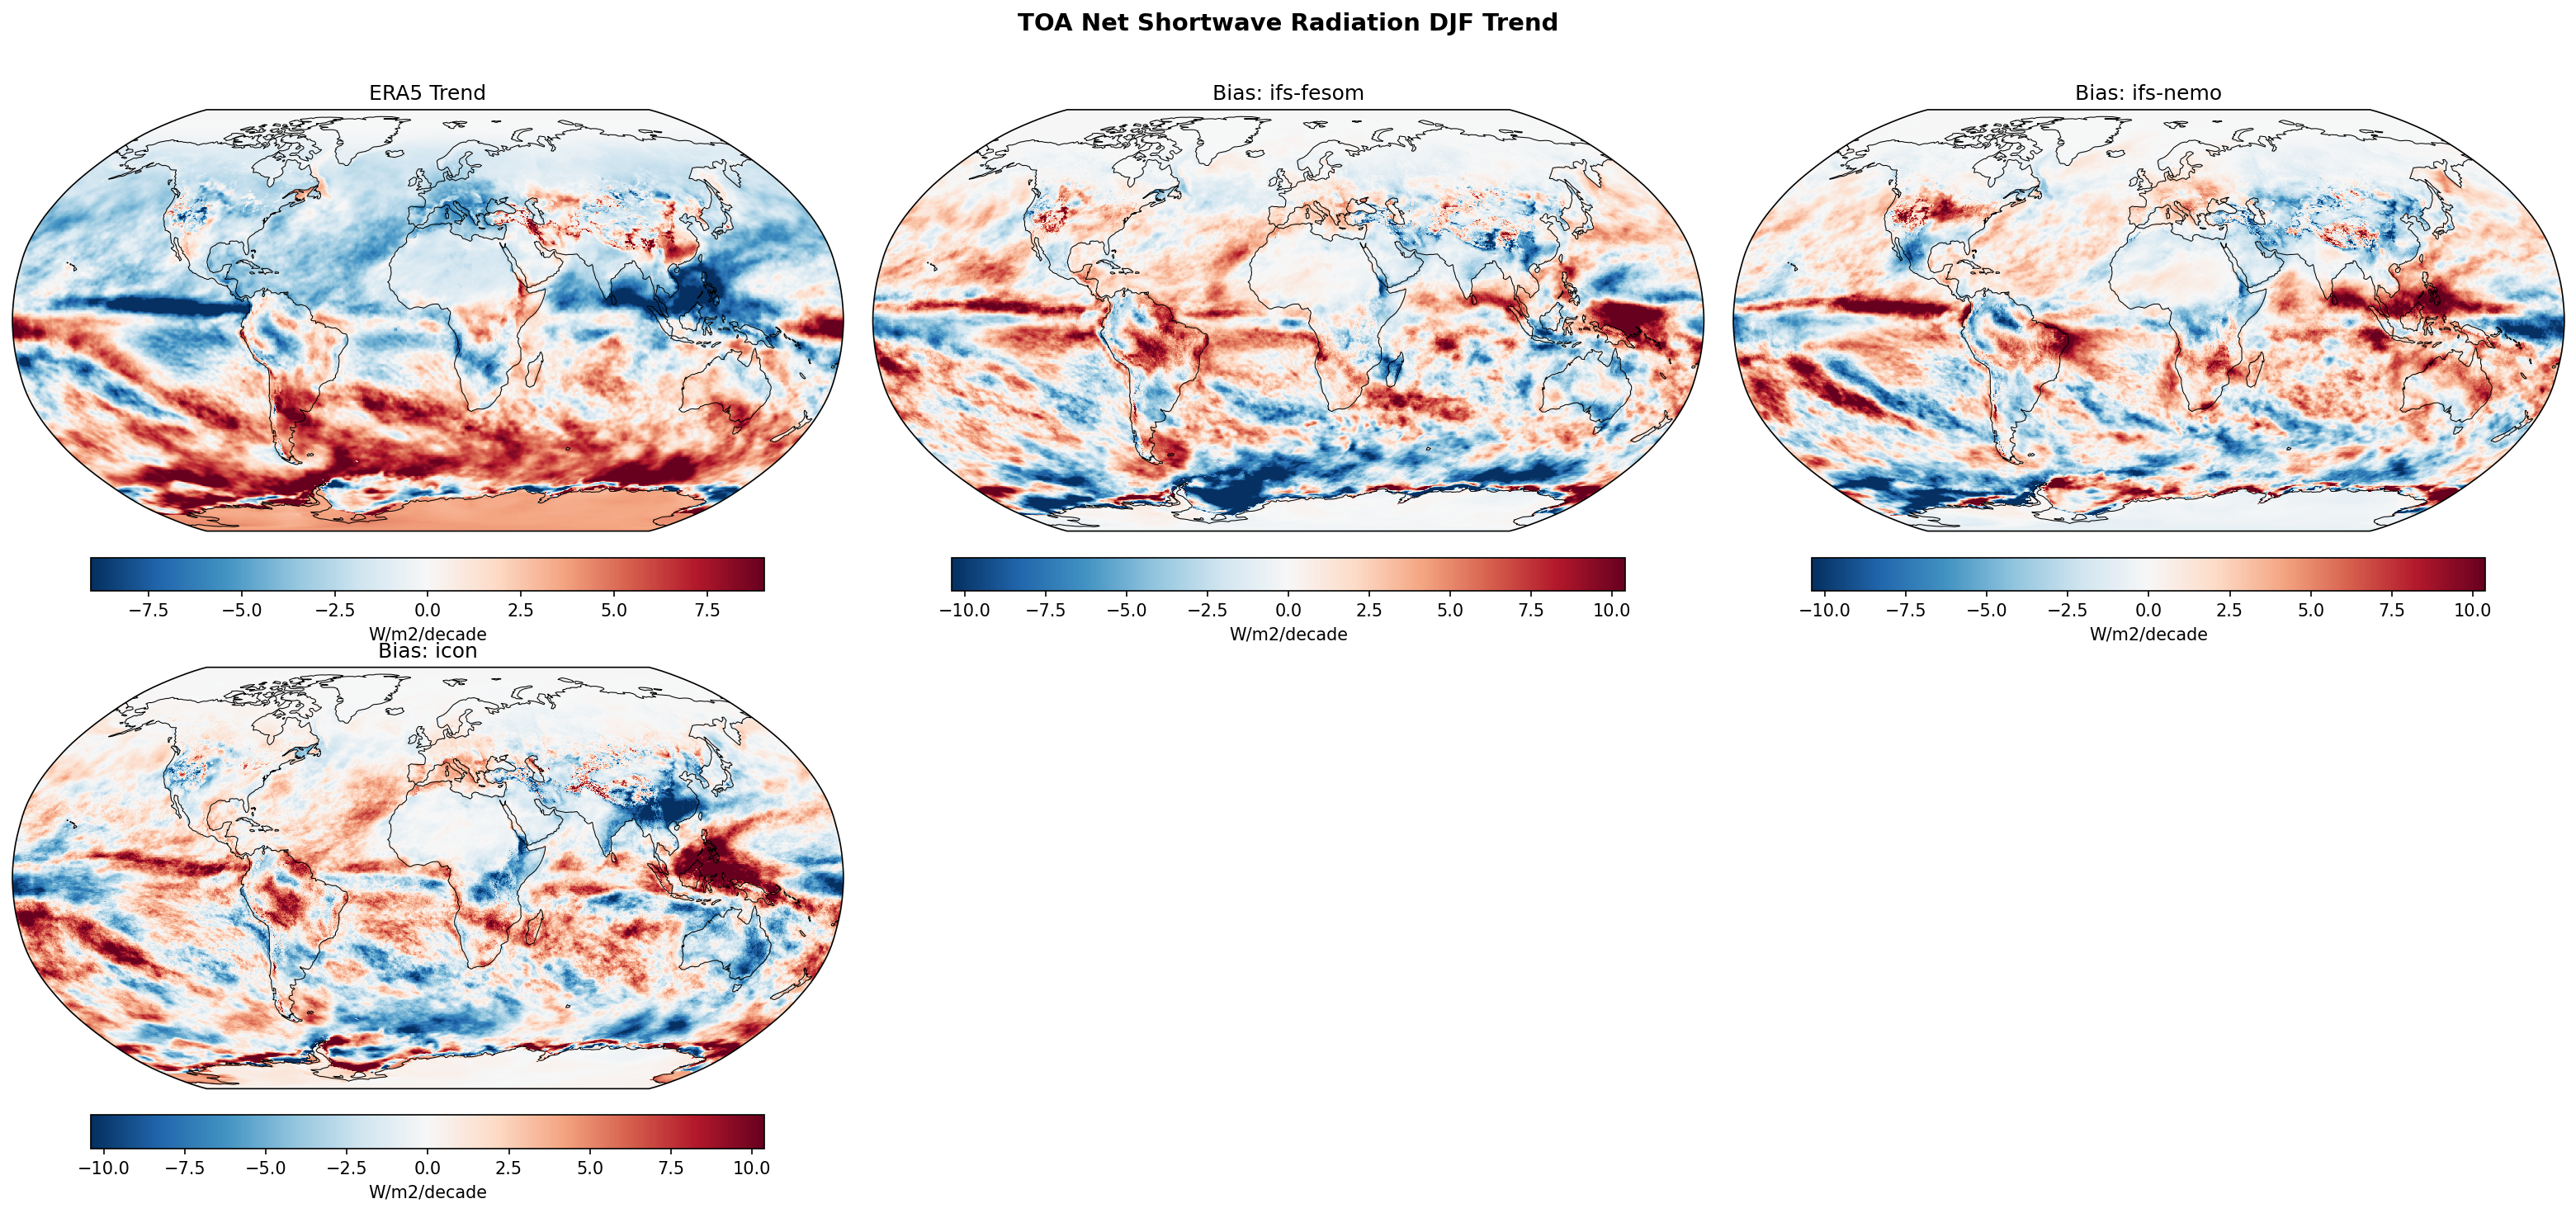
| Variables | avg_tnswrf |
|---|---|
| Models | ifs-fesom, ifs-nemo, icon |
| Reference Dataset | ERA5 |
| Units | W/m2/decade |
| Period | 1990–2014 |
Summary medium
This diagnostic compares the 1990–2014 DJF linear trend in TOA Net Shortwave Radiation from ERA5 reanalysis against three high-resolution coupled models (IFS-FESOM, IFS-NEMO, ICON). The models generally fail to capture the magnitude of observed trends, particularly the strong increased absorption in the Southern Ocean and increased reflection over the Maritime Continent.
Key Findings
- ERA5 shows a strong positive trend (increased energy absorption) around the Antarctic coast, likely linked to sea ice loss, which all three models fail to reproduce, resulting in prominent negative trend biases (blue) in the Southern Ocean.
- In the Maritime Continent and Western Pacific, ERA5 displays a negative trend (increased reflection/cloudiness), whereas models exhibit positive biases (red), indicating they underestimate the intensification of convection/cloudiness in this region.
- IFS-FESOM and IFS-NEMO exhibit nearly identical bias patterns, confirming that the atmospheric model formulation (IFS) dominates the radiative trend errors regardless of the ocean coupling.
- ICON displays a distinct strong negative bias over the Himalayas and a stronger positive bias in the Indo-Pacific compared to the IFS variants.
Spatial Patterns
ERA5 is characterized by a dipole trend in the tropical Pacific (negative in the West, weak/positive in the East) and strong positive trends along the Antarctic sea ice margin. The models systematically oppose these signals: they show negative biases in the Southern Ocean (underestimating warming) and positive biases in the tropical convergence zones (underestimating cloud-driven cooling/reflection).
Model Agreement
There is exceptionally high agreement between IFS-FESOM and IFS-NEMO, indicating the trend biases are atmospherically driven. ICON shares the broad zonal biases (Southern Ocean mismatch) but differs regionally, particularly over continental Asia and the Indian Ocean.
Physical Interpretation
The negative bias in the Southern Ocean implies the models do not capture the observed decrease in surface albedo (sea ice loss) or produce compensating cloud trends. In the tropics, the positive bias suggests the models fail to capture the observed strengthening of the Walker circulation or associated increase in convective cloud cover over the Maritime Continent (the 'dimming' trend seen in ERA5).
Caveats
- The 25-year analysis period (1990-2014) is relatively short for robust trend detection and is influenced by decadal variability (e.g., ENSO phases).
- ERA5 is used as the ground truth; biases in the reanalysis cloud assimilation could influence the calculated 'observed' trends.
TOA Net Shortwave Radiation JJA Linear Trend
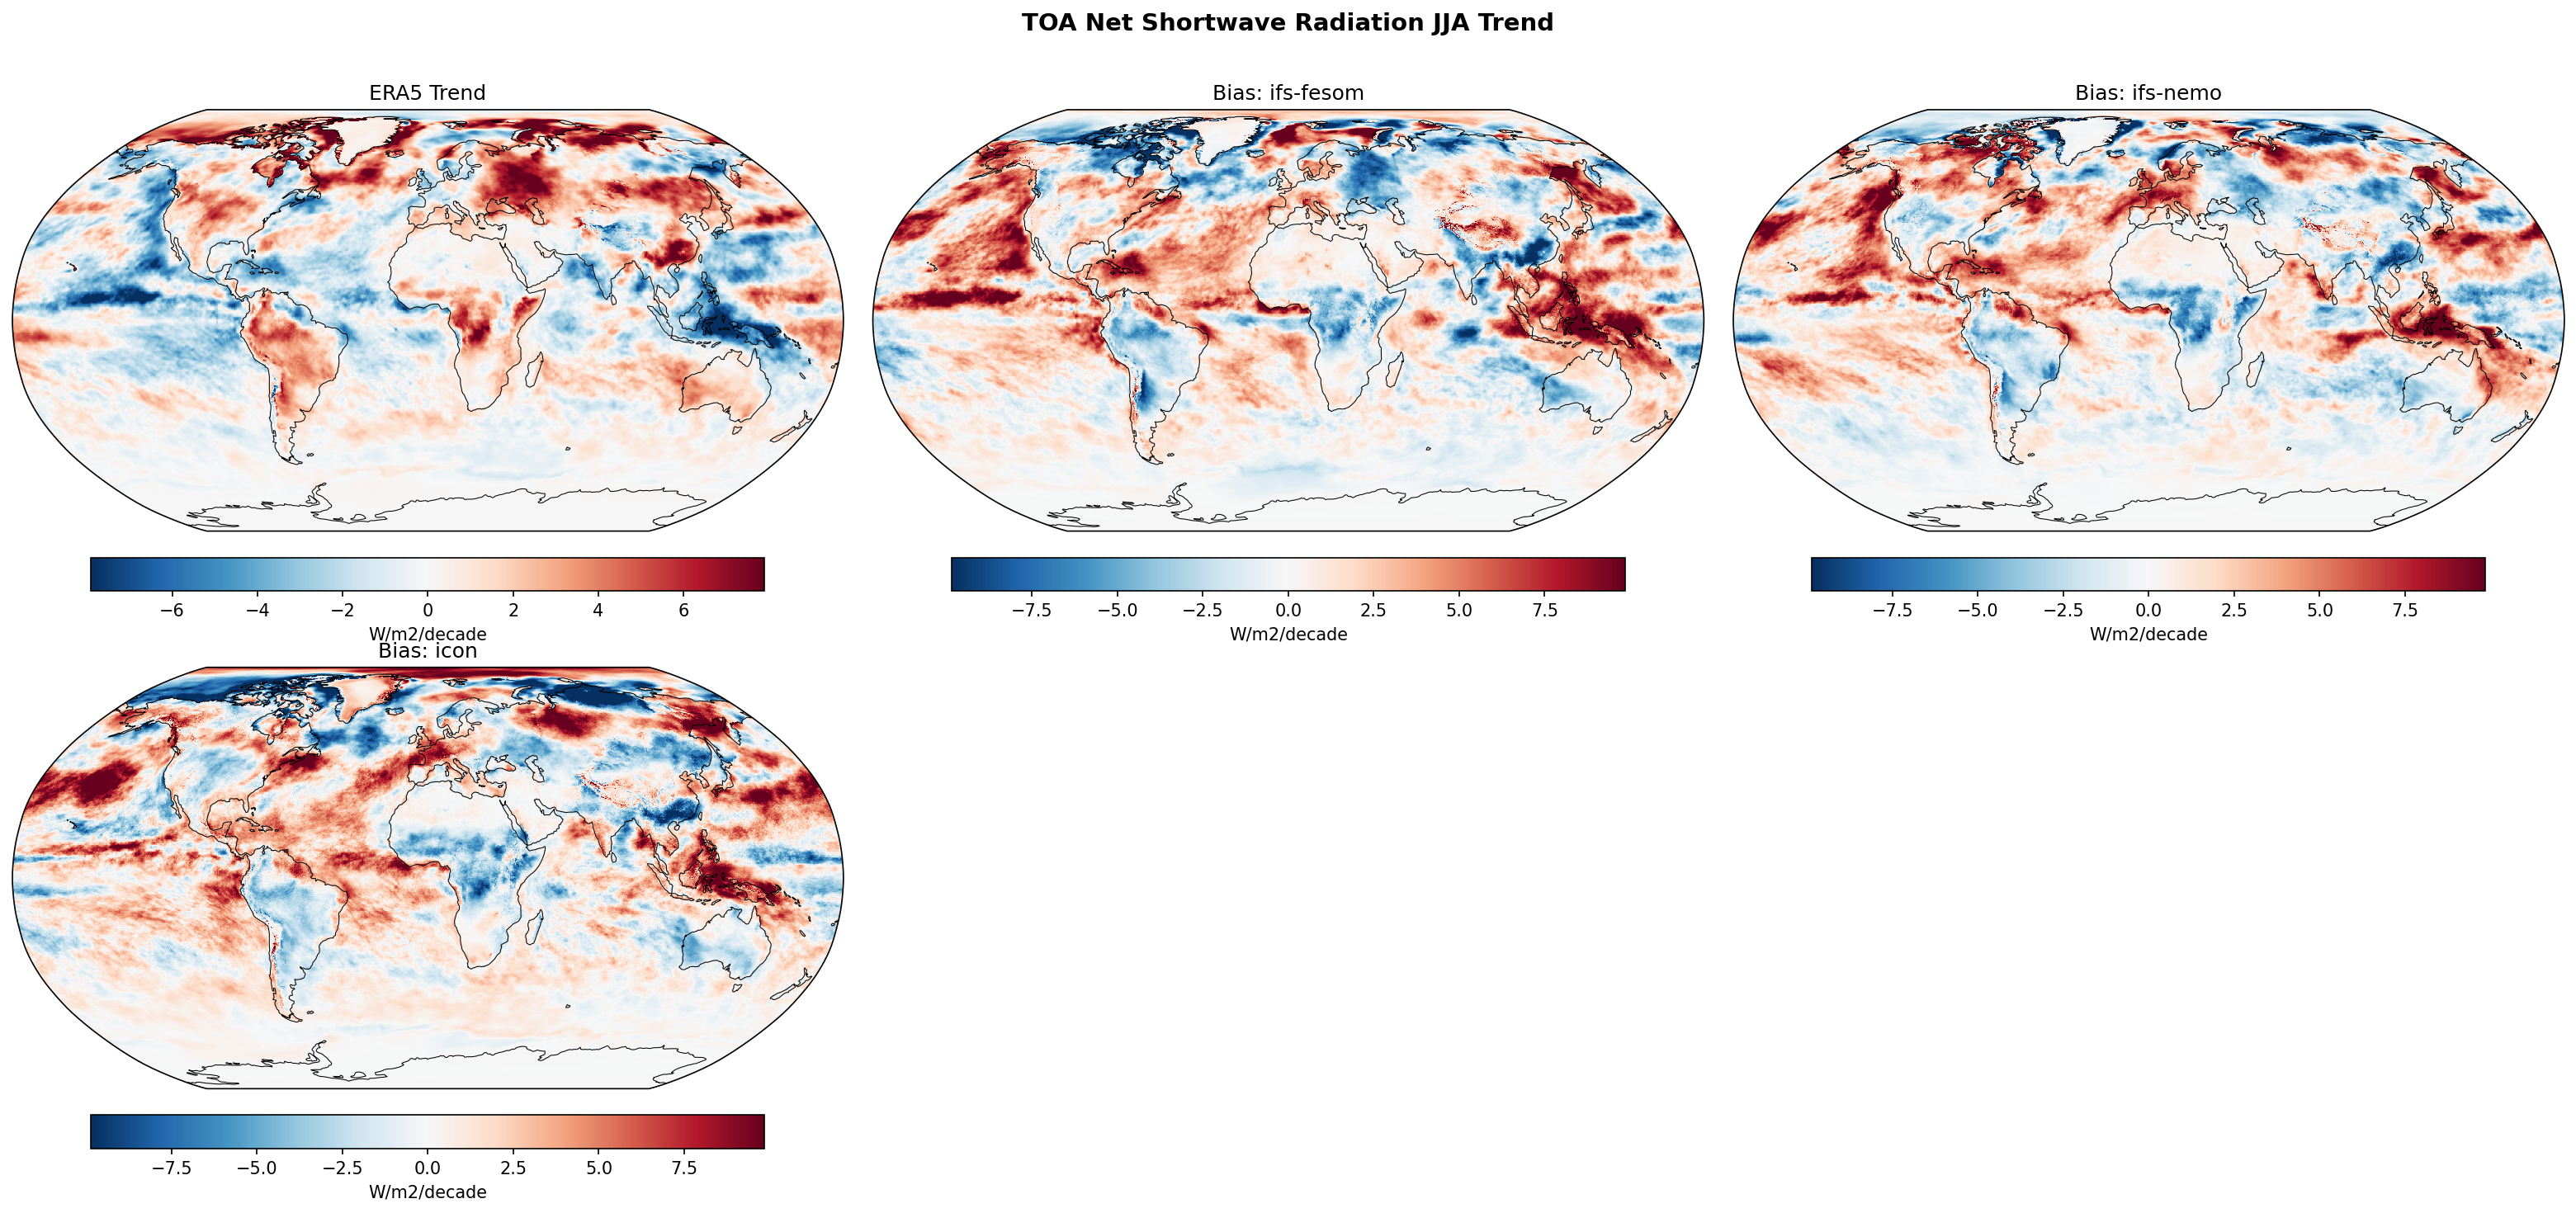
| Variables | avg_tnswrf |
|---|---|
| Models | ifs-fesom, ifs-nemo, icon |
| Reference Dataset | ERA5 |
| Units | W/m2/decade |
| Period | 1990–2014 |
Summary high
This diagnostic evaluates June-July-August (JJA) linear trends in TOA Net Shortwave Radiation from 1990–2014, comparing ERA5 reanalysis with three high-resolution coupled models (IFS-FESOM, IFS-NEMO, ICON). While ERA5 shows significant brightening in the North Atlantic and Arctic, the models exhibit distinct biases: IFS variants overestimate this brightening in the Atlantic and tropics, whereas ICON underestimates high-latitude trends.
Key Findings
- ERA5 shows a strong positive trend (brightening) in the North Atlantic and Arctic, consistent with sea ice loss and reduced cloud cover, and negative trends (dimming) in the tropical ITCZ regions.
- Both IFS-based models (FESOM and NEMO) display highly correlated bias patterns, significantly overestimating the positive shortwave trend (red bias) in the North Atlantic and the Maritime Continent relative to ERA5.
- ICON diverges sharply from the IFS models in the Northern Hemisphere high latitudes, showing a strong negative trend bias (blue) in the North Atlantic and Arctic, implying it fails to capture the observed extent of brightening or sea ice loss.
- All models exhibit a positive trend bias over the Maritime Continent and Western Pacific, suggesting they do not reproduce the observed magnitude of increasing cloudiness/convection in this region.
Spatial Patterns
The most prominent features are the dipole trends in ERA5 (red North Atlantic/Arctic vs. blue Tropics). The IFS models accentuate the 'red' features, showing positive biases in the North Atlantic (>5 W/m²/decade bias) and tropical West Pacific. ICON reverses the sign in the North Atlantic, showing negative biases (-5 to -7.5 W/m²/decade), effectively neutralizing the observed positive trend. In the Arctic, ERA5's positive trend is countered by ICON's negative bias, suggesting ICON predicts stable or increasing albedo where observations show a decrease.
Model Agreement
There is exceptionally high agreement between IFS-FESOM and IFS-NEMO, indicating that the atmospheric component (IFS) dominates the radiative trend errors regardless of the ocean coupling. ICON shows significant disagreement with the IFS/DestinE models, particularly in the extratropics, highlighting sensitivity to different atmospheric physics parameterizations or sea ice responses.
Physical Interpretation
Positive trends in TOA Net SW generally indicate reduced reflection (less cloud cover or lower surface albedo due to ice melt). The IFS models' positive bias in the tropics suggests a 'drying' trend or failure to sustain increasing convective cloudiness compared to ERA5. In the Arctic/North Atlantic, the IFS positive bias implies excessive cloud clearing or aggressive sea ice loss. Conversely, ICON's negative bias in the Arctic JJA suggests it may be retaining too much sea ice or generating excessive cloud cover trends, dampening the solar absorption increase expected from global warming.
Caveats
- Trends are calculated over a relatively short period (1990–2014), making them sensitive to decadal internal variability (e.g., PDO, AMO) rather than purely forced climate change.
- The 'Bias' panels represent trend differences; a zero trend in the model vs a strong trend in observations appears as a strong bias, so interpretation depends heavily on the ERA5 baseline.
TOA Net Shortwave Radiation (Clear-Sky) Annual Linear Trend
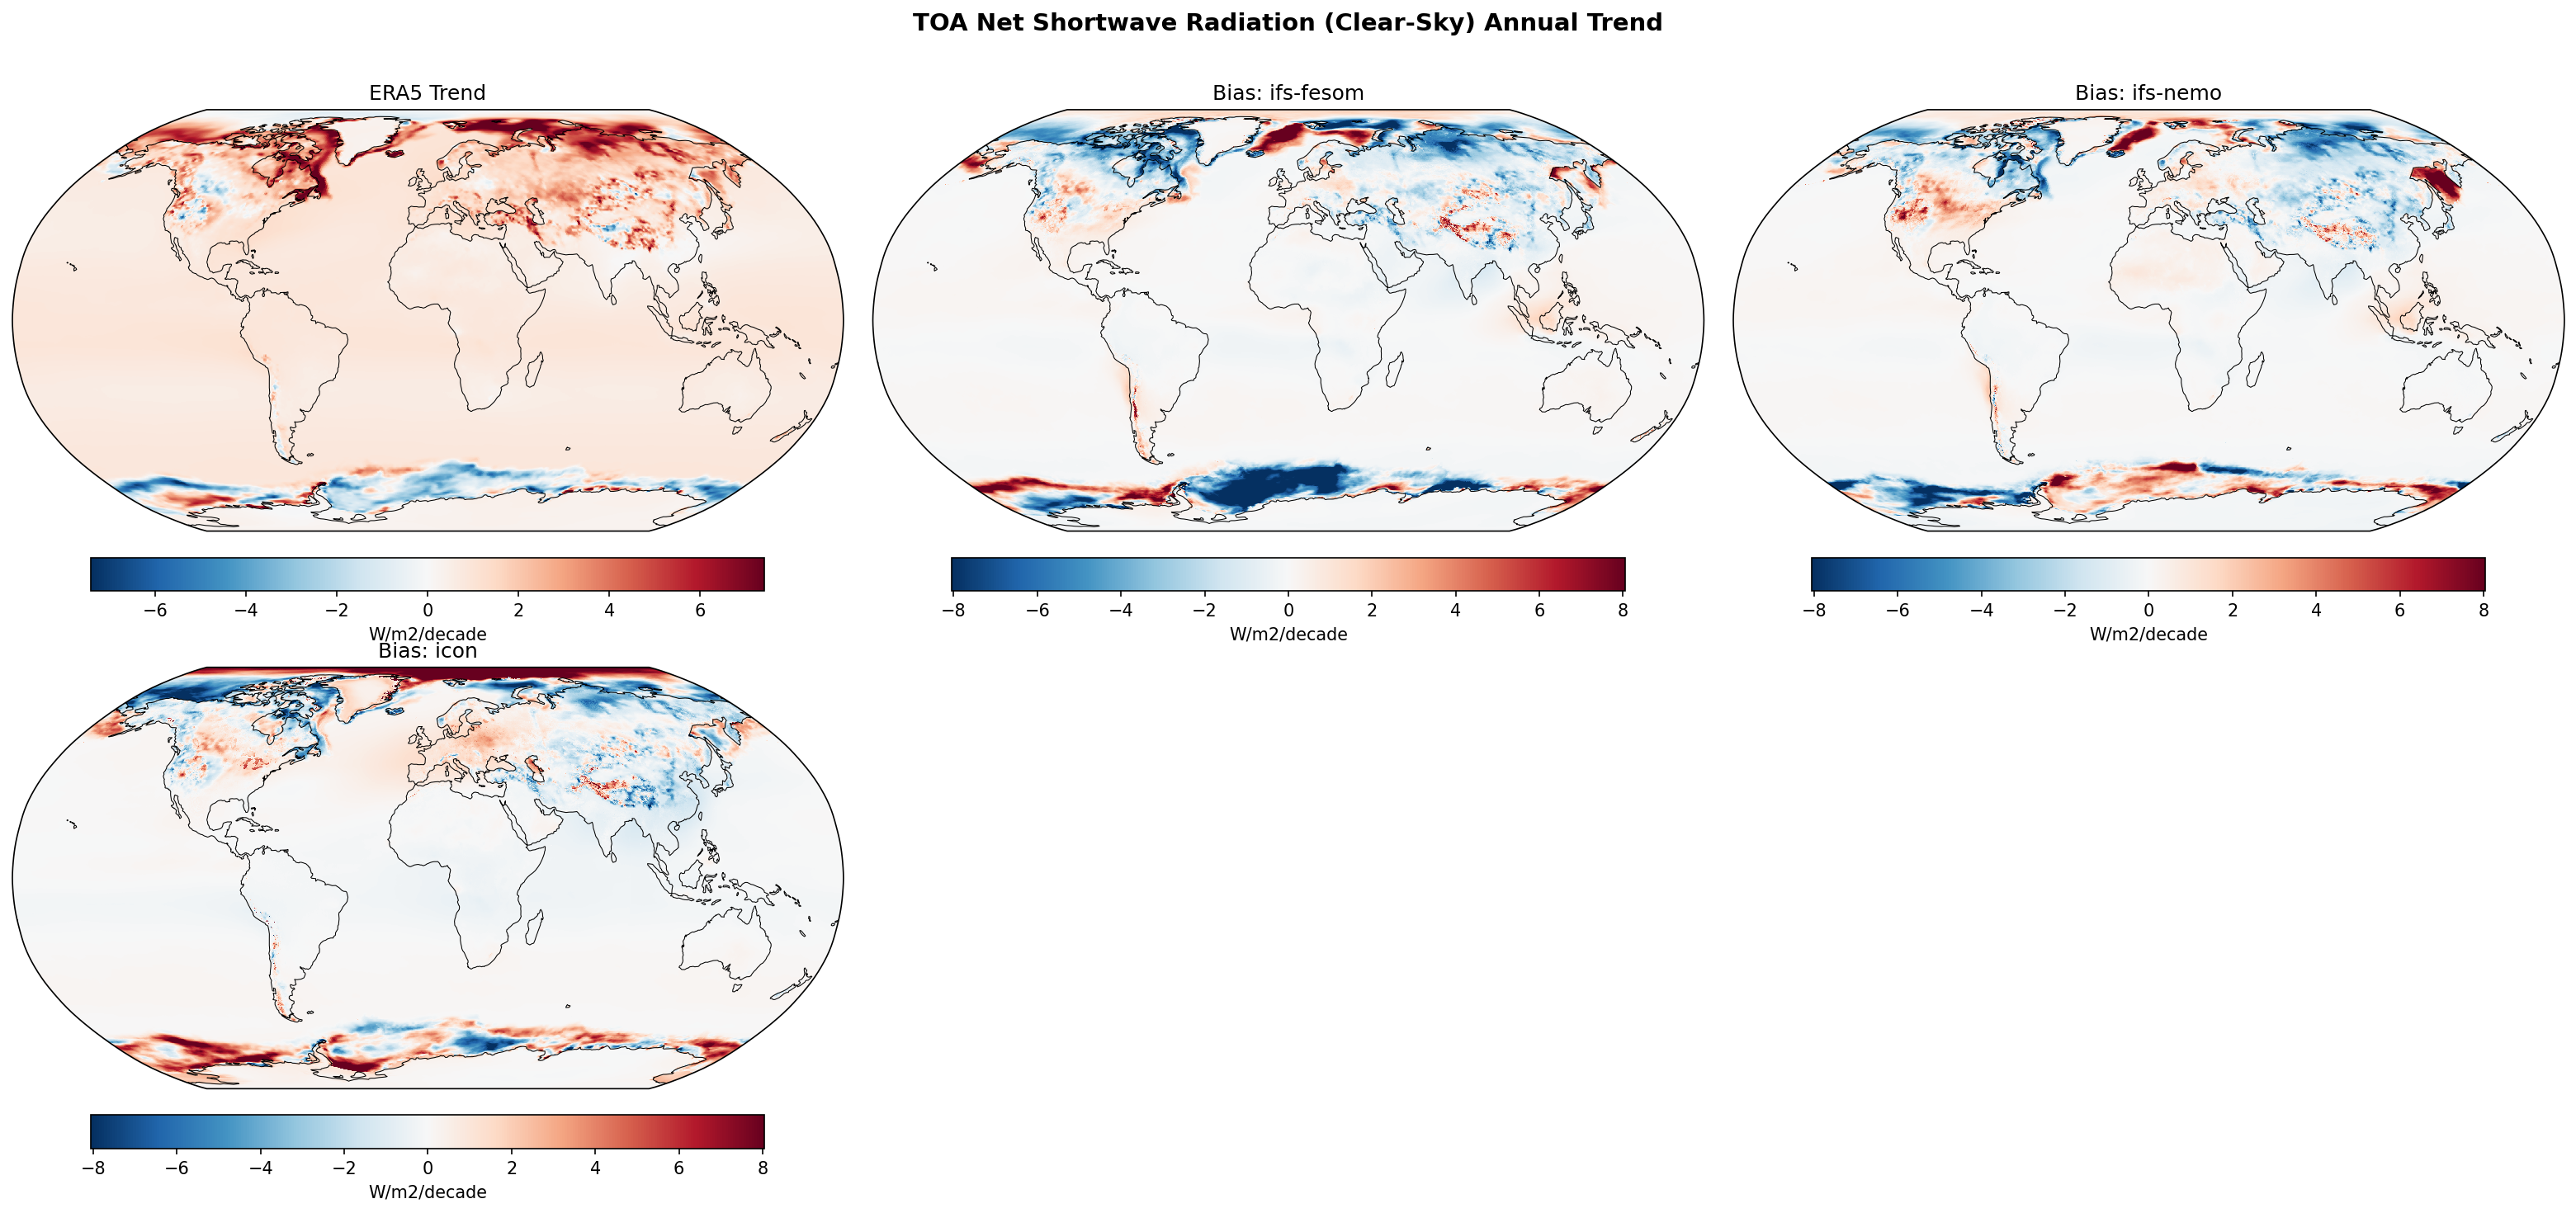
| Variables | avg_tnswrfcs |
|---|---|
| Models | ifs-fesom, ifs-nemo, icon |
| Reference Dataset | ERA5 |
| Units | W/m2/decade |
| Period | 1990–2014 |
| ifs-fesom | Global Mean Trend: 0.67 · Global Mean Trend Diff: -0.20 · Trend Rmse: 1.66 |
| ifs-nemo | Global Mean Trend: 0.80 · Global Mean Trend Diff: -0.06 · Trend Rmse: 1.34 |
| icon | Global Mean Trend: 0.86 · Global Mean Trend Diff: -0.00 · Trend Rmse: 1.45 |
Summary high
This diagnostic evaluates annual linear trends in clear-sky TOA net shortwave radiation (1990–2014), serving as a proxy for surface albedo changes. All models underestimate the magnitude of Arctic darkening (sea ice loss) observed in ERA5, while exhibiting large, spatially heterogeneous biases in the Southern Ocean.
Key Findings
- ERA5 shows strong positive trends (>6 W/m²/decade) in the Arctic, particularly in the Barents and Kara Seas, consistent with observed sea ice decline and albedo feedback.
- All three models exhibit negative trend biases (blue) in the Arctic, indicating they simulate a slower rate of sea ice loss and surface darkening than the reanalysis.
- Southern Hemisphere biases are dominated by large regional dipoles, with ICON showing the strongest compensating errors (large positive bias in the Pacific sector, negative in the Atlantic sector) despite having the lowest global mean trend bias.
Spatial Patterns
The dominant signal is polar. ERA5 displays widespread warming trends (increased absorption) over the Arctic Ocean and northern landmasses. Model biases are characterized by negative values (underestimated warming trend) in the Arctic marginal ice zones. In the Southern Ocean, biases are zonally asymmetric, reflecting disagreements in the location and sign of regional sea ice trends.
Model Agreement
Models consistently underestimate the Arctic amplification signal in clear-sky SW. Inter-model spread is largest in the Southern Ocean, where IFS-FESOM, IFS-NEMO, and ICON show distinct bias patterns likely tied to their respective ocean/sea-ice component behaviors. ICON achieves the best global mean agreement (diff: -0.003 W/m²/decade) but through error compensation.
Physical Interpretation
Clear-sky net shortwave trends primarily track surface albedo changes (snow/ice cover) and secondarily aerosol loading. The systematic underestimation of Arctic trends suggests that these free-running coupled models generate a slower decline in sea ice extent than occurred in reality (as captured by ERA5 assimilation). Southern Ocean patterns reflect the difficulty coupled models have in reproducing the complex, regionally variable observed trends in Antarctic sea ice during this period.
Caveats
- Trends are calculated over a relatively short period (25 years), where internal variability strongly influences regional patterns, especially in the Antarctic.
- Differences in clear-sky definitions between models and ERA5 could contribute to minor biases, though the cryospheric signal dominates.
TOA Net Shortwave Radiation (Clear-Sky) DJF Linear Trend
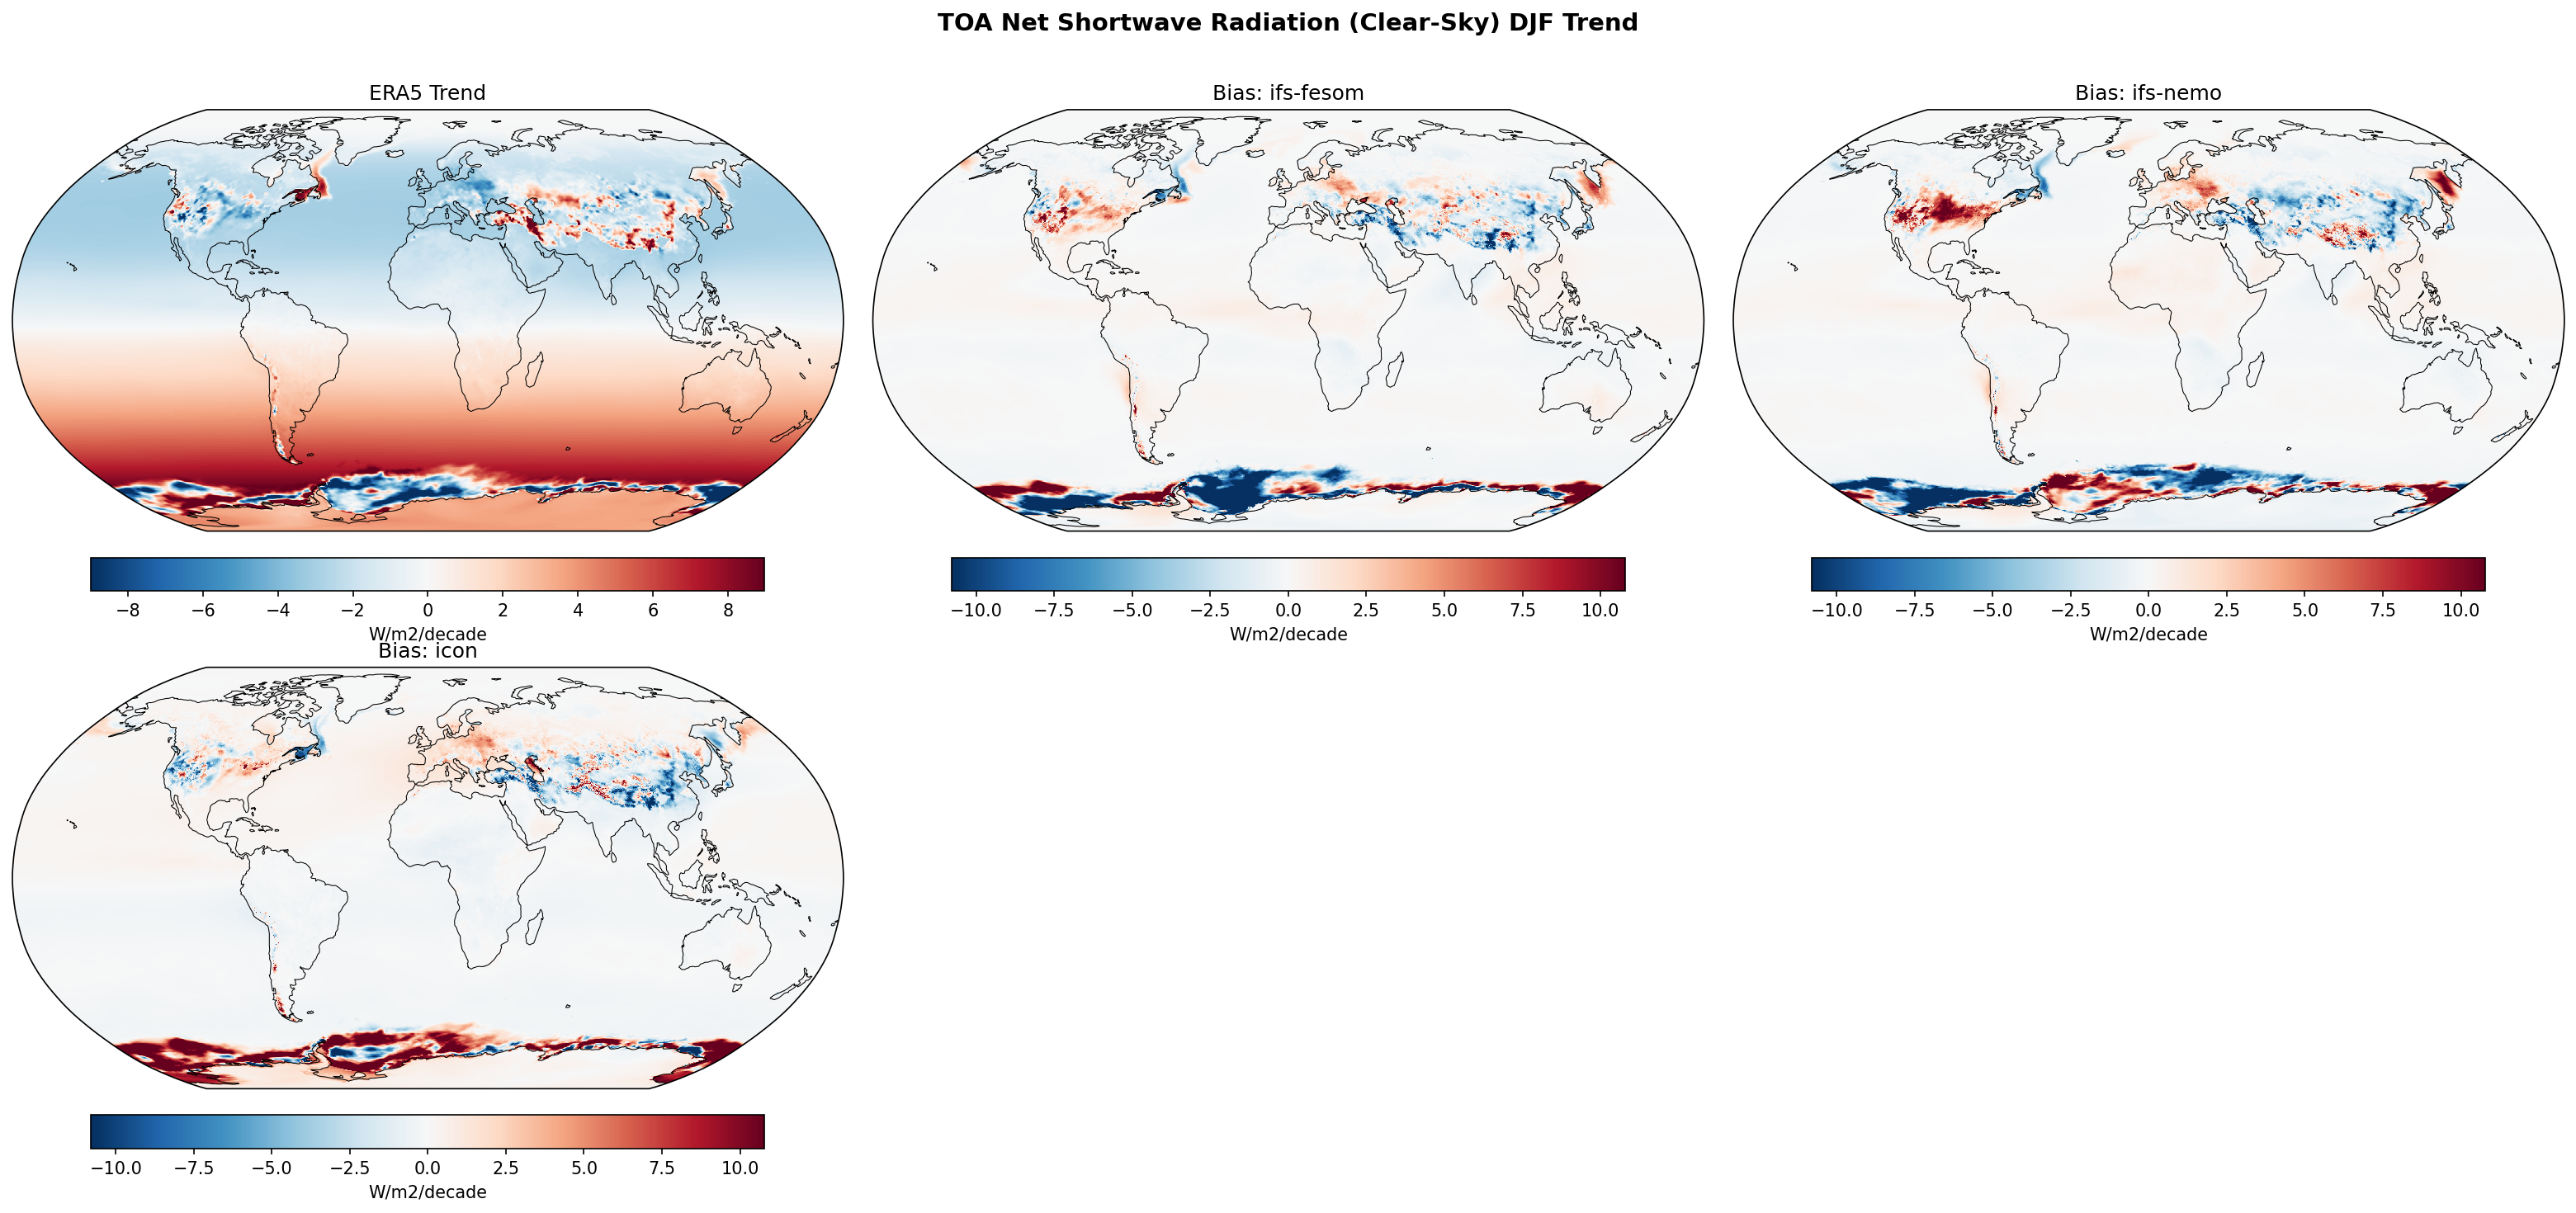
| Variables | avg_tnswrfcs |
|---|---|
| Models | ifs-fesom, ifs-nemo, icon |
| Reference Dataset | ERA5 |
| Units | W/m2/decade |
| Period | 1990–2014 |
Summary high
This diagnostic evaluates linear trends (1990–2014) in DJF Clear-Sky TOA Net Shortwave Radiation, serving as a proxy for surface albedo changes driven by Northern Hemisphere snow cover and Southern Hemisphere sea ice evolution.
Key Findings
- ERA5 exhibits strong positive trends (surface darkening/warming) along the Antarctic coast and mixed trends over Northern Hemisphere land, reflecting 25-year variability in cryospheric albedo.
- IFS-based models (IFS-FESOM, IFS-NEMO) display coherent positive trend biases over North America, implying they simulate a stronger reduction in snow albedo (or failure to capture increasing snow cover) compared to ERA5.
- In the Antarctic sea ice zone, IFS models show a widespread negative trend bias, indicating they underestimate the rate of albedo reduction (sea ice loss) observed in ERA5.
- ICON presents a divergent bias pattern around Antarctica compared to IFS, with localized positive biases suggesting regions of excessive albedo reduction (accelerated sea ice loss) relative to observations.
Spatial Patterns
The dominant signals are confined to the cryosphere: the snow-covered continents of the Northern Hemisphere (North America, Eurasia) and the sea-ice zones of the Southern Ocean. Tropical and subtropical regions show negligible trend differences, confirming that clear-sky SW trend biases are dominated by surface albedo rather than atmospheric composition (aerosols/water vapor) in this context.
Model Agreement
There is exceptionally high agreement between IFS-FESOM and IFS-NEMO, indicating that the atmospheric model formulation (IFS) or common sea-ice coupling physics dominates the trend bias over the choice of ocean model (FESOM vs NEMO). ICON diverges significantly in the Southern Hemisphere, showing distinct regional biases in sea ice trends.
Physical Interpretation
Changes in Clear-Sky Net SW are primarily driven by the surface albedo feedback. The positive trend biases over North America in IFS models suggest a 'darkening' trend, likely due to underestimated snow cover persistence or depth trends during winter. Conversely, the negative biases around Antarctica in IFS suggest a 'brightening' relative to ERA5, meaning the models are retaining more sea ice (or losing it slower) than the reanalysis. ICON's mixed/positive biases in the Antarctic suggest a more aggressive sea ice retreat or lower concentration trend in specific sectors.
Caveats
- Trends over a 25-year period are heavily influenced by internal climate variability (e.g., ENSO, SAM); model-observation differences may reflect phase mismatches in multidecadal variability rather than purely systematic physics errors.
- Clear-sky diagnostics depend on the cloud-clearing algorithms used in the model versus ERA5, which can introduce artifacts in regions with high cloud cover.
TOA Net Shortwave Radiation (Clear-Sky) JJA Linear Trend
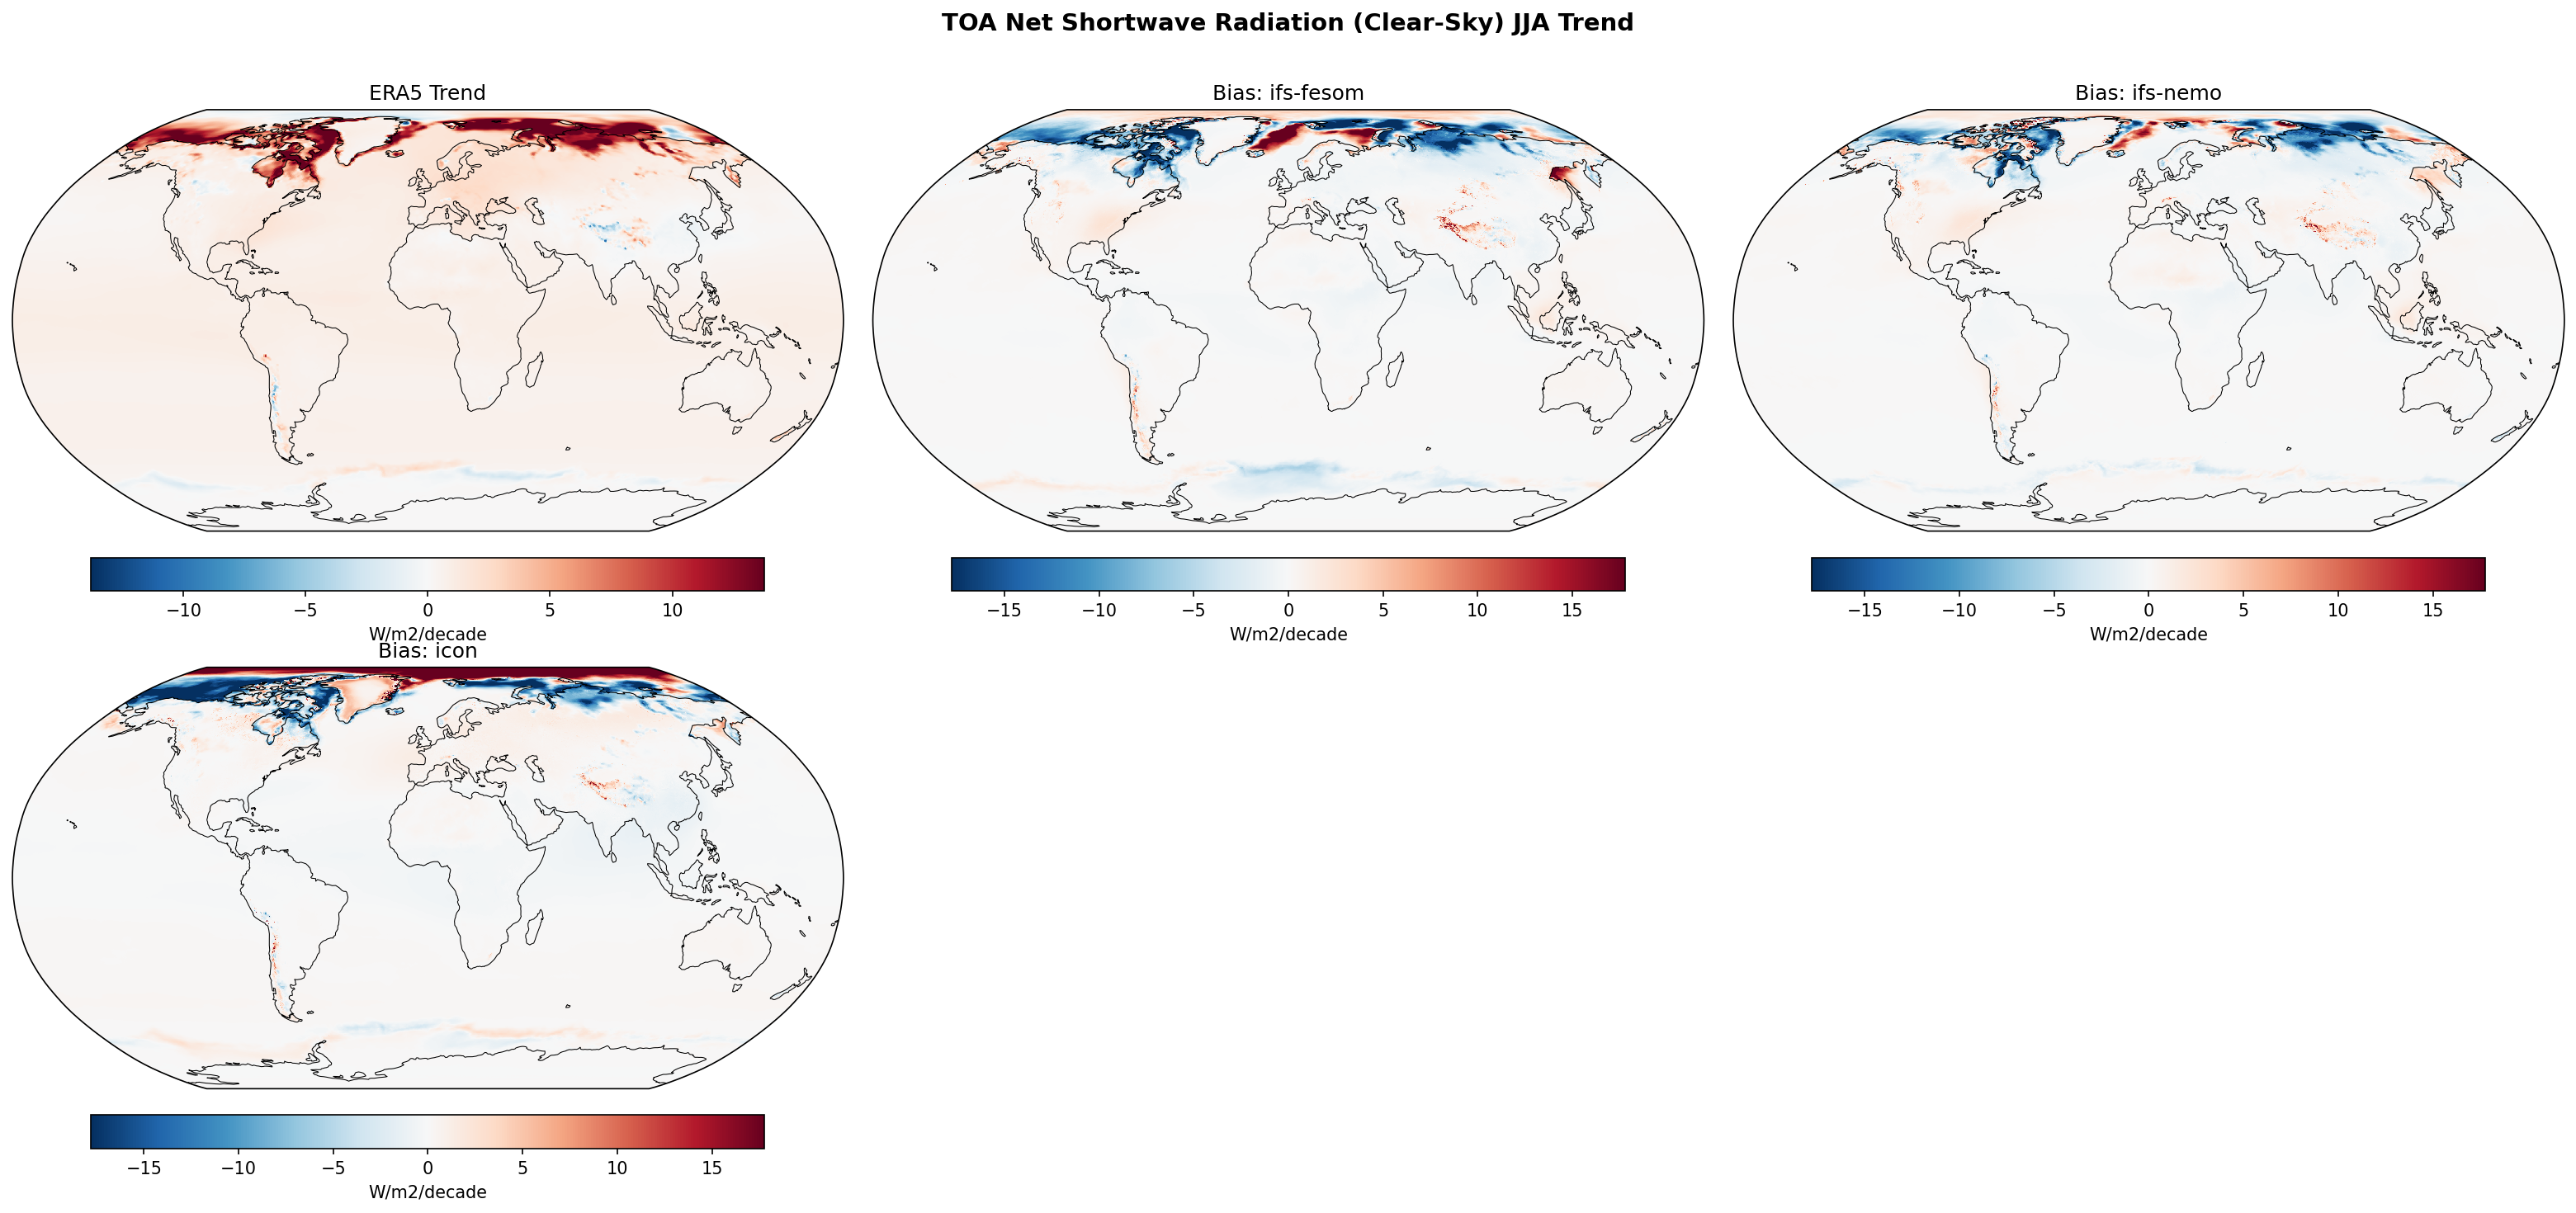
| Variables | avg_tnswrfcs |
|---|---|
| Models | ifs-fesom, ifs-nemo, icon |
| Reference Dataset | ERA5 |
| Units | W/m2/decade |
| Period | 1990–2014 |
Summary high
This diagnostic shows linear trends (1990-2014) in JJA Clear-Sky TOA Net Shortwave Radiation. ERA5 reveals a strong positive trend in the Arctic indicative of sea ice loss, while all three models exhibit substantial negative biases in this region, implying an underestimation of the darkening surface trend.
Key Findings
- ERA5 displays a powerful positive trend (>10 W/m²/decade) in clear-sky shortwave absorption over the Arctic Ocean, driven by declining sea ice albedo during JJA.
- IFS-FESOM, IFS-NEMO, and ICON all show strong negative trend biases (deep blue) in the Arctic, indicating they significantly underestimate the magnitude of the observed absorption increase.
- Outside the polar regions, trend biases are generally small (<2 W/m²/decade) and lack coherent large-scale structures, suggesting reasonable agreement on non-cryospheric clear-sky drivers.
- Localized positive biases appear over some high-latitude land areas (e.g., Canadian Archipelago, Siberia), possibly hinting at excessive snow melt or albedo reduction over land compared to ERA5.
Spatial Patterns
The dominant feature is the stark contrast in the Arctic: ERA5 shows widespread intense warming trends (red) along the Siberian and North American Arctic coasts, while the model bias maps are mirror images (blue), essentially canceling out the trend. This indicates the models have near-zero or much weaker positive trends in these specific sea-ice melt regions compared to the reanalysis.
Model Agreement
There is high inter-model agreement. All three models (IFS-FESOM, IFS-NEMO, ICON) exhibit nearly identical bias patterns and magnitudes in the Arctic, suggesting a shared difficulty in reproducing the rate of sea ice retreat or the associated albedo feedback strength seen in ERA5 during this period.
Physical Interpretation
Clear-sky TOA Net Shortwave trends in the Arctic summer are primarily controlled by surface albedo changes. The strong positive trend in ERA5 reflects the 'albedo feedback': melting sea ice exposes darker ocean water, increasing solar absorption. The negative bias implies the models simulate a much slower decline in sea ice extent or a weaker albedo response than observed in the 1990-2014 reanalysis record.
Caveats
- The analysis relies on clear-sky fluxes; actual all-sky trends would also depend on cloud cover changes which might offset or amplify these clear-sky signals.
- ERA5 trends in the Arctic are based on reanalysis which assimilates data but is still a model product; however, the signal aligns with well-documented observational records of sea ice loss.
Total Precipitation Rate Annual Linear Trend
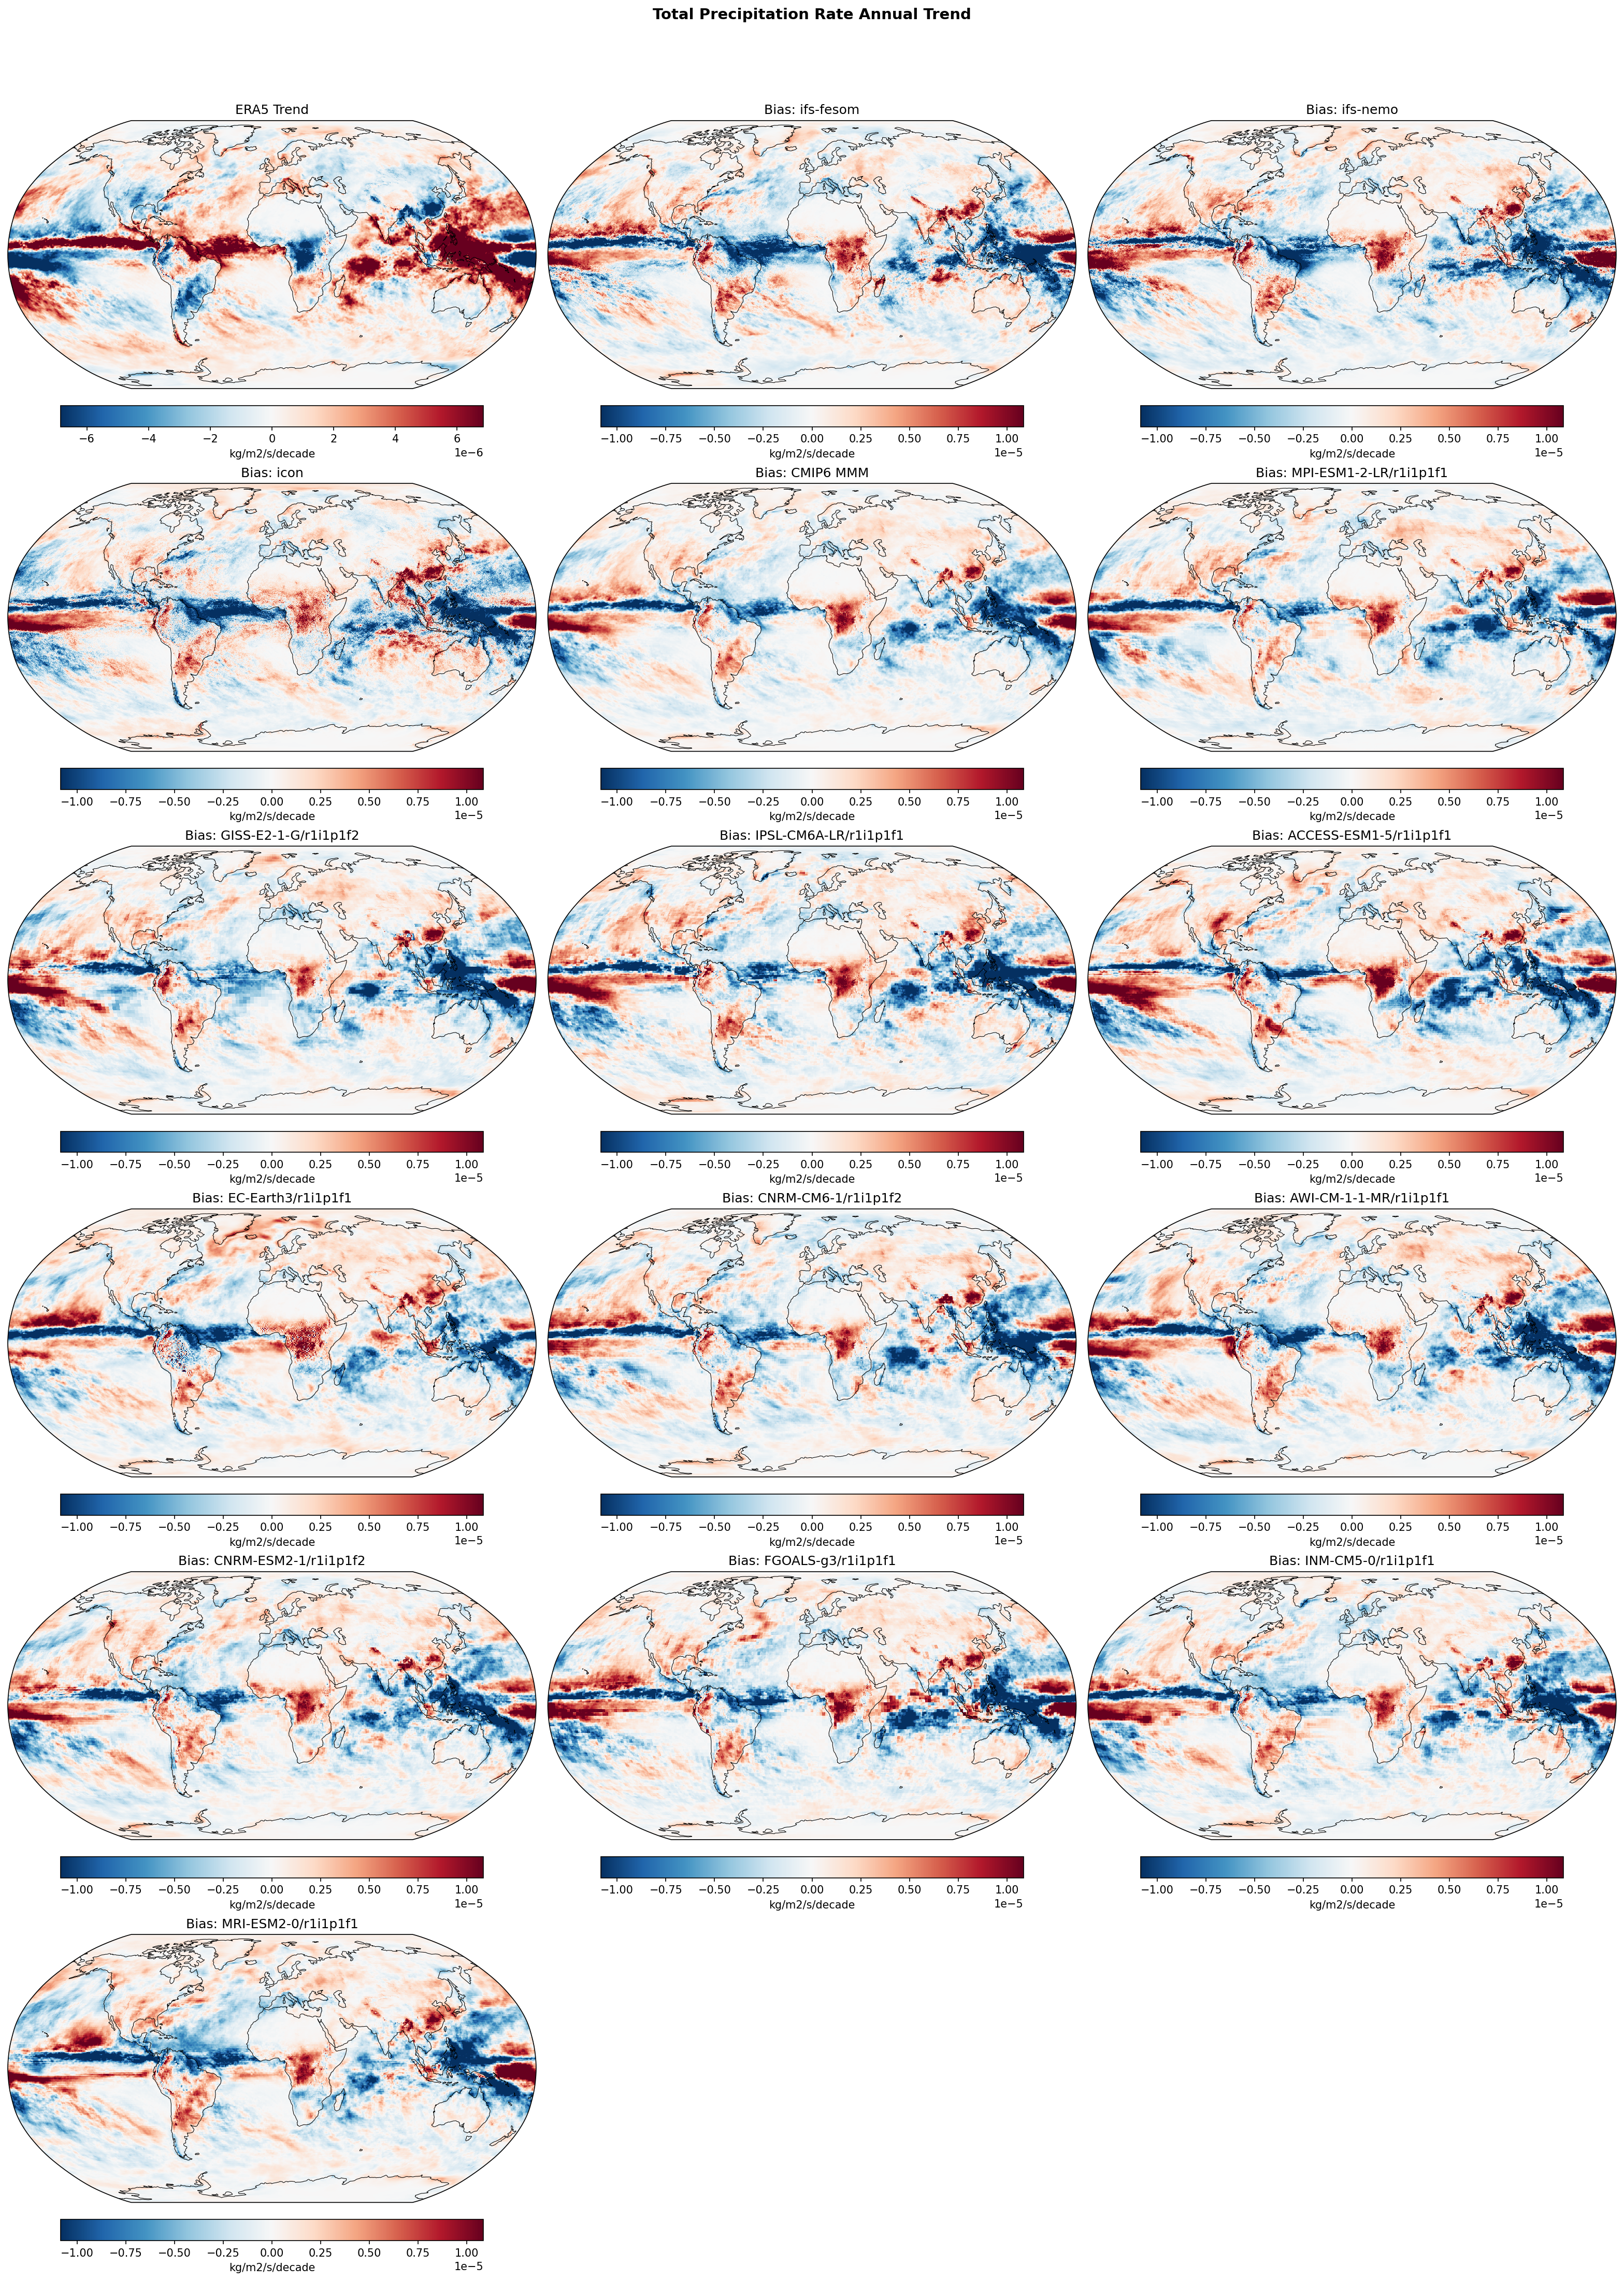
| Variables | avg_tprate |
|---|---|
| Models | ifs-fesom, ifs-nemo, icon, CMIP6 MMM, MPI-ESM1-2-LR/r1i1p1f1, GISS-E2-1-G/r1i1p1f2, IPSL-CM6A-LR/r1i1p1f1, ACCESS-ESM1-5/r1i1p1f1, EC-Earth3/r1i1p1f1, CNRM-CM6-1/r1i1p1f2, AWI-CM-1-1-MR/r1i1p1f1, CNRM-ESM2-1/r1i1p1f2, FGOALS-g3/r1i1p1f1, INM-CM5-0/r1i1p1f1, MRI-ESM2-0/r1i1p1f1 |
| Reference Dataset | ERA5 |
| Units | kg/m2/s/decade |
| Period | 1990–2014 |
| ifs-fesom | Global Mean Trend: 0.00 · Global Mean Trend Diff: -0.00 · Trend Rmse: 0.00 |
| ifs-nemo | Global Mean Trend: 0.00 · Global Mean Trend Diff: -0.00 · Trend Rmse: 0.00 |
| icon | Global Mean Trend: 0.00 · Global Mean Trend Diff: -0.00 · Trend Rmse: 0.00 |
| CMIP6 MMM | Global Mean Trend Diff: -0.00 · Trend Rmse: 0.00 |
| MPI-ESM1-2-LR/r1i1p1f1 | Global Mean Trend Diff: -0.00 · Trend Rmse: 0.00 |
| GISS-E2-1-G/r1i1p1f2 | Global Mean Trend Diff: -0.00 · Trend Rmse: 0.00 |
| IPSL-CM6A-LR/r1i1p1f1 | Global Mean Trend Diff: -0.00 · Trend Rmse: 0.00 |
| ACCESS-ESM1-5/r1i1p1f1 | Global Mean Trend Diff: -0.00 · Trend Rmse: 0.00 |
| EC-Earth3/r1i1p1f1 | Global Mean Trend Diff: -0.00 · Trend Rmse: 0.00 |
| CNRM-CM6-1/r1i1p1f2 | Global Mean Trend Diff: -0.00 · Trend Rmse: 0.00 |
| AWI-CM-1-1-MR/r1i1p1f1 | Global Mean Trend Diff: -0.00 · Trend Rmse: 0.00 |
| CNRM-ESM2-1/r1i1p1f2 | Global Mean Trend Diff: -0.00 · Trend Rmse: 0.00 |
| FGOALS-g3/r1i1p1f1 | Global Mean Trend Diff: -0.00 · Trend Rmse: 0.00 |
| INM-CM5-0/r1i1p1f1 | Global Mean Trend Diff: -0.00 · Trend Rmse: 0.00 |
| MRI-ESM2-0/r1i1p1f1 | Global Mean Trend Diff: -0.00 · Trend Rmse: 0.00 |
Summary high
This figure evaluates annual linear trends in total precipitation rate (1990–2014), comparing DestinE models (IFS-FESOM, IFS-NEMO, ICON) against ERA5 observations and the CMIP6 ensemble. The dominant feature is a systematic discrepancy in the tropical Pacific, where all models fail to capture the observed strengthening of the Walker circulation, resulting in large zonal dipole errors.
Key Findings
- Systematic Pacific Dipole Bias: All models (DestinE and CMIP6) exhibit a strong 'wet-east / dry-west' trend bias relative to observations in the tropical Pacific. This indicates they simulate a weakening or El Niño-like trend, whereas observations show a La Niña-like strengthening of the Walker circulation.
- Magnitude of Error: The trend errors (bias maps) range up to ±1.0e-5 kg/m²/s/decade, which exceeds the magnitude of the observed trends (±0.6e-5 kg/m²/s/decade) in ERA5, indicating poor reliability in regional hydroclimate trend projections over this period.
- DestinE vs. CMIP6: The high-resolution DestinE models (~5 km) display the same error patterns as the coarse-resolution CMIP6 models. IFS-NEMO and IFS-FESOM show trend RMSEs (4.16e-6 and 4.25e-6) slightly higher than the CMIP6 Multi-Model Mean (3.41e-6), suggesting resolution alone does not resolve these decadal circulation biases.
Spatial Patterns
ERA5 (top-left) shows a strong wetting trend over the Maritime Continent and drying in the central/eastern Pacific (1990-2014). The model bias panels display the inverse: negative values (blue) over the Maritime Continent and positive values (red) over the central/eastern Pacific. Significant positive biases (wetting relative to obs) are also seen in the tropical North Atlantic and parts of the Indian Ocean.
Model Agreement
There is remarkably high inter-model agreement regarding the spatial structure of the trend error. IFS-FESOM, IFS-NEMO, and ICON are qualitatively almost indistinguishable from the CMIP6 MMM and individual members like MPI-ESM1-2-LR, confirming this is a fundamental systematic bias in current coupled climate modeling.
Physical Interpretation
The bias patterns reflect the 'cold tongue bias' or 'pattern effect' issue: historical observations show the eastern Pacific cooling (or warming less than the west), driving a stronger Walker circulation and precipitation gradient. Coupled models generally simulate enhanced warming in the equatorial cold tongue, weakening the circulation and shifting convection eastward compared to reality. The persistence of this error in DestinE models implies it stems from unresolved physics (e.g., deep convection parameterizations affecting cloud feedbacks) or forcing/response errors common to the model class, rather than grid resolution.
Caveats
- The analysis period (1990–2014) is short and dominated by internal variability (e.g., IPO phase). Free-running coupled models are not expected to phase-match observed internal variability, which contributes to the large trend errors.
- The 'Bias' panels represent difference in trends (Model Trend minus Obs Trend), not mean state bias.
Total Precipitation Rate DJF Linear Trend
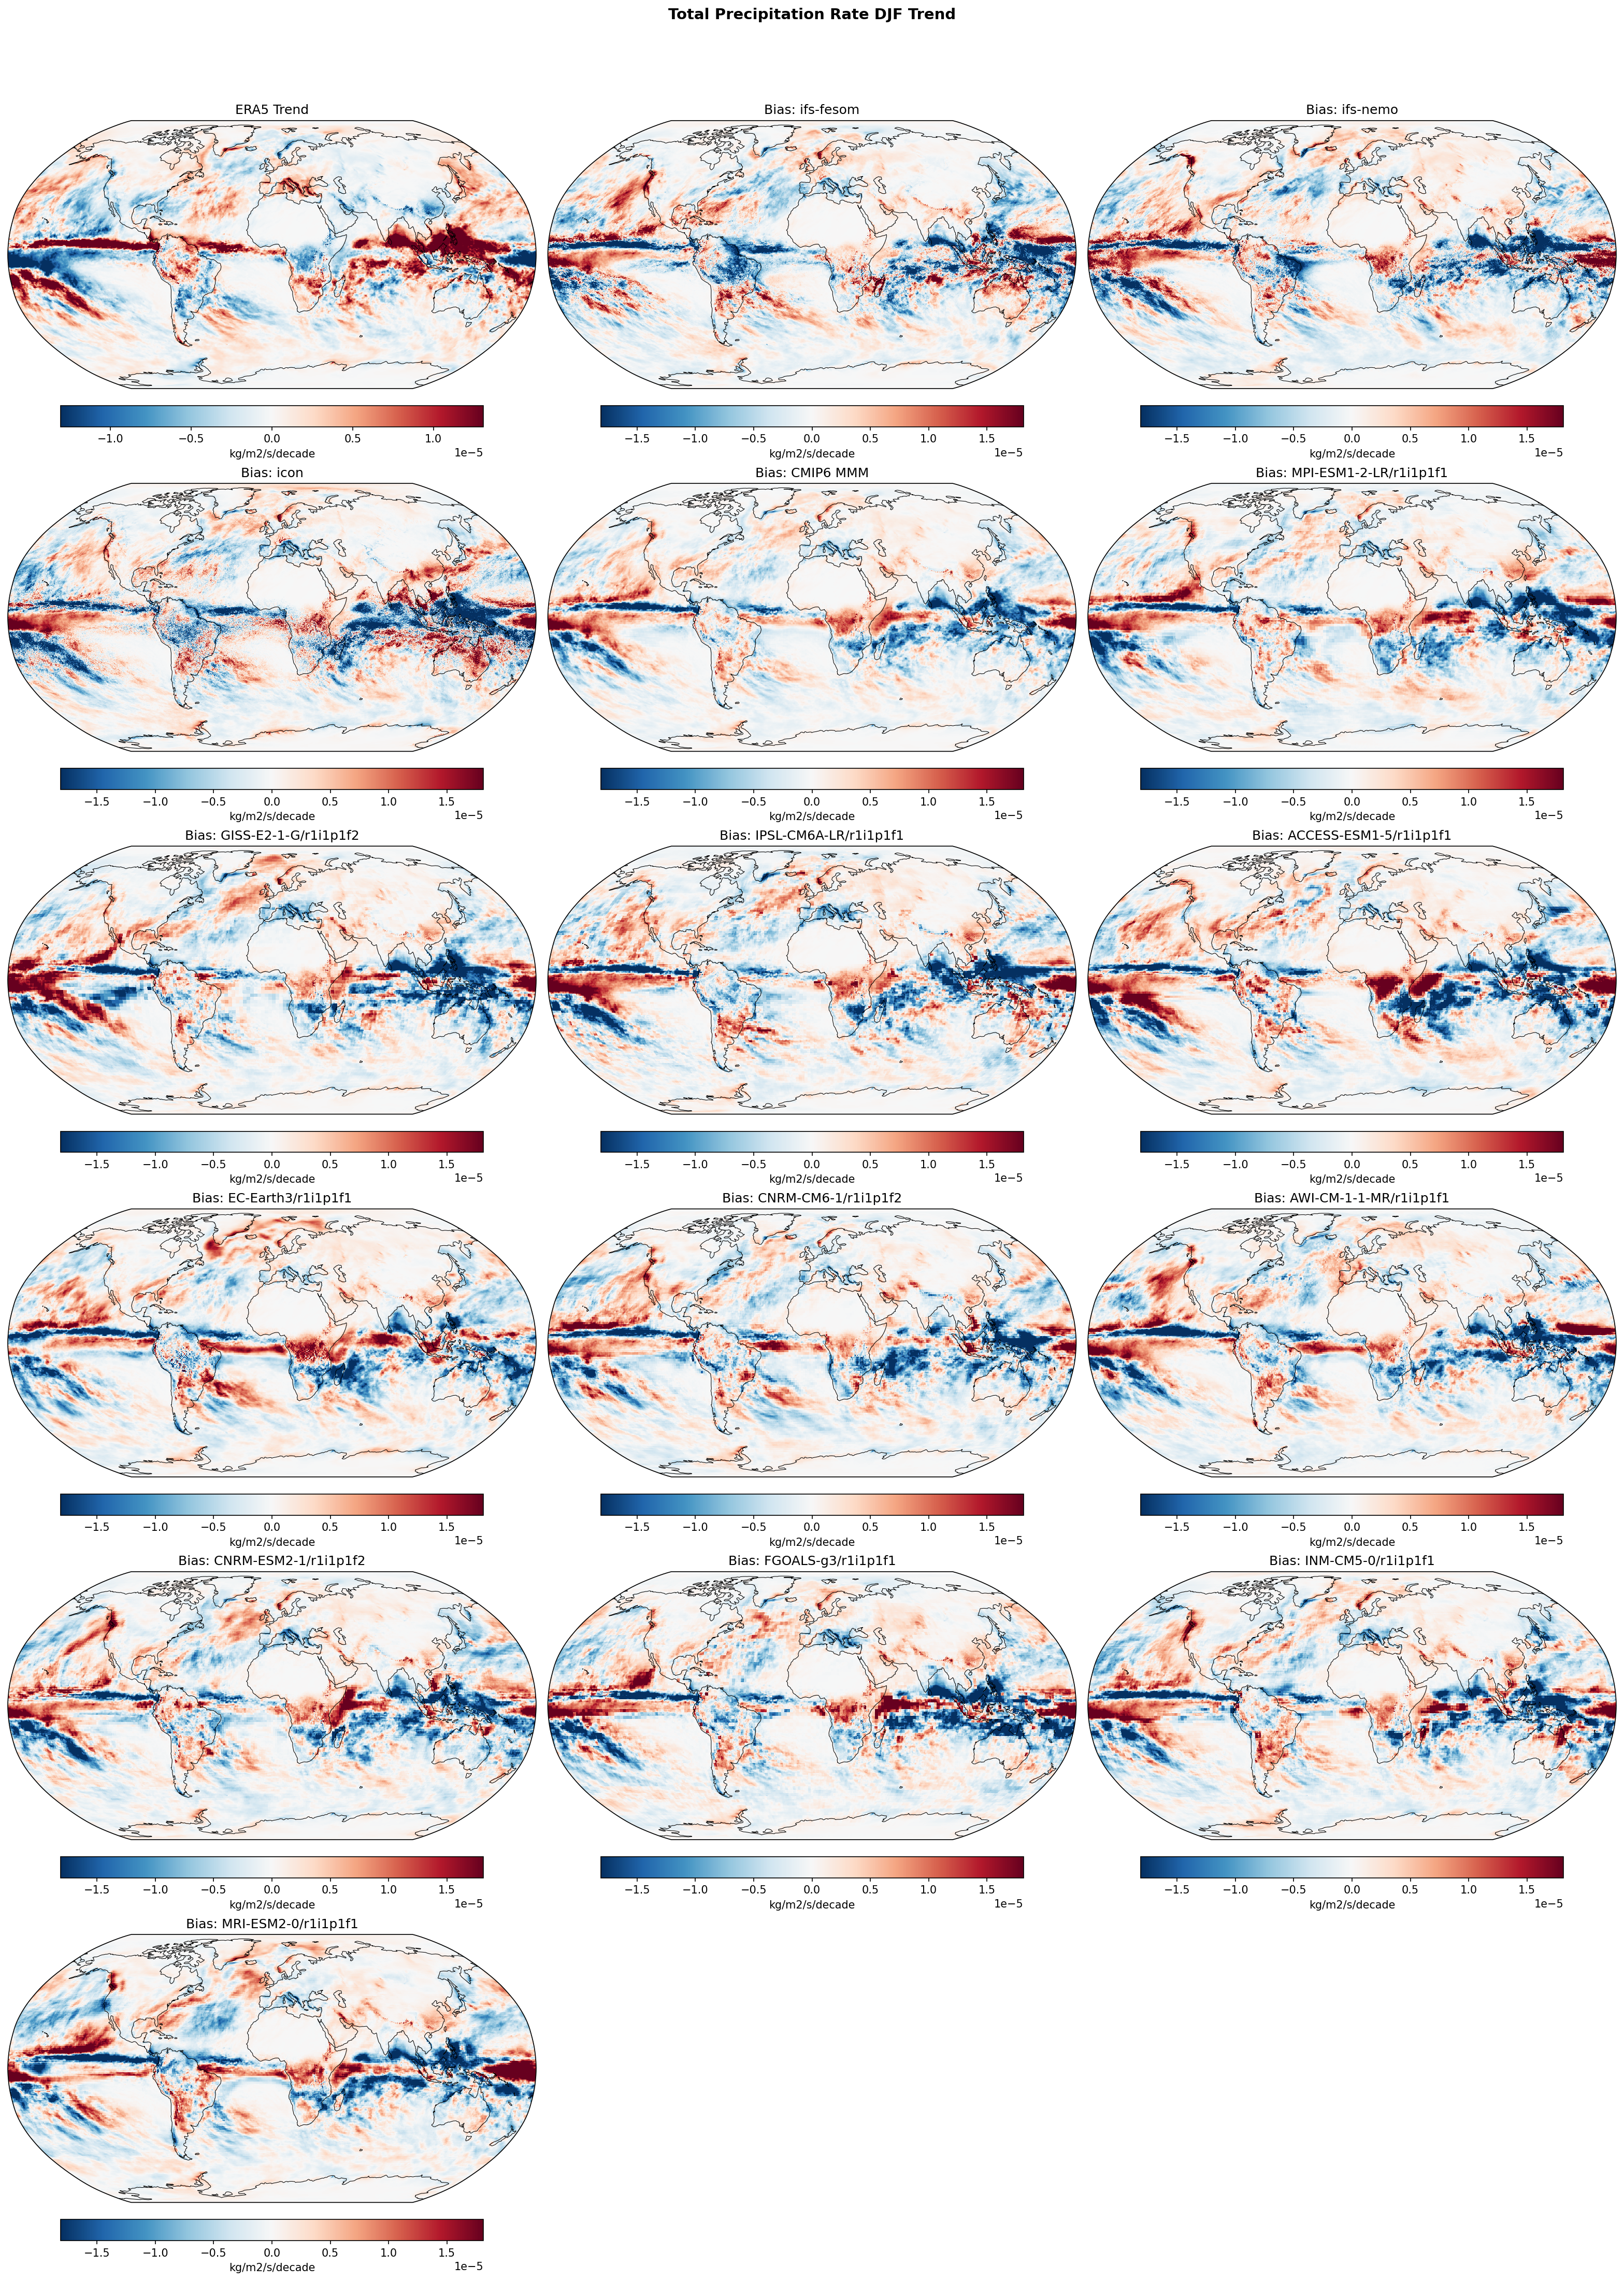
| Variables | avg_tprate |
|---|---|
| Models | ifs-fesom, ifs-nemo, icon, CMIP6 MMM, MPI-ESM1-2-LR/r1i1p1f1, GISS-E2-1-G/r1i1p1f2, IPSL-CM6A-LR/r1i1p1f1, ACCESS-ESM1-5/r1i1p1f1, EC-Earth3/r1i1p1f1, CNRM-CM6-1/r1i1p1f2, AWI-CM-1-1-MR/r1i1p1f1, CNRM-ESM2-1/r1i1p1f2, FGOALS-g3/r1i1p1f1, INM-CM5-0/r1i1p1f1, MRI-ESM2-0/r1i1p1f1 |
| Reference Dataset | ERA5 |
| Units | kg/m2/s/decade |
| Period | 1990–2014 |
| CMIP6 MMM | Global Mean Trend Diff: -0.00 · Trend Rmse: None |
| MPI-ESM1-2-LR/r1i1p1f1 | Global Mean Trend Diff: -0.00 · Trend Rmse: None |
| GISS-E2-1-G/r1i1p1f2 | Global Mean Trend Diff: -0.00 · Trend Rmse: None |
| IPSL-CM6A-LR/r1i1p1f1 | Global Mean Trend Diff: -0.00 · Trend Rmse: None |
| ACCESS-ESM1-5/r1i1p1f1 | Global Mean Trend Diff: -0.00 · Trend Rmse: None |
| EC-Earth3/r1i1p1f1 | Global Mean Trend Diff: -0.00 · Trend Rmse: None |
| CNRM-CM6-1/r1i1p1f2 | Global Mean Trend Diff: -0.00 · Trend Rmse: None |
| AWI-CM-1-1-MR/r1i1p1f1 | Global Mean Trend Diff: -0.00 · Trend Rmse: None |
| CNRM-ESM2-1/r1i1p1f2 | Global Mean Trend Diff: -0.00 · Trend Rmse: None |
| FGOALS-g3/r1i1p1f1 | Global Mean Trend Diff: -0.00 · Trend Rmse: None |
| INM-CM5-0/r1i1p1f1 | Global Mean Trend Diff: -0.00 · Trend Rmse: None |
| MRI-ESM2-0/r1i1p1f1 | Global Mean Trend Diff: -0.00 · Trend Rmse: None |
Summary high
This figure compares linear trends in DJF Total Precipitation Rate (1990–2014) from ERA5 observations against trend differences (model minus observation) for three high-resolution DestinE models and the CMIP6 ensemble.
Key Findings
- ERA5 exhibits a strong La Niña-like trend pattern for this period, characterized by intense wetting over the Maritime Continent/Western Pacific and drying over the Central/Eastern Pacific.
- All models, including the high-resolution DestinE simulations (IFS-FESOM, IFS-NEMO, ICON), display a trend bias pattern that is essentially the inverse of the observations (dry bias in the West Pacific, wet bias in the East Pacific).
- The DestinE models show high inter-model consistency with each other and the broader CMIP6 ensemble regarding the sign of the error, though DestinE models resolve sharper gradients along the ITCZ and topographic features.
- Individual CMIP6 members show similar magnitude discrepancies, confirming that this is a pervasive feature of free-running coupled simulations over this specific period.
Spatial Patterns
The dominant spatial pattern in the bias panels is a dipole across the tropical Pacific: negative trend differences (blue) in the Indo-Pacific warm pool and positive trend differences (red) in the central/eastern Pacific. Significant biases also appear over South America (wet bias over the Amazon vs ERA5 drying trend) and the North Atlantic storm track.
Model Agreement
There is strong agreement across all models (DestinE and CMIP6) that they fail to capture the specific spatial pattern of precipitation trends observed in ERA5 from 1990–2014. The 'bias' maps are strikingly similar across the IFS and ICON variants, suggesting resolution alone does not correct the phasing of decadal variability.
Physical Interpretation
The 1990–2014 period was characterized by a specific phase of internal variability (likely the negative phase of the Interdecadal Pacific Oscillation), resulting in strengthened trade winds and a La Niña-like precipitation pattern in observations. Free-running coupled models generate their own independent phases of internal variability (ENSO/PDO) and are not expected to match the historical chronology of these natural oscillations. Thus, the large 'biases' primarily reflect the mismatch between the specific observed realization of internal variability and the random phases simulated by the models.
Caveats
- The 25-year analysis period is dominated by internal variability, making it difficult to assess forced climate trends.
- Mismatch in trends is expected for non-initialized (free-running) simulations and does not necessarily imply structural model errors.
- Bias magnitudes are of the same order as the observed trends.
Total Precipitation Rate JJA Linear Trend
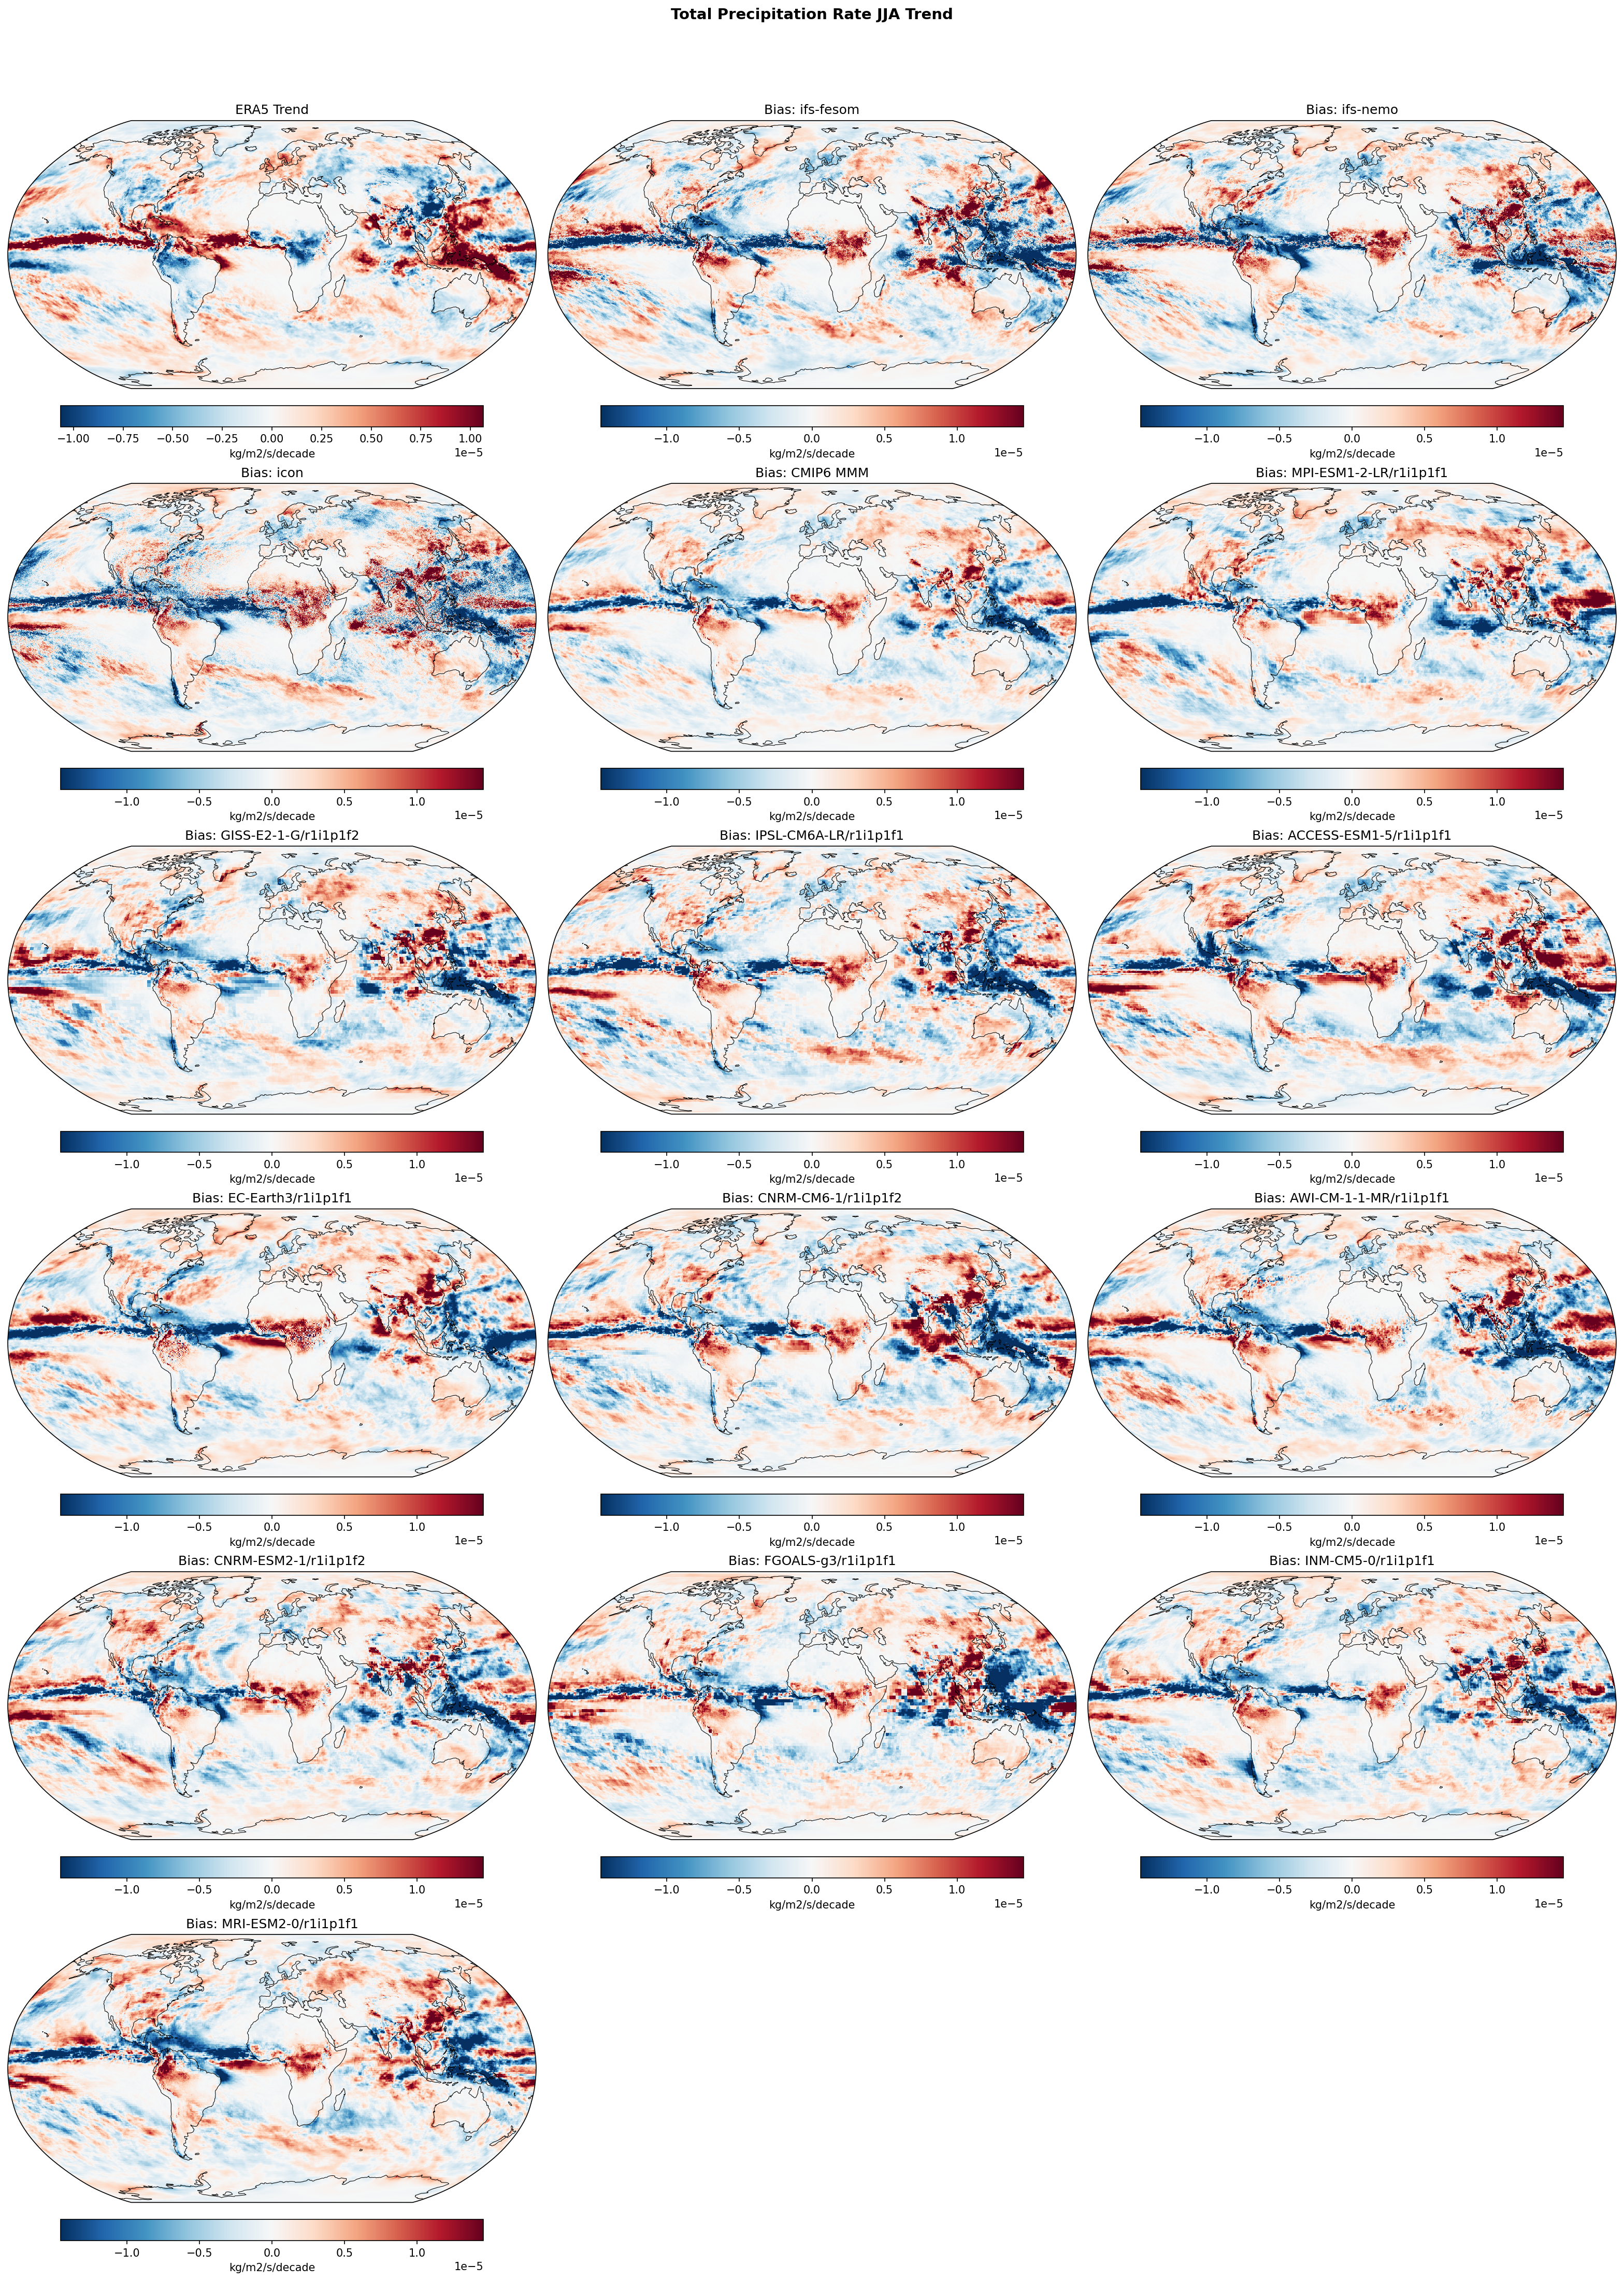
| Variables | avg_tprate |
|---|---|
| Models | ifs-fesom, ifs-nemo, icon, CMIP6 MMM, MPI-ESM1-2-LR/r1i1p1f1, GISS-E2-1-G/r1i1p1f2, IPSL-CM6A-LR/r1i1p1f1, ACCESS-ESM1-5/r1i1p1f1, EC-Earth3/r1i1p1f1, CNRM-CM6-1/r1i1p1f2, AWI-CM-1-1-MR/r1i1p1f1, CNRM-ESM2-1/r1i1p1f2, FGOALS-g3/r1i1p1f1, INM-CM5-0/r1i1p1f1, MRI-ESM2-0/r1i1p1f1 |
| Reference Dataset | ERA5 |
| Units | kg/m2/s/decade |
| Period | 1990–2014 |
| CMIP6 MMM | Global Mean Trend Diff: -0.00 · Trend Rmse: None |
| MPI-ESM1-2-LR/r1i1p1f1 | Global Mean Trend Diff: -0.00 · Trend Rmse: None |
| GISS-E2-1-G/r1i1p1f2 | Global Mean Trend Diff: -0.00 · Trend Rmse: None |
| IPSL-CM6A-LR/r1i1p1f1 | Global Mean Trend Diff: -0.00 · Trend Rmse: None |
| ACCESS-ESM1-5/r1i1p1f1 | Global Mean Trend Diff: -0.00 · Trend Rmse: None |
| EC-Earth3/r1i1p1f1 | Global Mean Trend Diff: -0.00 · Trend Rmse: None |
| CNRM-CM6-1/r1i1p1f2 | Global Mean Trend Diff: -0.00 · Trend Rmse: None |
| AWI-CM-1-1-MR/r1i1p1f1 | Global Mean Trend Diff: -0.00 · Trend Rmse: None |
| CNRM-ESM2-1/r1i1p1f2 | Global Mean Trend Diff: -0.00 · Trend Rmse: None |
| FGOALS-g3/r1i1p1f1 | Global Mean Trend Diff: -0.00 · Trend Rmse: None |
| INM-CM5-0/r1i1p1f1 | Global Mean Trend Diff: -0.00 · Trend Rmse: None |
| MRI-ESM2-0/r1i1p1f1 | Global Mean Trend Diff: -0.00 · Trend Rmse: None |
Summary high
This diagnostic compares the linear trend in JJA total precipitation rate (1990–2014) from ERA5 reanalysis against three high-resolution DestinE models (IFS-FESOM, IFS-NEMO, ICON) and the CMIP6 ensemble. The figure highlights substantial discrepancies in decadal hydrological evolution, particularly in the tropical Pacific and Maritime Continent.
Key Findings
- Systematic underestimation of the Pacific ITCZ wetting trend: ERA5 shows strong wetting in the central/eastern Pacific ITCZ, while almost all models (DestinE and CMIP6) exhibit a strong negative bias (relative drying) in this region.
- Overestimation of trends in the Maritime Continent: DestinE models, particularly IFS-FESOM and IFS-NEMO, show a marked positive bias (excessive wetting trend) over the Indo-Pacific warm pool compared to ERA5.
- High-resolution noise in ICON: The ICON model displays a highly speckled, noisy trend difference pattern, suggesting strong grid-scale internal variability not present in the smoother IFS or CMIP6 fields.
- DestinE vs. CMIP6: The high-resolution DestinE models amplify the spatial biases seen in the CMIP6 Multi-Model Mean, particularly the zonal dipole error across the tropical Pacific.
Spatial Patterns
The dominant feature is a zonal dipole in the trend bias across the tropical Pacific: positive biases (blue) in the west (Maritime Continent/West Pacific) and negative biases (red) in the central/east Pacific ITCZ region. ERA5 shows a distinct wetting band in the Sahel which is poorly captured or inconsistent across models. The IFS models also show strong localized positive trend biases over high topography (e.g., Himalayas).
Model Agreement
There is strong qualitative agreement on the sign of the error across the hierarchy of models (DestinE and CMIP6): they consistently fail to replicate the magnitude of the observed wetting trend in the ITCZ. IFS-FESOM and IFS-NEMO are nearly identical in their bias structure, while ICON is distinct due to its high-frequency spatial noise.
Physical Interpretation
The pattern of biases (wetting bias in the West Pacific, drying bias in the East Pacific relative to observations) suggests the models fail to capture the observed strengthening of the Walker circulation (La Niña-like trend) during this period. Instead, the models likely simulate a weakening or neutral trend, leading to a westward shift in precipitation focus compared to reality. The high spatial frequency in ICON trends likely reflects unconstrained internal variability at the mesoscale.
Caveats
- The analysis period (1990–2014) is relatively short (25 years), meaning trends are heavily influenced by internal climate variability (e.g., ENSO, IPO) rather than just forced response.
- ERA5 precipitation over the ocean is model-derived and carries its own uncertainties, serving as a reference rather than absolute truth.