Precipitation Precipitation Evaluation (MSWEP) CMIP6
CMIP6 Multi-Model Mean Context
Comparison with CMIP6 ensemble mean from 11 members.
Contributing models: ACCESS-ESM1-5, AWI-CM-1-1-MR, CNRM-CM6-1, CNRM-ESM2-1, EC-Earth3, FGOALS-g3, GISS-E2-1-G, INM-CM5-0, IPSL-CM6A-LR, MPI-ESM1-2-LR, MRI-ESM2-0
Synthesis
Related diagnostics
Precipitation Annual Mean Bias
| Variables | pr |
|---|---|
| Models | ifs-fesom, ifs-nemo, icon, CMIP6 MMM |
| Reference Dataset | MSWEP |
| Units | kg/m2/s |
| Period | 1990–2014 |
| ifs-fesom | Global Mean Bias: 0.00 · Rmse: 0.00 · Pattern Correlation: 0.89 · Std Ratio: 1.11 · Tropical Mean Bias: 0.00 · Extratropical Mean Bias: 0.00 |
| ifs-nemo | Global Mean Bias: 0.00 · Rmse: 0.00 · Pattern Correlation: 0.94 · Std Ratio: 1.19 · Tropical Mean Bias: 0.00 · Extratropical Mean Bias: 0.00 |
| icon | Global Mean Bias: 0.00 · Rmse: 0.00 · Pattern Correlation: 0.80 · Std Ratio: 1.11 · Tropical Mean Bias: 0.00 · Extratropical Mean Bias: 0.00 |
| CMIP6 MMM | Global Mean Bias: 0.00 · Rmse: 0.00 |
Summary high
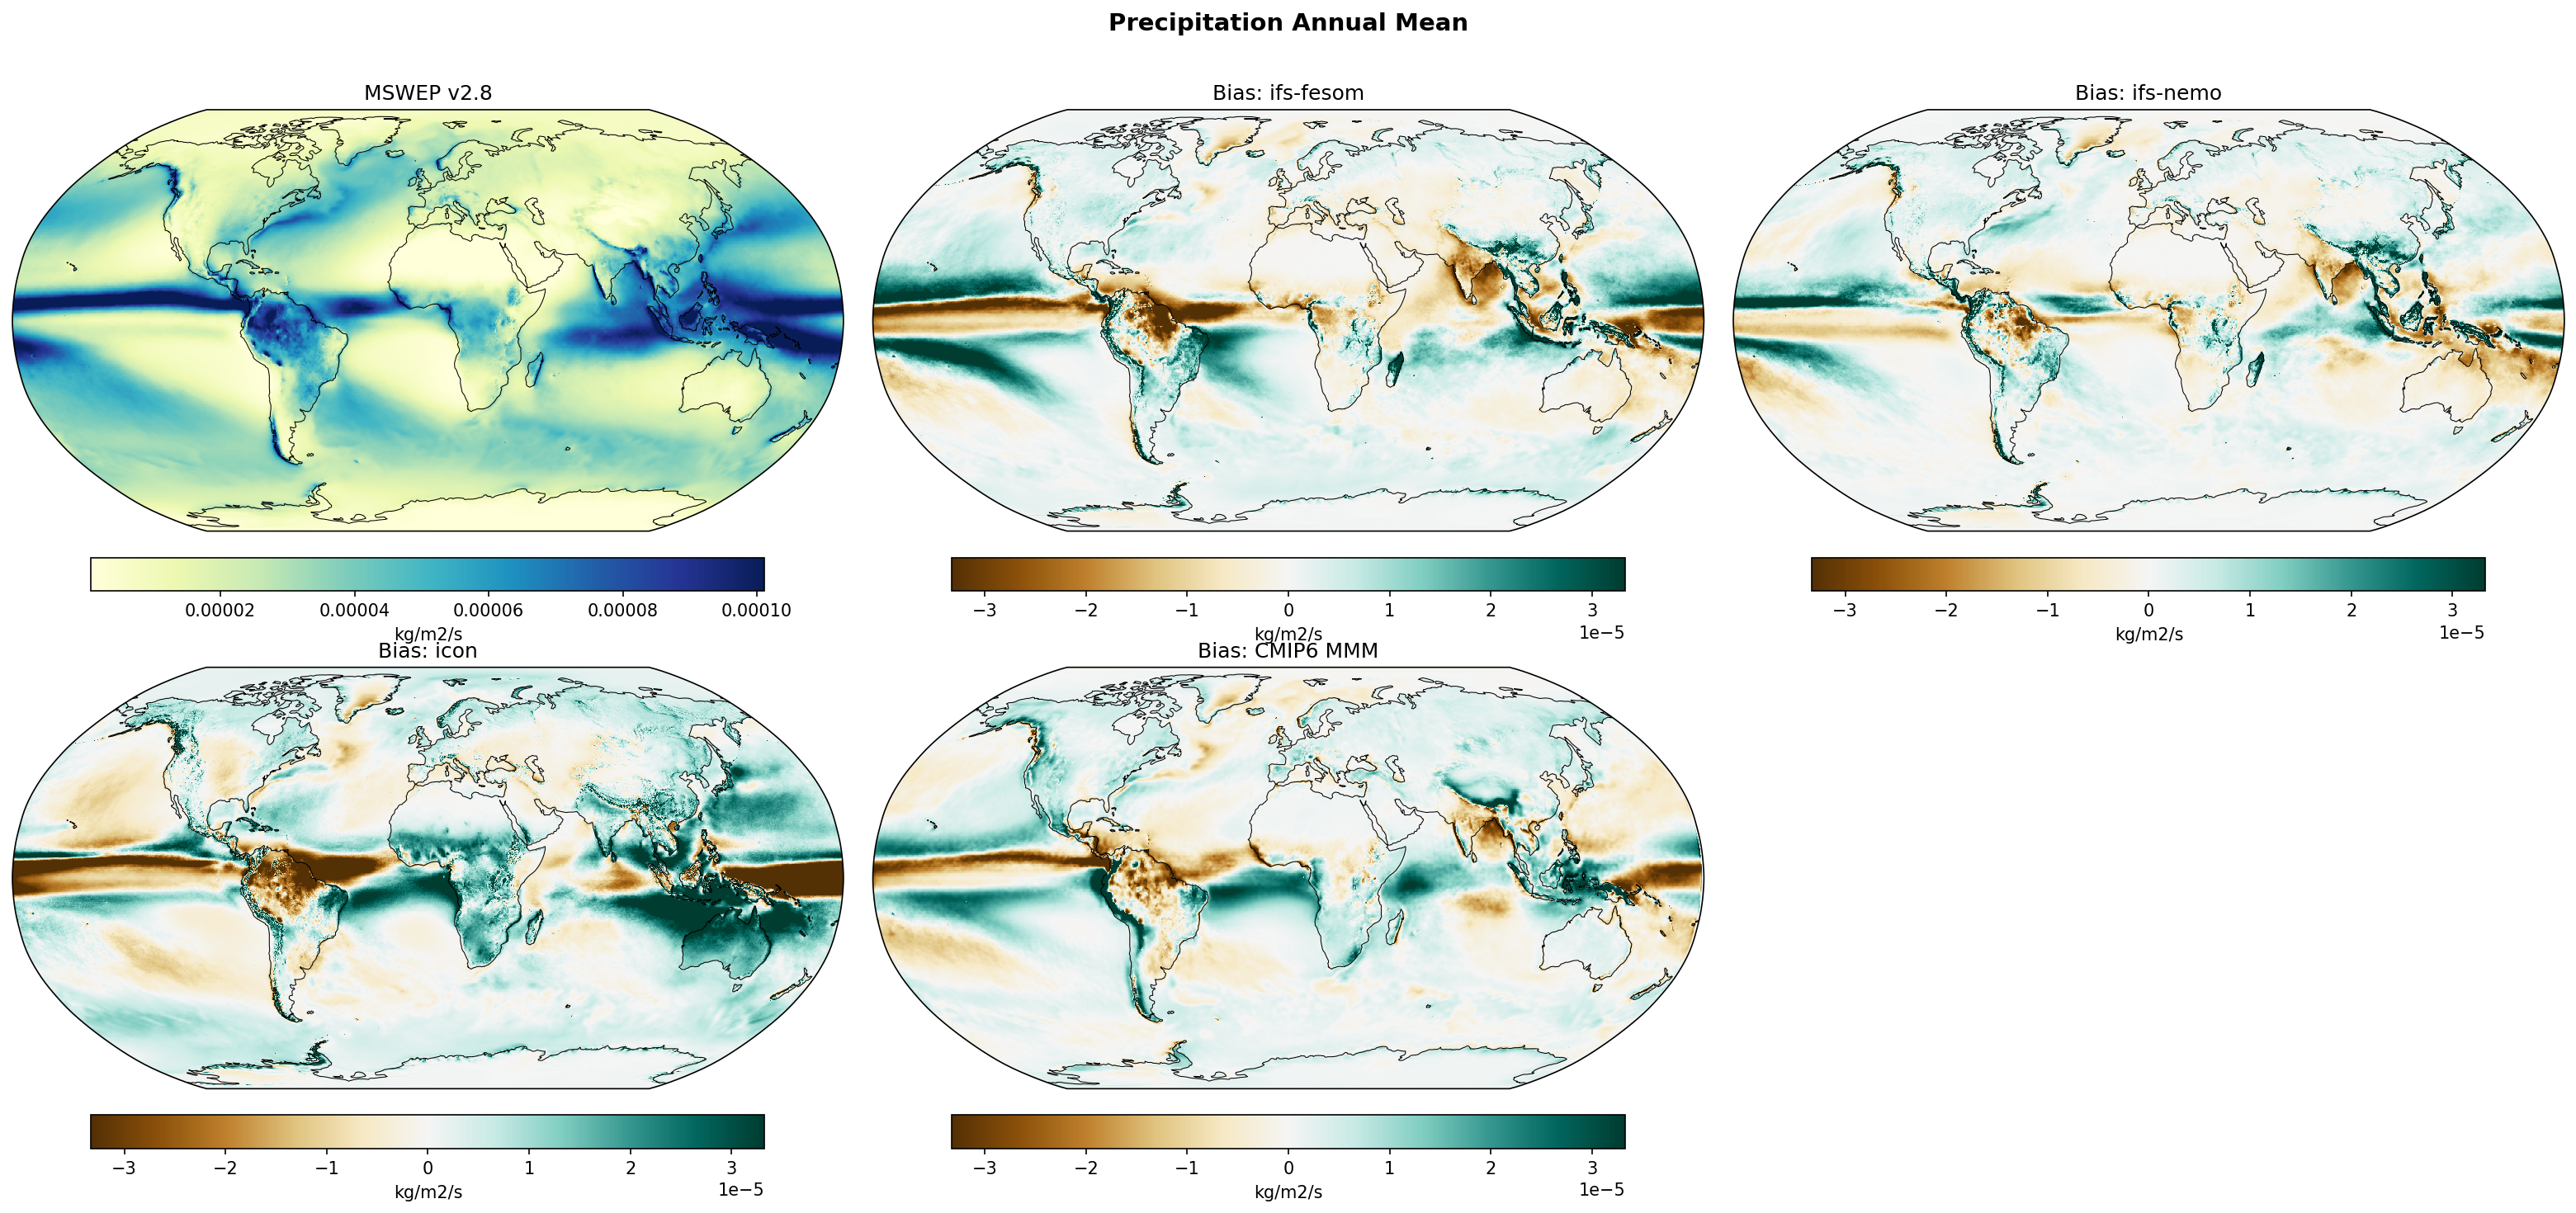
This diagnostic compares annual mean precipitation biases of three high-resolution coupled models (ifs-fesom, ifs-nemo, icon) and the CMIP6 multi-model mean against MSWEP v2.8 observations. ifs-nemo demonstrates the best performance among the single models, closely matching the CMIP6 ensemble mean's skill, while icon exhibits severe widespread wet biases in the tropics.
Key Findings
- icon is an outlier with excessive precipitation throughout the tropics (RMSE 1.72e-5 kg/m²/s), showing a very broad and intense ITCZ/SPCZ structure.
- ifs-nemo outperforms ifs-fesom (RMSE 1.11e-5 vs 1.28e-5 kg/m²/s), significantly reducing the 'double ITCZ' wet bias in the South Pacific and the wet bias in the Atlantic ITCZ.
- A systematic dry bias over the Amazon basin is present in all models, including the CMIP6 MMM, indicating a persistent challenge in capturing South American hydroclimate.
- The 'double ITCZ' syndrome—excessive precipitation in the south-eastern tropical Pacific—is visible in all models but is most severe in icon and ifs-fesom.
Spatial Patterns
The spatial maps reveal distinct bias structures: icon shows a nearly zonal, overly wet band spanning the entire tropical Pacific and Atlantic. ifs-fesom displays a pronounced 'double ITCZ' with a strong wet band south of the equator in the Pacific and a wet Atlantic ITCZ. ifs-nemo shows these features but with much lower amplitude, presenting a cleaner field similar to the CMIP6 MMM. In the extratropics, icon shows wet biases in the Southern Ocean and Northern Hemisphere storm tracks, whereas ifs-nemo is relatively unbiased.
Model Agreement
ifs-nemo shows the highest agreement with observations (correlation 0.94), surpassing ifs-fesom (0.89) and approaching the fidelity of the smoothed CMIP6 MMM. icon has the lowest agreement (correlation 0.80). All models agree on the Amazon dry bias sign, though magnitudes vary.
Physical Interpretation
The 'double ITCZ' biases are likely linked to coupled ocean-atmosphere feedbacks, specifically errors in the meridional SST gradient (e.g., a cold tongue that is too cold or narrow) and convection parameterizations that trigger too easily off the equator. The Amazon dry bias suggests issues with land-surface coupling, evapotranspiration, or moisture transport from the Atlantic. The widespread wet bias in icon suggests a fundamental tuning issue in its convection or microphysics schemes leading to excessive global precipitation rates.
Caveats
- Annual mean averaging obscures seasonal biases, particularly in monsoon regions where timing is critical.
- Observational uncertainty in MSWEP is higher over open oceans and complex terrain compared to land stations.
Precipitation Relative Bias (Annual)
| Variables | pr |
|---|---|
| Models | ifs-fesom, ifs-nemo, icon, CMIP6 MMM |
| Reference Dataset | MSWEP |
| Units | kg/m2/s |
| Period | 1990–2014 |
Summary high
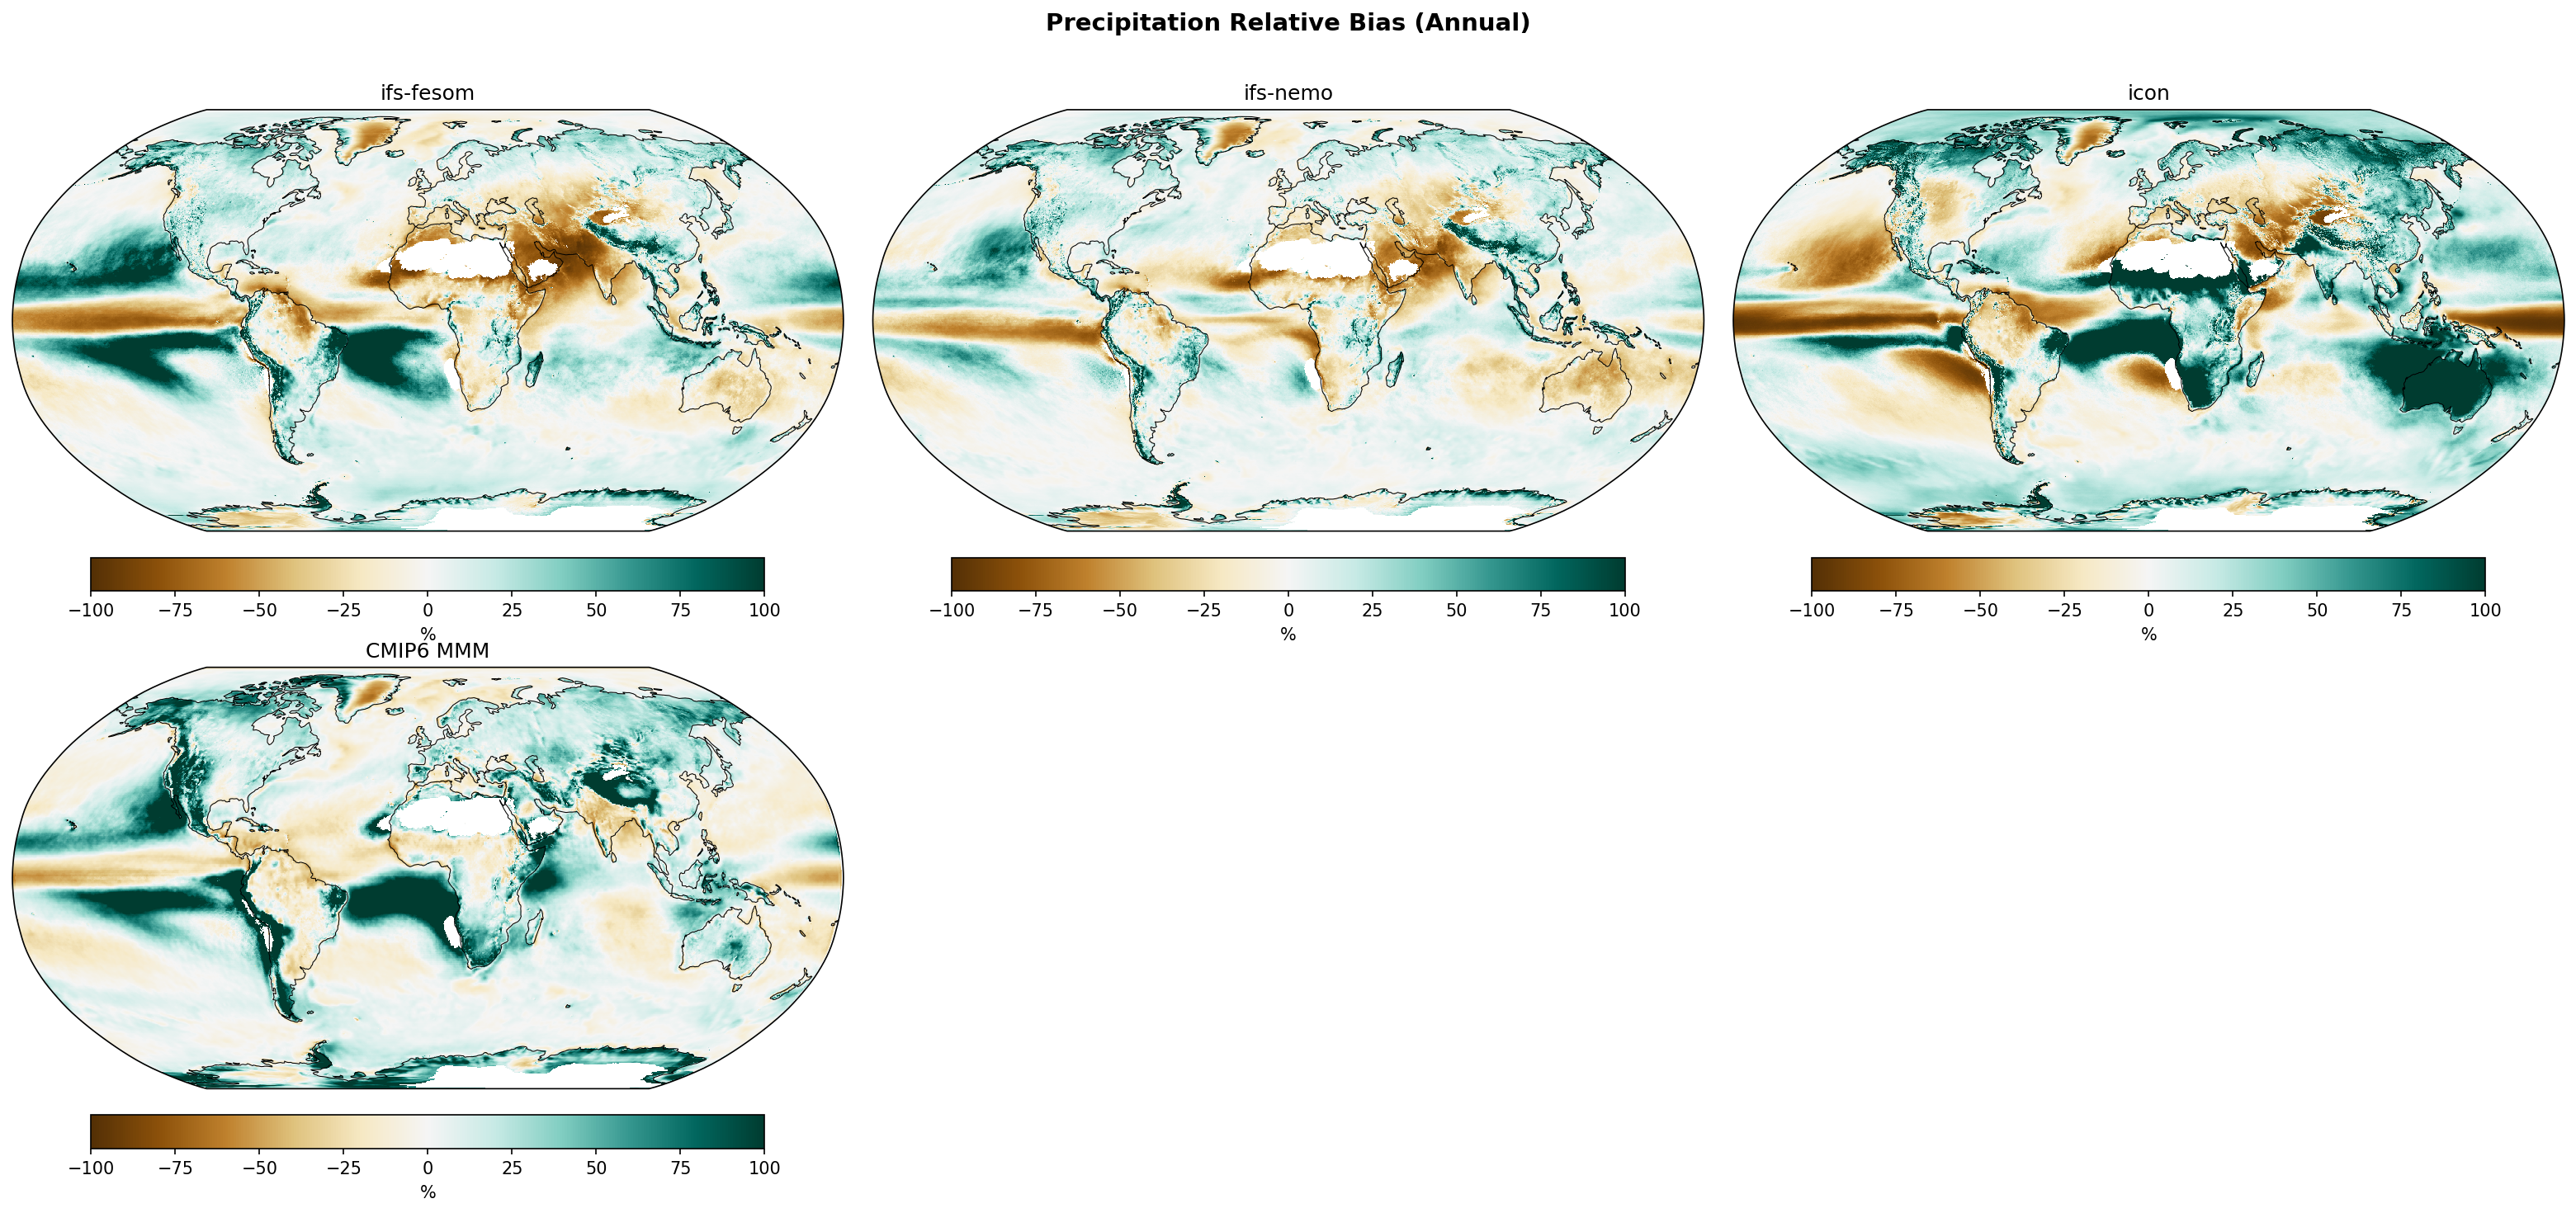
This figure displays annual mean precipitation relative biases (%) for three high-resolution DestinE models (ifs-fesom, ifs-nemo, icon) and the CMIP6 multi-model mean compared to MSWEP v2.8 observations.
Key Findings
- All models, including the CMIP6 MMM, exhibit a substantial dry bias over the Amazon basin, with ICON showing the most severe deficit (>75% dry bias).
- The IFS-based models (ifs-fesom and ifs-nemo) show remarkable similarity, indicating that atmospheric physics, rather than ocean coupling (FESOM vs NEMO), dominates precipitation errors.
- ICON presents significantly larger bias magnitudes globally compared to the IFS models, characterized by excessive precipitation in the tropical Pacific ITCZ and Australia, and severe drying over South America and Africa.
- A widespread wet bias exists over the Southern Ocean in all models, a common feature in climate simulations often linked to excessive drizzle or cloud phase parameterization.
Spatial Patterns
The IFS models feature a distinct dry bias along the equatorial Pacific (indicative of a cold tongue bias extending too far west) flanked by wet biases. In contrast, ICON shows a massive wet bias in the northern tropical Pacific and a strong dry bias in the South Pacific. Over land, the most prominent feature is the 'brown' dry signal over the Amazon and Congo basins, prevalent in all panels but spatially larger and more intense in ICON. The Southern Ocean and North Atlantic storm tracks generally show wet biases (teal).
Model Agreement
ifs-fesom and ifs-nemo are nearly identical, confirming that the change in ocean model grid/numerics has a secondary effect on atmospheric precipitation biases compared to the atmospheric component itself. ICON is an outlier with much higher spatial variance and stronger amplitude biases. The CMIP6 MMM shows smoother versions of these biases, particularly the 'double ITCZ' signature (wet bands flanking the equator) and the Amazon drying.
Physical Interpretation
The persistent Amazon dry bias across all models suggests systemic deficiencies in convection parameterizations or land-surface coupling (e.g., evapotranspiration feedback) that resolution alone does not resolve. The equatorial Pacific dry strip in IFS models suggests an overly strong or westward-extended cold tongue suppressing convection. ICON's strong wet bias over Australia and the maritime continent suggests overly aggressive convective activity in the warm pool region.
Caveats
- Relative bias (%) amplifies errors in dry regions; while masked where <0.1 mm/day, semi-arid regions bordering deserts can still show extreme percentage values for small absolute errors.
- MSWEP observations in the Southern Ocean rely heavily on satellite and reanalysis data, which carry their own uncertainties.
Precipitation DJF Bias
| Variables | pr |
|---|---|
| Models | ifs-fesom, ifs-nemo, icon, CMIP6 MMM |
| Reference Dataset | MSWEP |
| Units | kg/m2/s |
| Period | 1990–2014 |
| CMIP6 MMM | Global Mean Bias: 0.00 · Rmse: None |
Summary high
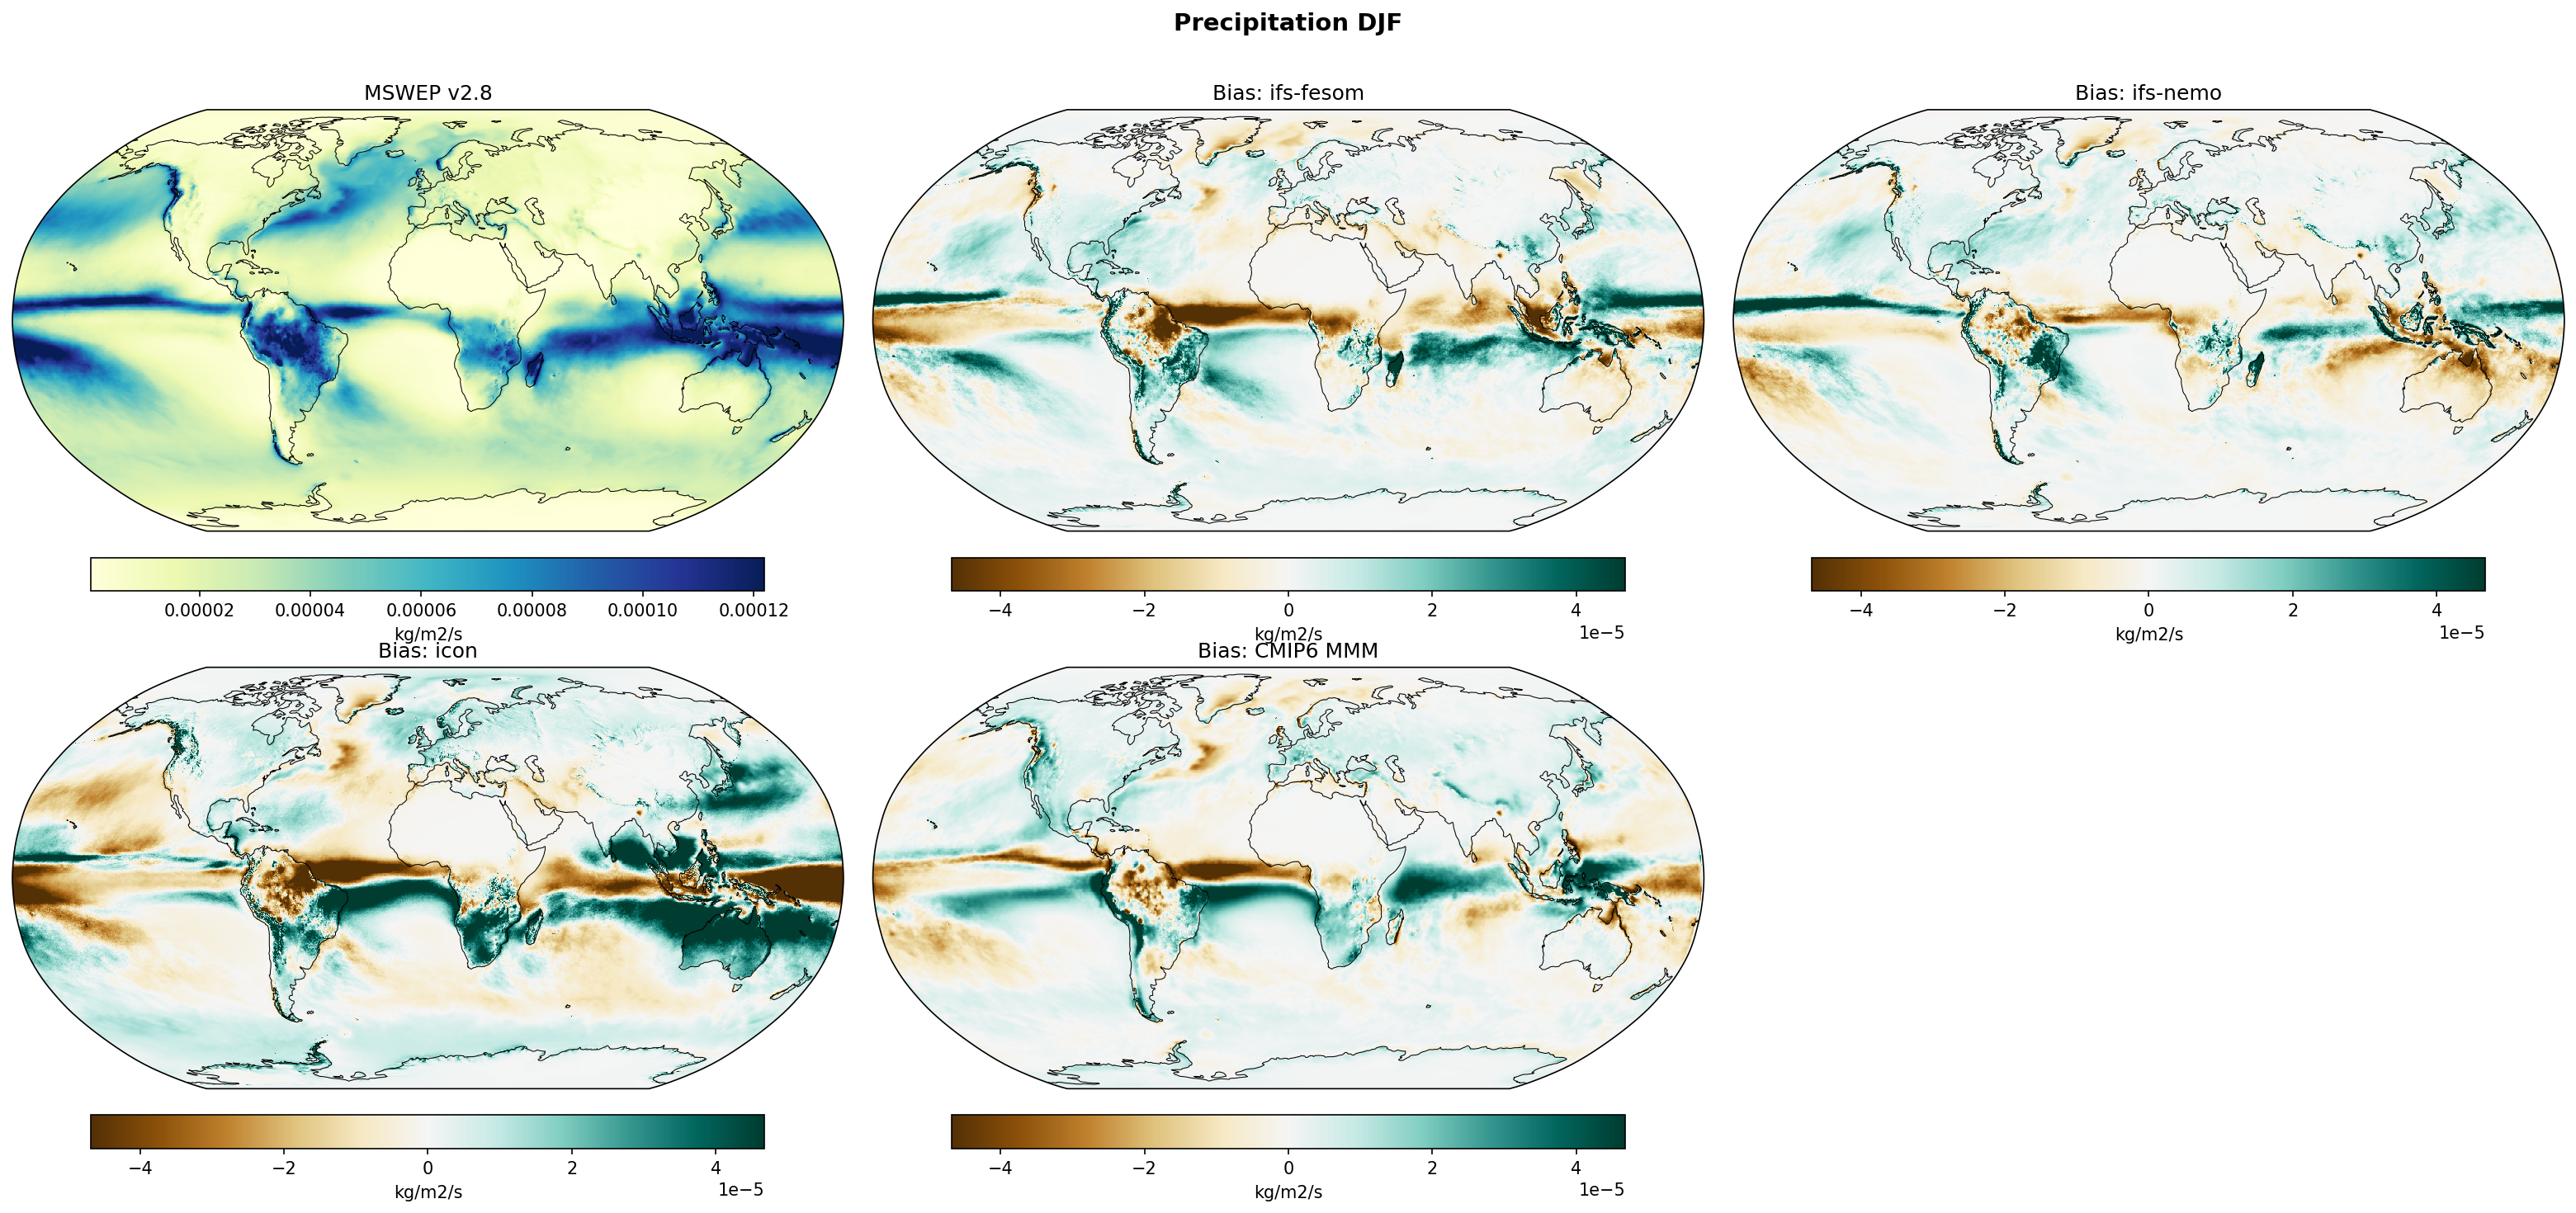
This figure presents Global DJF precipitation biases for three high-resolution models (ifs-fesom, ifs-nemo, icon) and the CMIP6 multi-model mean relative to MSWEP v2.8 observations. The models exhibit significant systematic biases in tropical convergence zones and over major rainforest basins, with distinct differences between the IFS and ICON model families.
Key Findings
- IFS-FESOM and IFS-NEMO show nearly identical bias patterns, confirming that atmospheric physics (shared IFS component) dominate precipitation errors over ocean model differences.
- A prominent dry bias over the Amazon basin is present in all models, including CMIP6; however, ICON shows a distinct, intense wet bias along the Andes mountains that contrasts with the dry basin to the east.
- ICON exhibits larger amplitude biases than the IFS models, particularly a strong wet bias across the southern tropical Indian Ocean and a more pronounced 'double ITCZ' structure in the Pacific.
- IFS models display a dipole bias in the Maritime Continent/Indian Ocean region (wet West Indian Ocean, dry Maritime Continent) which is less apparent in the CMIP6 mean.
Spatial Patterns
The tropical Pacific shows a characteristic zonal band structure, with wet biases south of the equator (SPCZ region) indicative of a double-ITCZ problem, particularly in ICON. The Amazon and Congo basins are dominated by dry biases (brown), though ICON shows extreme wetness (dark green) along the Andean orography. Northern Hemisphere storm tracks (North Atlantic/Pacific) generally show wet biases. The Indian Ocean in ICON is anomalously wet (broad green area south of the equator).
Model Agreement
There is extremely high agreement between ifs-fesom and ifs-nemo, suggesting robustness to the ocean grid (unstructured vs structured). There is partial agreement between IFS and ICON on the sign of biases over land (Amazon dry, Southern Africa dry), but significant disagreement in the tropical oceans, where ICON is much wetter. The high-resolution models resolve orographic features (e.g., Andes, Himalayas) more sharply than the CMIP6 MMM, leading to localized high-amplitude biases.
Physical Interpretation
The pervasive dry bias over the Amazon suggests deficiencies in moisture recycling or convective triggering over land, a long-standing challenge in climate modelling. In ICON, the sharp wet bias over the Andes coupled with the dry Amazon suggests an 'upstream blocking' effect where moisture is rained out orographically before reaching the basin. The double-ITCZ features in the Pacific imply issues with the meridional SST gradient or the coupling strength of tropical convection. The similarity between IFS variants confirms that these atmospheric precipitation biases are relatively insensitive to the underlying ocean discretization (FESOM vs NEMO).
Caveats
- Biases are shown for DJF only; seasonal migration of the ITCZ may alter these patterns in other seasons.
- MSWEP v2.8 combines gauge, satellite, and reanalysis data; uncertainties remain high over the open ocean and sparsely instrumented regions like the Amazon.
Precipitation Intensity Distribution
| Variables | pr |
|---|---|
| Models | CMIP6 MMM, ifs-fesom, ifs-nemo, icon, MSWEP |
| Reference Dataset | MSWEP |
| Units | kg/m2/s |
| Period | 1990–2014 |
Summary high
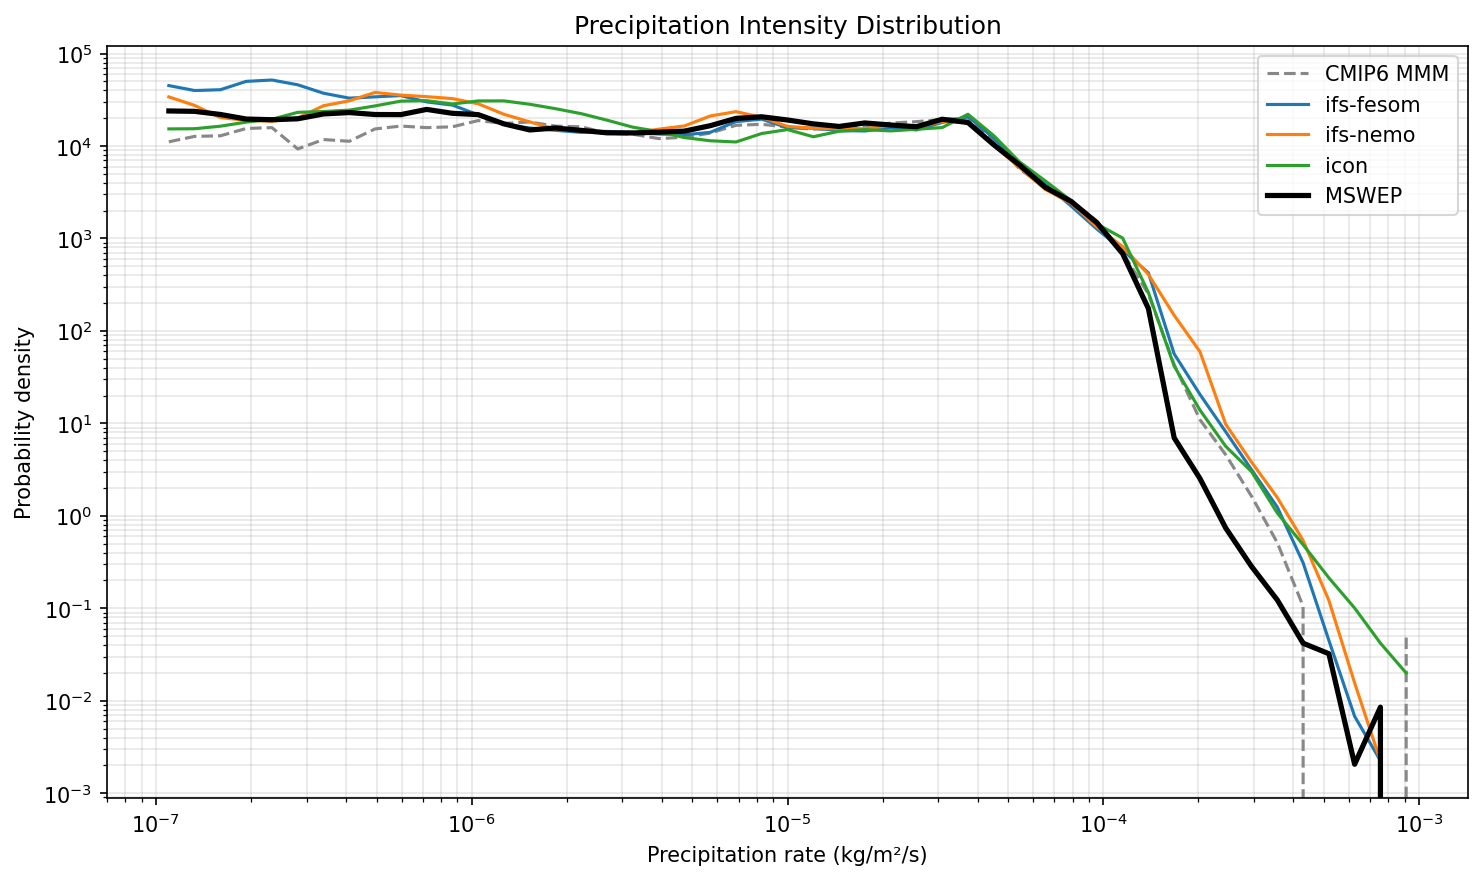
This figure displays the probability density function (PDF) of grid-cell annual-mean precipitation rates, comparing high-resolution DestinE models against MSWEP observations and the CMIP6 multi-model mean. It reveals that the high-resolution models systematically overestimate the spatial prevalence of extremely wet climatologies compared to observations.
Key Findings
- High-resolution models (ifs-fesom, ifs-nemo, icon) exhibit a significant 'heavy tail' bias, overestimating the probability of high mean precipitation rates (>10⁻⁴ kg m⁻² s⁻¹) by nearly an order of magnitude compared to MSWEP.
- The CMIP6 multi-model mean tracks the observational cutoff for high precipitation rates much better than the high-resolution models, likely due to coarser resolution averaging.
- ifs-fesom shows a distinct overestimation of very dry grid cells (<4×10⁻⁷ kg m⁻² s⁻¹) compared to MSWEP and other models, suggesting a sharper separation between arid and wet regions.
- In the moderate precipitation range (10⁻⁵ to 5×10⁻⁵ kg m⁻² s⁻¹), all models and observations show relatively good agreement.
Spatial Patterns
The distribution is characterized by a heavy tail in the high-resolution models extending towards 10⁻³ kg m⁻² s⁻¹ (~31,000 mm/year), a physically unrealistic annual accumulation, whereas MSWEP observations drop off sharply around 2×10⁻⁴ kg m⁻² s⁻¹. This suggests the models simulate localized regions of excessive permanent rainfall.
Model Agreement
The three high-resolution models (ifs-fesom, ifs-nemo, icon) cluster closely in the high-intensity tail, showing a shared systematic bias distinct from the CMIP6 ensemble. icon exhibits the most pronounced heavy tail at the extreme end.
Physical Interpretation
The 'heavy tail' in high-resolution models likely results from persistent, localized convective features (e.g., in the ITCZ or steep orography) that are not spatially smoothed as they are in coarser CMIP6 models or observational products. The high precipitation rates (>3000 mm/yr equivalent) indicate 'grid-point storms' or excessive locking of precipitation to specific topographic or oceanic features.
Caveats
- The definition of 'intensity distribution' usually implies temporal frequency; however, metadata specifies 'annual-mean', implying this is a spatial distribution of wetness.
- Extreme values in models (>10⁻³ kg m⁻² s⁻¹) are physically implausible for large-scale annual means, confirming them as localized model artifacts.
Precipitation JJA Bias
| Variables | pr |
|---|---|
| Models | ifs-fesom, ifs-nemo, icon, CMIP6 MMM |
| Reference Dataset | MSWEP |
| Units | kg/m2/s |
| Period | 1990–2014 |
| CMIP6 MMM | Global Mean Bias: 0.00 · Rmse: None |
Summary high
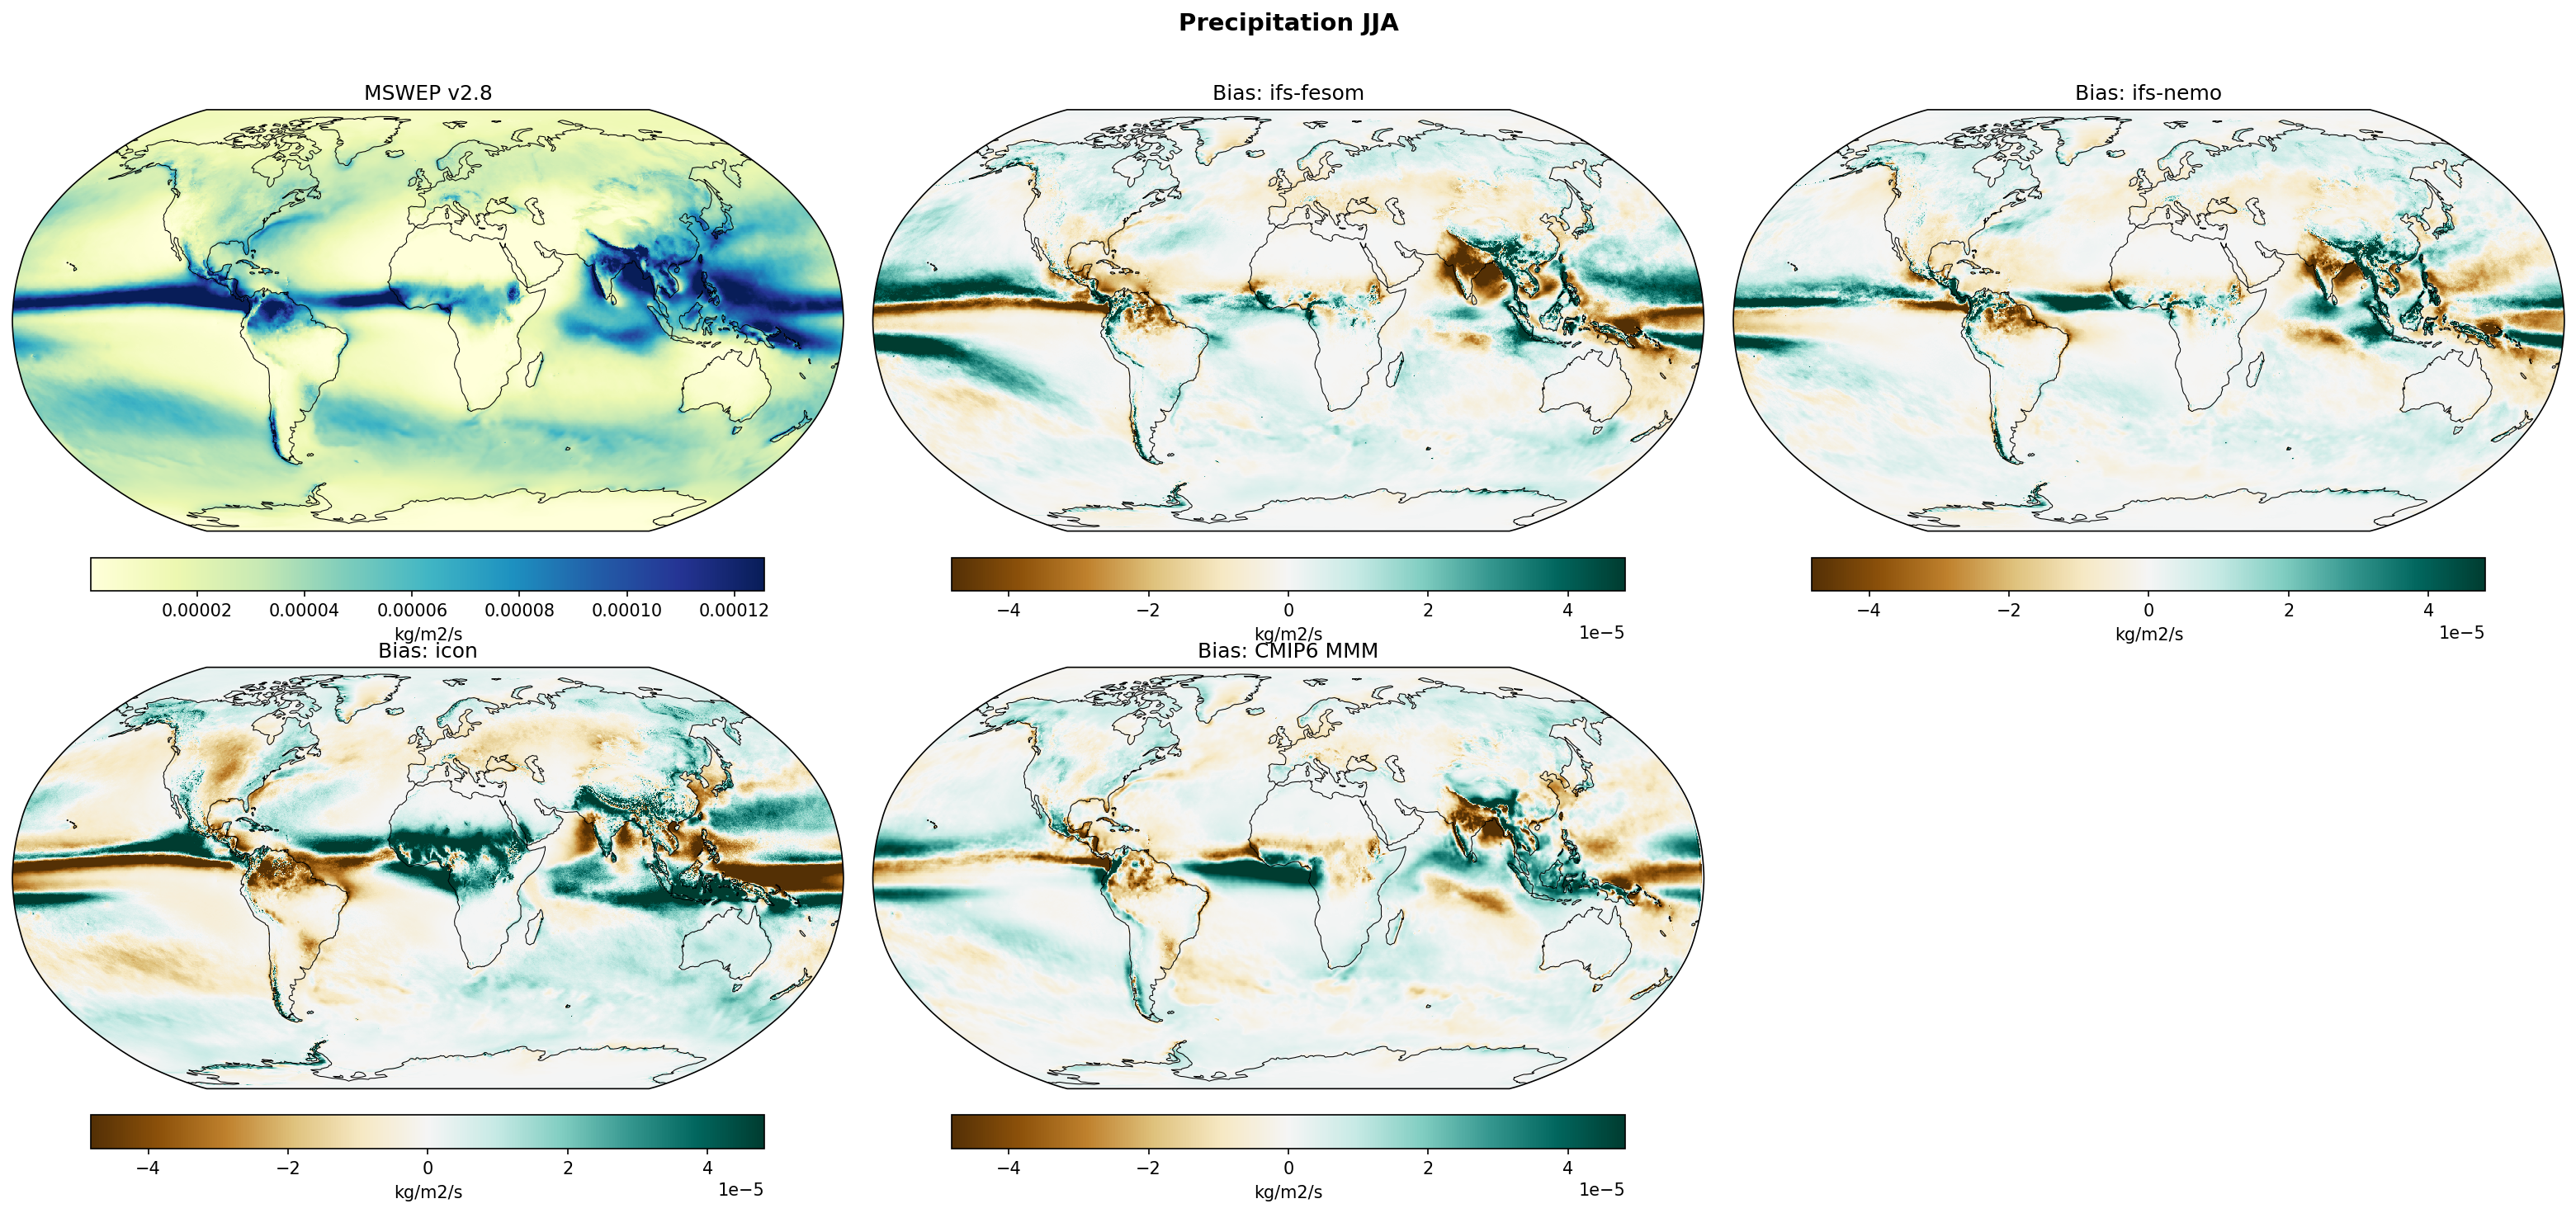
This figure evaluates JJA precipitation biases in high-resolution models (IFS-FESOM, IFS-NEMO, ICON) and the CMIP6 multi-model mean relative to MSWEP v2.8, highlighting significant systematic errors in tropical convergence zones and monsoon regions.
Key Findings
- IFS-FESOM and IFS-NEMO exhibit a strong dry bias over the Indian subcontinent and Bay of Bengal, indicating a deficient South Asian Summer Monsoon, contrasting with a wet bias in the adjacent western Indian Ocean.
- ICON displays a prominent and intense wet bias in the tropical Atlantic ITCZ and Sahel region (West African Monsoon), significantly stronger than the biases seen in the IFS models or CMIP6.
- All models, including the CMIP6 MMM, show a characteristic 'double ITCZ' bias in the Pacific (wet band south of the equator) and a systematic dry bias over the Amazon and Northern South America.
Spatial Patterns
The IFS models show a clear dry-land/wet-ocean contrast in the Indian sector and a zonal band of wet bias in the southern tropical Pacific (~5-10°S). ICON is dominated by a massive wet anomaly spanning the tropical Atlantic and West Africa. All models show sharp wet biases along the flanks of major orography (Andes, Himalayas), likely resolution-dependent artifacts or upslope flow overestimation.
Model Agreement
IFS-FESOM and IFS-NEMO are virtually identical, confirming that the atmospheric component (IFS) dominates precipitation physics over the ocean model choice. ICON diverges significantly from IFS in the Atlantic (much wetter) and Indian Monsoon (mixed wet/dry vs IFS dry). All models agree on the dry Amazon bias.
Physical Interpretation
The 'double ITCZ' bias in the Pacific is a longstanding coupled model error related to SST gradients and convection feedbacks. The IFS dry bias over India suggests issues with monsoon moisture transport or convection triggering over land. ICON's excessive Atlantic/Sahel precipitation implies an overactive West African Monsoon and ITCZ complex, possibly due to parameterisation choices favouring deep convection.
Caveats
- Observational uncertainty in precipitation over open oceans (e.g., ITCZ regions) can be substantial.
- Biases in the high-resolution models often exceed ±3.5 mm/day (±4e-5 kg/m²/s), representing a large fraction of the climatological mean.
Precipitation Seasonal Cycle
| Variables | pr |
|---|---|
| Models | ifs-fesom, ifs-nemo, icon |
| Reference Dataset | MSWEP |
| Units | kg/m2/s |
| Period | 1990–2014 |
Summary high
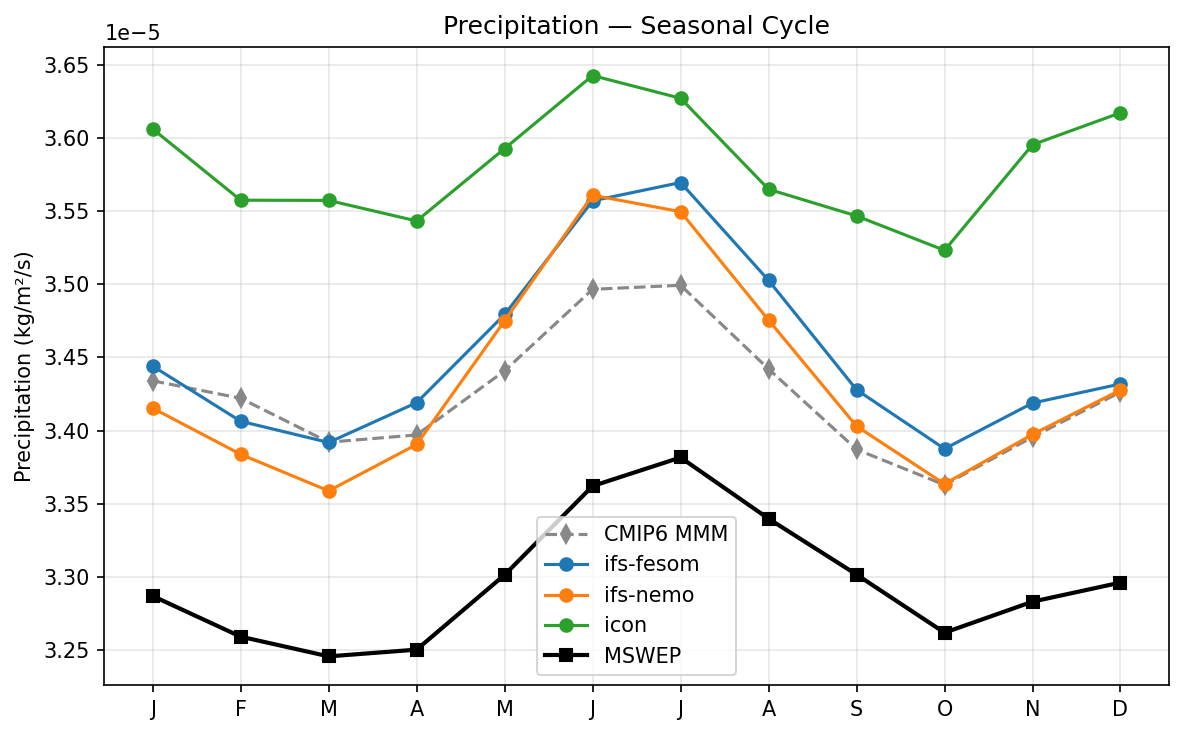
This figure illustrates the seasonal cycle of global mean precipitation for three high-resolution models and the CMIP6 multi-model mean compared against MSWEP observations. All models reproduce the phase of the observed cycle but exhibit a systematic positive (wet) bias throughout the year.
Key Findings
- All simulations, including the CMIP6 MMM, overestimate global mean precipitation compared to MSWEP v2.8 observations.
- ICON displays the largest wet bias, with values consistently 0.2–0.3 × 10⁻⁵ kg/m²/s (~0.17–0.26 mm/day) higher than observations.
- IFS-FESOM and IFS-NEMO closely track the CMIP6 multi-model mean, with IFS-NEMO being slightly drier and closer to observations during the boreal winter and spring.
- The phase of the seasonal cycle is well-captured by all models, showing a global minimum in March and a maximum in June/July, driven by the Northern Hemisphere landmass dominance.
Spatial Patterns
The temporal pattern shows a robust seasonal cycle with a peak in boreal summer (June-July) and a minimum in March. While the timing of the minimum and maximum aligns well with MSWEP, the models tend to show a more pronounced secondary increase in December/January compared to the relatively flatter winter values in the observations.
Model Agreement
There is strong agreement on the phase of the seasonal cycle across all models. In terms of magnitude, the IFS variants (FESOM and NEMO) agree closely with the CMIP6 ensemble mean. ICON is an outlier with significantly higher precipitation rates year-round. IFS-NEMO performs best among the models shown, having the smallest bias in the first half of the year.
Physical Interpretation
The global precipitation maximum in boreal summer generally reflects the northward migration of the ITCZ and stronger convective activity over Northern Hemisphere landmasses. The systematic wet bias is a common feature in global climate models, often related to the parameterization of convection and the need to balance the global energy budget (radiative cooling balanced by latent heat release), which can result in higher evaporation and precipitation rates than observational products suggest.
Caveats
- Global mean precipitation in observational datasets like MSWEP has inherent uncertainties, particularly over oceans where gauge data is absent.
- The wet bias in models is a longstanding issue and may partially reflect energy balance constraints rather than purely a precipitation error.
Precipitation Global Mean Time Series
| Variables | pr |
|---|---|
| Models | ifs-fesom, ifs-nemo, icon |
| Reference Dataset | MSWEP |
| Units | kg/m2/s |
| Period | 1990–2014 |
Summary high
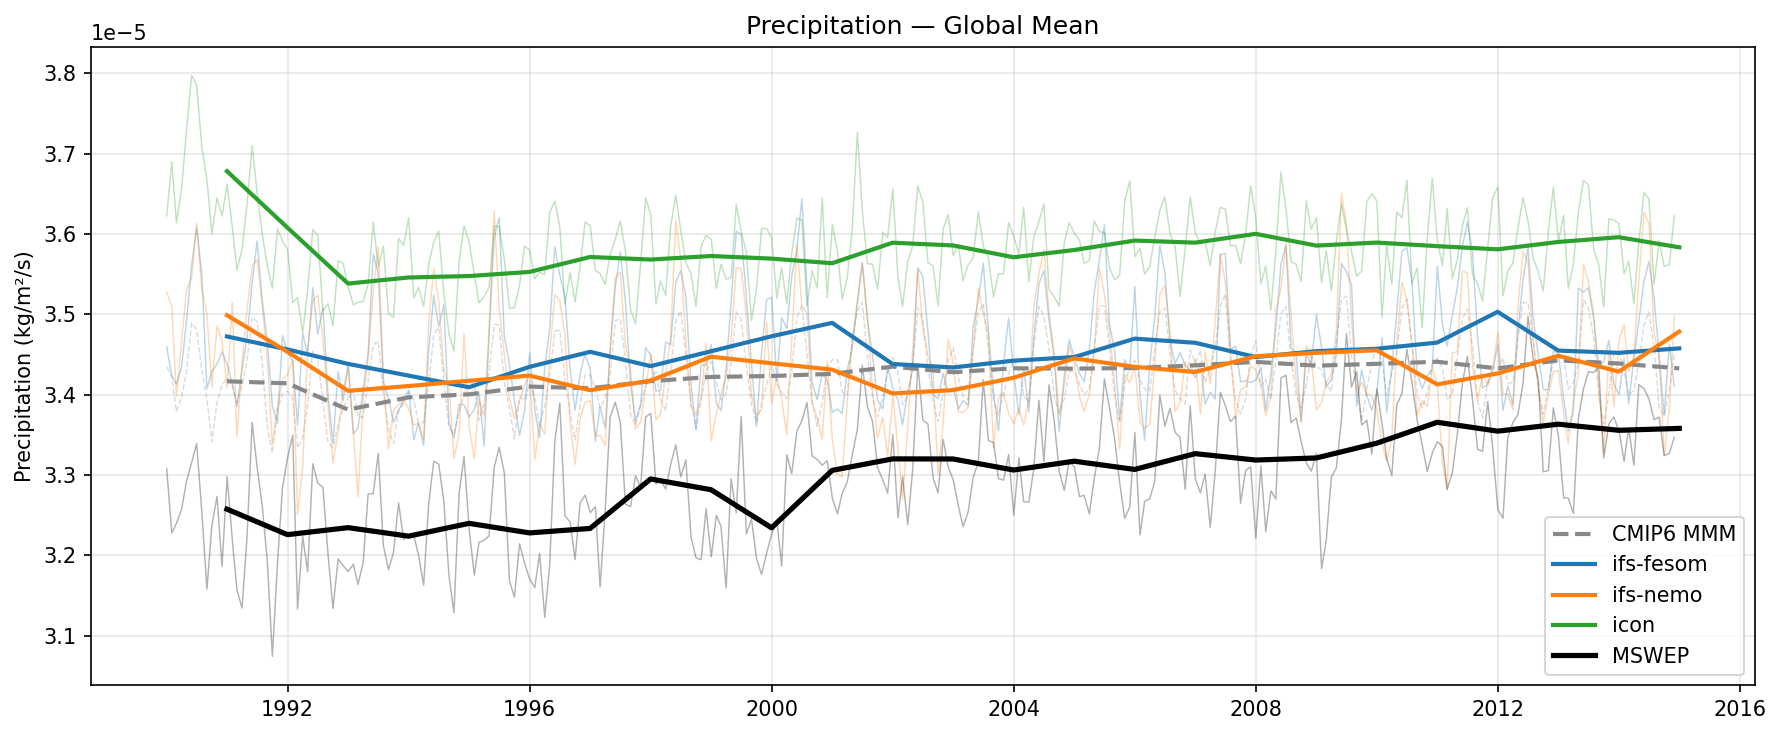
Global mean precipitation time series showing that all evaluated high-resolution models and the CMIP6 multi-model mean systematically overestimate precipitation relative to MSWEP observations.
Key Findings
- All models exhibit a positive bias compared to MSWEP, with ICON showing the largest deviation (~9-10% wet bias).
- ICON displays a significant initial drift (spin-up) during the 1990–1993 period before stabilising at a higher mean state (~3.6e-5 kg/m²/s) than the IFS variants.
- IFS-FESOM and IFS-NEMO track closer to the CMIP6 Multi-Model Mean (~3.45e-5 kg/m²/s) but remain wetter than MSWEP (~3.3e-5 kg/m²/s).
- MSWEP observations show a notable increasing trend starting around 2000, which is only weakly replicated in IFS-FESOM and largely absent in the other models.
Spatial Patterns
Temporally, the most distinct feature is the observational upward trend in the 2000s (potentially related to ENSO phase changes or observing system shifts) and the initial adjustment shock in the ICON simulation.
Model Agreement
There is strong inter-model agreement on the sign of the bias (positive/wet) but disagreement on magnitude. The IFS-FESOM and IFS-NEMO simulations are relatively close to each other and the CMIP6 mean, while ICON is a distinct outlier with higher precipitation rates.
Physical Interpretation
The pervasive wet bias is a common feature in global climate models, often attributed to the 'drizzle problem' (excessive weak convection) and constraints imposed by the atmospheric energy budget (latent heating must balance radiative cooling). The higher values in ICON suggest a more active hydrological cycle, potentially driven by higher evaporation rates or different convective parameterisation tuning compared to the IFS family.
Caveats
- Global mean precipitation is difficult to constrain observationally; MSWEP is a merged product and may have its own structural uncertainties.
- The initial drift in ICON indicates the model was likely not fully equilibrated at the start of the analysis period.
Precipitation Zonal Mean Profile
| Variables | pr |
|---|---|
| Models | CMIP6 MMM, ifs-fesom, ifs-nemo, icon, MSWEP |
| Reference Dataset | MSWEP |
| Units | kg/m2/s |
| Period | 1990–2014 |
Summary high
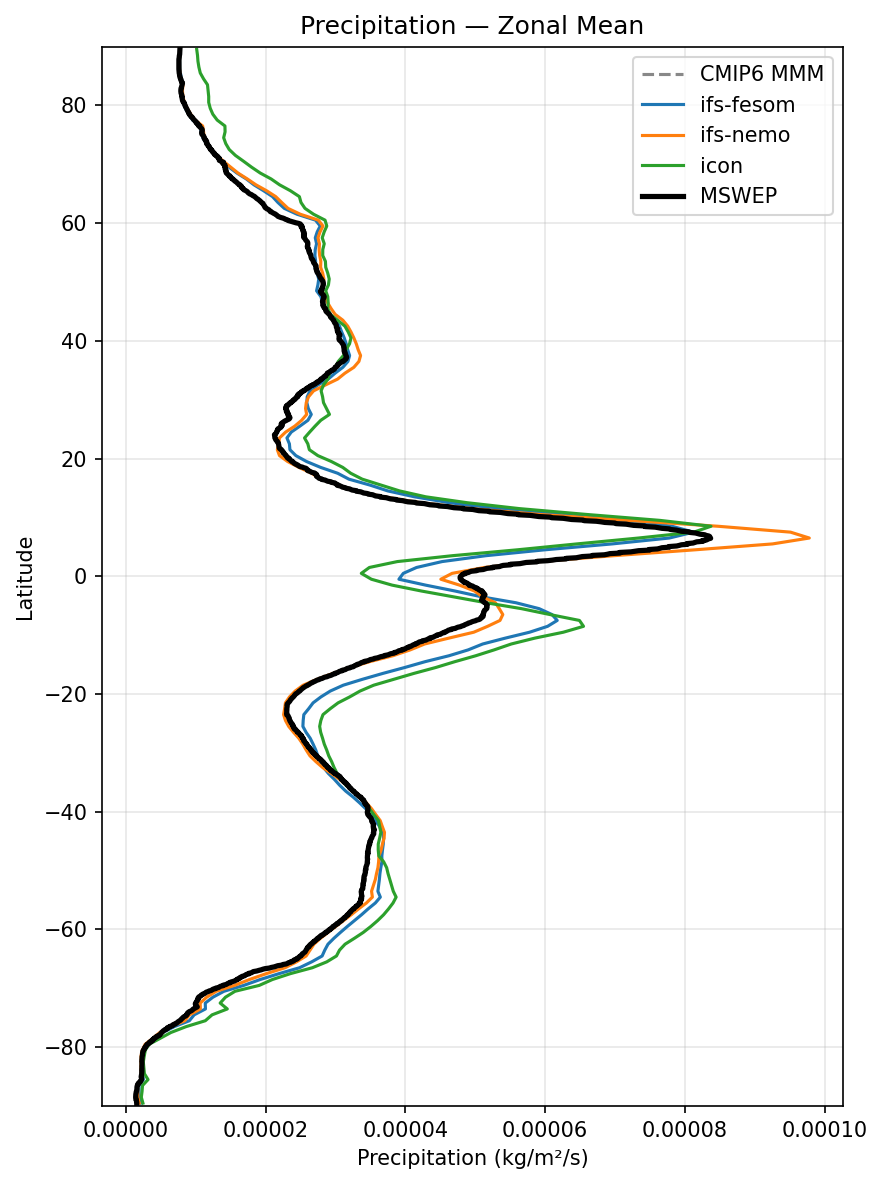
The diagnostic compares zonal mean precipitation profiles, revealing that while the models capture the general latitudinal structure of the hydrological cycle, significant biases exist in the Intertropical Convergence Zone (ITCZ) intensity and structure.
Key Findings
- ifs-nemo exhibits a strong wet bias in the primary Northern Hemisphere ITCZ peak (~7°N), reaching intensities significantly higher than MSWEP and other models.
- Both ifs-fesom and icon display a distinct 'double ITCZ' bias, characterised by a spurious secondary precipitation peak around 5–10°S which is absent in the MSWEP observations.
- icon shows a systematic wet bias across the Southern Hemisphere, failing to capture the depth of the subtropical dry zone (~20–30°S) and overestimating precipitation in high latitudes compared to IFS models and observations.
- In the Northern Hemisphere extratropics, ifs-fesom and ifs-nemo track the observational storm track profile well, whereas icon remains consistently wetter than MSWEP.
Spatial Patterns
The profile is dominated by the tropical peak (ITCZ) and mid-latitude storm tracks. Models correctly place the primary ITCZ in the NH, but double-peaked structures appear in the SH tropics for icon and ifs-fesom. The subtropical dry zones are clearly defined but often overestimated (too wet) by icon.
Model Agreement
ifs-fesom provides the best agreement with MSWEP in the extratropics and the primary ITCZ magnitude (though not structure). ifs-nemo diverges most in the deep tropics with excessive rainfall. icon is an outlier with a global wet bias relative to the other high-resolution models.
Physical Interpretation
The double ITCZ bias in ifs-fesom and icon likely stems from errors in meridional SST gradients (e.g., cold tongue bias) or convection parameterisation allowing excessive convection in the southern tropics. The intense peak in ifs-nemo suggests overly vigorous deep convection parameterisation. The widespread wet bias in icon indicates a highly active hydrological cycle, potentially due to cloud microphysics or autoconversion tuning.
Caveats
- Zonal averaging obscures longitudinal differences, such as the contrast between Pacific and Atlantic basin biases.
- MSWEP observations have higher uncertainty over open oceans where gauge data is absent.